Banking Customer 2020
Eight trends around customer
attitudes, expectations and
behaviors are directing the
future of banking.
For a decade now, the Accenture Global Consumer Pulse Research study
has annually tracked the intentions and actions of consumers around the
world. This year’s study included a special and significant cut for retail
banking, sampling more than 16,000 bank customers.
Banking survey results echo the industry reality that digital is the pulse
of banking customer interactions. It continues to influence customer
behavior, expectations and needs, to the point at which all customers are
now digital customers—albeit ones who move at different speeds. Yet,
findings also show banks’ continuing vulnerability to churn as customers
still encounter confusing web sites, staggering call center wait times,
and difficulty solving their problems regardless of the channel they use.
What can banks do to drive customer engagement and capture a greater
share of the digital opportunity? Become an Everyday Bank, placing
themselves at the center of a digital, interconnected ecosystem of
cross-industry providers and services that serves customers’ everyday needs.
Winners will be those that manage to show solid customer metrics with
strong retention/engagement.
Retail banking view of the Accenture Global Consumer
Pulse Research annual study
• Assessed consumer attitudes toward the customer experience (including marketing, sales and customer service practices) and consumers’ behaviors in response to companies’ practices.
• Surveyed global, cross-industry sample of more than 23,600 end customers with online access in 33 countries via the Internet. Each respondent could evaluate up to four out of ten industries.
• For Retail Banking, this resulted in a sample of 16,528 decision-making respondents.
• Selected bank-specific questions were asked to a sub-sample of 9,000 respondents across 12 key growth markets identified as banking.
At the opposite end of the spectrum are consumers who still lean heavily on traditional channels, but even they are likely to use available digital channels at different times for certain activities. Most banks’ customer strategies, fueled by customer analytics, will need to change to really take advantage of customers’ new channel preferences. For example, our research shows that consumers between 18 and 34 years, those who have grown up immersed in digital technologies, are two to three times more likely than consumers older than 55 to want more digital interactions than companies currently support. Yet our experience shows that the older group is surprisingly open to adding other channels to their portfolio and is experimenting with online interactions, using a wider
Every Bank Customer
Is a
Digital Customer
variety of contact channels in specific industries to meet select needs. By focusing on millennials, most companies are missing an important opportunity.
Enabled by technology, customers expect to easily control and vary their routes within and across channels to suit their needs at any given moment. While customers move at different speeds and take different paths, every customer is now a digital customer – from the traditional customer to the digital-savvy one (Figure 1). As a result, customers find it easier to compare a provider’s promise with its delivery and how the overall customer experience meets their own expectations— and subsequently make changes if they find their bank isn’t as “digitally intense” as they would want it to be.
While consumers have embraced digital technologies to varying
degrees, digital has become more important to consumers
across the board. Some consumers have completely “gone
digital”—20 percent of bank customers are digital-only users,
preferring to prospect and purchase online.
FIGURE 1. Every Customer Is a Digital Customer
They rely on traditional channels & interactions. Even then, they leave digital traces.
They selectively engage in digital for utility value, discovering how the experience improves.
They strive to leverage digital more broadly but may not always be able to do so.
They make digital technology part of all dimensions in their life. Mobile access is key.
Traditional Experimental Transitional Digital Savvy
Increased Speed
However, an important portion of banking consumers continue to actively consider their choices. Our survey found that 18 percent of bank customers switched com-pletely and 27 percent added new provid-ers. Over the last five years, the combined switch rates (customers who switched completely from one bank to another or partially by adding new providers to existing ones) increased globally by eight percent. In the past three years, 58 percent of consumers have done business with more
Eight Trends
to Influence
Banks’ Strategies
than two providers. Four out of the 10 financial products owned by customers on average are from outside their main bank. Leading banks around the world recognize the shift in consumer behavior and what’s at stake: market share. They continue to invest in customer retention and ways to attract other consumers in search of better alternatives. The challenge is whether or not banks’ actions are hitting the mark when it comes to their customer strategies.
The good news is that retail banking, along with a few other
industries, remained in the top sectors who provide a positive
customer experience. Our study found that 36 percent of global
bank customers are extremely satisfied, one-third feels loyal
to and 28 percent would recommend their providers. Across
satisfaction and loyalty, retail banking scored higher than the
global cross-industry averages.
Our research identified eight trends to influence banks’ strategies, compelling more of the right tactics to both quell customer churn and keep pace with a quickly-evolving consumer base.
Trend #1:
Customers are
buying, but less so from
current providers
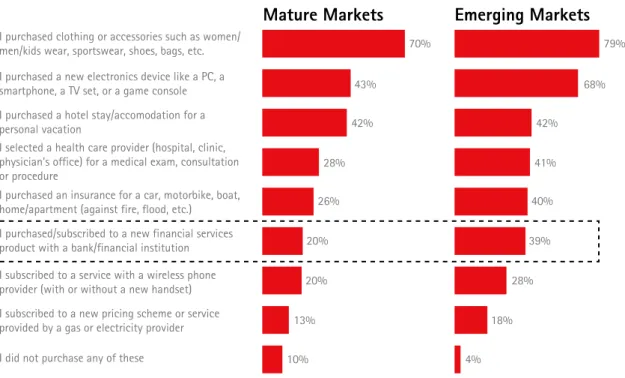
Globally, 27 percent of bank customers purchased/subscribed to a new financial product/service over the last six months, in line with 2013 findings (Figure 2). This proportion is much higher in emerging markets (39 percent) than in mature ones (20 percent). Yet over the past six years, the proportion of consumers in our study who expressed their intention to buy less from their current providers has increased.
FIGURE 2. Purchases situations
Which of the following purchasing situations have you carried out in the past six months?
Base = 23,665 (total global respondents)
I purchased clothing or accessories such as women/ men/kids wear, sportswear, shoes, bags, etc. I purchased a new electronics device like a PC, a smartphone, a TV set, or a game console I purchased a hotel stay/accomodation for a personal vacation
I selected a health care provider (hospital, clinic, physician’s office) for a medical exam, consultation or procedure
I purchased an insurance for a car, motorbike, boat, home/apartment (against fire, flood, etc.)
I purchased/subscribed to a new financial services product with a bank/financial institution I subscribed to a service with a wireless phone provider (with or without a new handset) I subscribed to a new pricing scheme or service provided by a gas or electricity provider I did not purchase any of these
70% 43% 42% 28% 26% 20% 20% 13% 10% 79% 68% 42% 41% 40% 39% 28% 18% 4%
Trend #2:
First-contact
resolution is key to retention
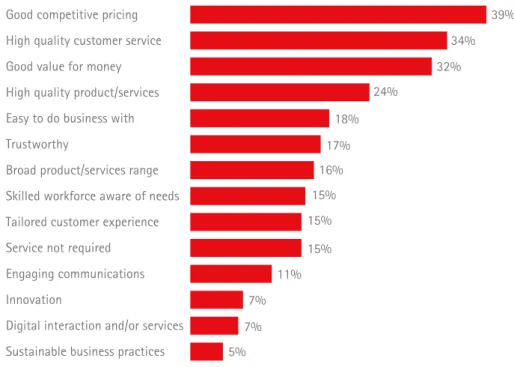
Good competitive pricing, high quality customer service and good value for money are the top three dominant factors that convince customers to switch to another bank (Figure 3). It’s not a coincidence that banking also has been among the most highly disrupted industries by digital technologies in recent years. Of the consumers who switched to another provider due to poor service, more than
FIGURE 3. Reasons for complete switch
How much did each of the following reasons contribute to your decision to switch/ stop doing business? (Check up to top three reasons)
Good competitive pricing High quality customer service Good value for money High quality product/services Easy to do business with Trustworthy
Broad product/services range Skilled workforce aware of needs Tailored customer experience Service not required Engaging communications Innovation
Digital interaction and/or services Sustainable business practices
Base = 2,984 (retail banking customers who switched completely)
39% 34% 32% 24% 18% 17% 16% 15% 15% 15% 11% 7% 7% 5%
80 percent said they could have been retained, mainly if their issue had been resolved on their first contact with the bank. Yet first-contact resolution has consistently remained the top frustration factor for consumers in the past five years (generally cited by around eight in 10), and the percentage of consumers expressing satisfaction with how companies have handled it has increased only marginally since 2009 (from 41 percent to 45 percent).
Trend #3:
Digital channels
have significantly increased the
number of overall interactions
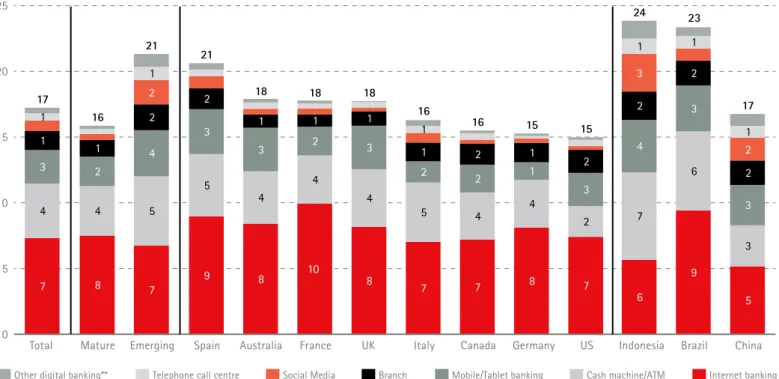
Consumers continue to rely on multiple channels (an average of three or more) when prospecting, with the corporate website and online expert/comparison sites most relied on followed by word-of-mouth, online reviews and branches. More than last year, 58 percent of bank customers use mobile devices often when prospecting or seeking support. Out of the average 17 interactions per month made by a customer with its main bank, seven are through on-line banking and three are through mobile/tablet. Emerging markets, where the average of total monthly interactions is 21, display an even higher propensity to use digital channels (Figure 4).
Despite being satisfied with
online customer service channels
compared with traditional
channels, consumers are ripe
for more.
Trend #4:
After switching to
digital, customers are looking
for more services
Despite being satisfied with online customer service channels compared with traditional channels, consumers are ripe for more. Globally, online banking is very frequently used for prospection and access to services, but less to fix issues (Figure 5). Online subscriptions grew six percent to 60 percent; mobile is used more for them while branches are used less. Of consumers who seek advice in the branch, half of them use an online channel to purchase/ subscribe. Still, 61 percent of banking customers expect to have access to more online interactions across their lifecycle. Several barriers banks will need to address completely include the lack of the right information provided by the channels, lack of trust in them and lack of knowledge of how to access and use them.
FIGURE 4. Interactions by channels
How many times do you usually interact/get in touch with your main bank, on monthly basis, using the methods listed? (Provide number of interactions)
*Base = 9,000 (Total retail banking respondents in12 key markets: Australia, Brazil, Canada, China, France, Germany, Indonesia, Italy, Spain, UK, US **Other Digital Channels = Video chat and Instant messaging
7 8 7 9 8 10 8 7 7 8 7 6 9 5 4 4 5 5 4 4 4 5 4 4 2 7 6 3 3 2 4 3 3 2 3 2 2 1 3 4 3 3 1 1 2 2 1 1 1 1 2 1 2 2 2 2 2 3 2 1 1 1 1 1 1 17 16 21 21 18 18 18 16 16 15 15 24 23 17 0 5 10 15 20 25
Total Mature Spain Australia France UK Italy Canada Germany US Indonesia Brazil China
Other digital banking** Telephone call centre Social Media Branch Mobile/Tablet banking Cash machine/ATM Internet banking
Emerging
FIGURE 5. Most frequent banking activities by channel
How frequently do you use the methods listed below with your main bank?
*Base = 9,000 (Total retail banking respondents in12 key markets: Australia, Brazil, Canada, China, France, Germany, Indonesia, Italy, Japan, Spain, UK, US At least once a month At least once a year Never
14% 37% 16% 24% 11% 9% 64% 42% 61% 13% 30% 13% 20% 43% 10% 32% 12% 10% 48% 23% 44% 12% 24% 14% 32% 34% 46% 56% 64% 76% 22% 21% 23% 63% 59% 78% Internet
Banking Branch Cash machine & ATM
Call
Center Mobile/ Tablet Banking
Social
Media Banking Internet Branch Cash machine & ATM
Call
Center Mobile/ Tablet Banking
Social
Media Banking Internet Branch Cash machine & ATM
Call
Center Mobile/ Tablet Banking Social Media 32% 50% 18% 34% 15% 10% 21% 15% 17% 12% 15% 11% 47% 35% 65% 55% 70% 79%
RESEARCH & ADVICE
(e.g. seeking advice, finding offers, rates) ACCESSING SERVICES (e.g., making a payments, money transfer)
FIXING ISSUES
Trend #5:
High, but slower
growth in, customer service
expectations gives banks a
chance to catch up
In line with last year, trustworthiness, employee skills, high quality of services and ease of doing business are the core drivers of customer satisfaction for banking with more than 30 percent of consumers agreeing to it (Figure 6). Yet, while the general pool of consumers’ expectations for customer service have increased greatly since 2007, growth is slowing, which gives companies a chance to catch up. Unfortunately, the percent-age of consumers switching due to poor service has decreased only slightly during that time, indicating that most companies are still not giving consumers the kind of service they want. Indeed, the percentage of consumers saying their biggest frustrations with providers—failure to deliver on their promises, inefficient and slow customer service, and lack of interaction convenience— have remained consistent in the past few years.
Trend #6:
Customer loyalty
program adoption is rising,
but fails to keep customers
committed for the long haul
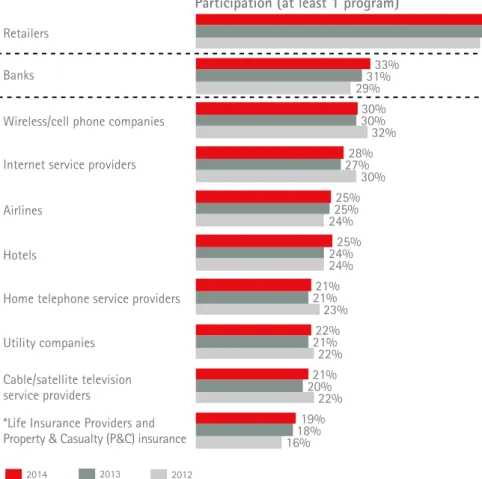
Across industries, the percentage of consumers saying they participate in at least one customer loyalty program has increased since 2009, as has the percentage indicating such programs persuade them to stay with a provider. One-third of banking consumers participated in at least one loyalty program, about the same as last year (Figure 7). Efficiency of the banking loyalty programs (measuring customers who stayed with their providers because of the program) remains at around 56 percent. However, program adoption is primarily driven by the desire to gain access to the “best deals,” indicating a sort of short-term loyalty that fails to keep customers committed for the long haul. While consumers stated increased loyalty due to such programs, their actual behaviors indicate they continue to leave providers at a high rate.
FIGURE 6. Core drivers of satisfaction
What you like about the companies you do business with today? (Rating scale: 1 = Does not describe at all, 10 = Describes very well)
FIGURE 7. Loyalty programs
Have you participated in any companies’ customer loyalty programs over the past 12 months?
Trustworthy
Skilled workforce aware of needs High quality customer service Easy to do business with Broad product/services range High quality product/services Tailored customer experience Offer digital experience in interaction/services* Good competitive pricing Good value for the money Engaging communications Innovation
Sustainable business practice
Base = 16,528 (total retail banking respondents)
35% 33% 32% 32% 27% 27% 27% 26% 24% 23% 23% 23% 17% Core drivers of Satisfaction (Top 3 boxes)
* Fixed Service Provider (excluding Cable/Satellite) replaced Landline Phone Service Providers in 2014) ** Life Insurance Providers & Healthcare Providers included in 2014
Participation (at least 1 program)
Hotels Retailers Banks
Wireless/cell phone companies Internet service providers Airlines
Home telephone service providers Utility companies
Cable/satellite television service providers
*Life Insurance Providers and
Property & Casualty (P&C) insurance 16% 22% 22% 23% 24% 24% 30% 32% 29% 53% 18% 20% 21% 21% 24% 25% 27% 30% 31% 54% 19% 21% 22% 21% 25% 25% 28% 30% 33% 55% 2014 2013 2012
Trend #7:
Compelling offers
could win back customers
More than 30 percent of consumers switched their bank providers in the past six to 12 months due to good competitive pricing, high customer service quality or good value for money. In line with last year’s findings, 27 percent of consumers would shop for better deals and 31 percent find the switching hassle to be low. Offering differentiation is only perceived by about a fourth of consumers and less than one-in-six profess a high industry involvement. About one-third of consumers across industries who switched from a provider said they would consider returning within two years for better pricing or a superior product. That’s the good news, and a real mindset shift for companies that miss this opportunity.
Trend #8:
“Non-traditional”
competitors are gaining
ground with consumers.
Across industries globally, 44 percent of consumers would be open to consider products and services from companies that are not generally considered part of traditional industry definitions; 43 percent would be open to products/services from other consumers, not companies. In banking, other Accenture research recently showed that nearly half of customers would likely bank with a company they currently do business with but that does not currently offer banking services.1 The number surpasses 70 percent for those ages 18 to 34. This includes financial players such as PayPal, Inc., and Square, Inc., and brands outside the financial sector like Apple, Inc.; Google, Inc.; and Amazon.com, Inc. Accenture separately estimates that competition from non-banks could erode one-third of traditional bank revenues in North America by 2020.2
1Accenture 2014 North America Consumer Digital
Banking Survey
2Accenture, The Everyday Bank: A New Vision for the
When analyzing consumers’ attitudes towards innovative banking models, the survey shows that those models that heavily incorporate digital (for example, a pure digital bank), garner very different levels of acceptance. Mature markets—the US, Canada, Australia and Europe—are much more cautious while emerging or “growth” markets show a largely favorable attitude. The affirmative agreement ratio differs by a factor of 2 to 3 between both
How Banks Can
Keep
and Win
Customers
Simply “being more digital”—closing down branches and rolling
out better mobile and online banking services, for example—
will not give banks the differentiation they need to capture the
attention of, retain and best serve today’s digital customers.
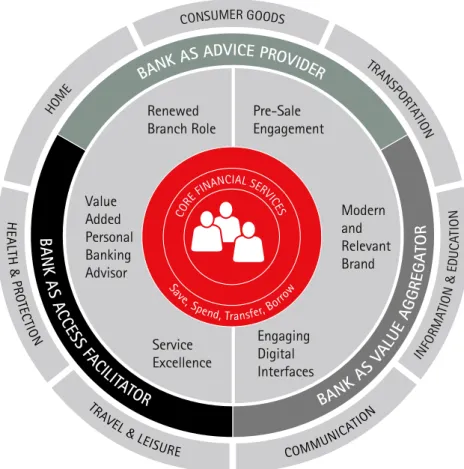
FIGURE 8. The Everyday Bank
BANK A S VAL UE AGGR EGAT OR
BA
NK
AS
AC
CE
SS
FAC
ILITA
TOR
BANK AS ADVICE PROVIDER
INFO RM ATIO N& EDU CA TI O N HOM E O CONSUMER GO DS TRA NSPOR TATIO N Renewed Branch Role Value Added Personal Banking Advisor Service Excellence Engaging Digital Interfaces Modern and Relevant Brand Pre-Sale Engagement Sav
e, Spend, Transfer, Borrow
CORE
FINANCIAL SERVIC ES COMMUNI CATIO N TRA VEL & LEISURE H EA LTH & P RO TE CTIO N
market types. On the contrary, innovative banking models based on the bank offering a range of both banking and non-banking services generate higher interest and positive reactions across all countries. Specifically, a bank that is able to address real needs and provide strong value for money, using partnerships with non-banking players that bring a wider range of products and services than those of a traditional bank.
One-third of all customers are generally open to such a business model that we call the Everyday Bank. Banks that want to lead the trends rather than follow will become an Everyday Bank, placing them-selves further into the commercial lives of their customers and satisfying a broad range of life-cycle needs before, during and after moments of financial transactions. As part of a digital ecosystem, the Everyday Bank assumes three distinct, digitally-powered roles (Figure 8):
• Advice Provider: recommending specific, targeted buying suggestions
• Access Facilitator: to financial services and non-financial services partners
• Value Aggregator: through real-time, dynamically-priced offerings.
The Everyday Bank creates an immersive relationship with customers to increase penetration of purely digital customers and cuts digital churn by up to 50 percent. Through it, banks can:
• Increase the quality of the customer experience by combining their vast amounts of customer and transaction data with digital capabilities. This means providing simple, convenient services that improve customer’s ability to manage and make better decisions on their financial matters. La Caixa, for example, within its e-banking service (Linea Abierta) has developed a service called Real Time Decision to improve the customers’ interaction with La Caixa’s Home Banking service. The technology helps consistently make the best possible decisions in real time, automatically and using self-learning techniques, making use of all the information the bank has available on the customer. The bank will offer customers products that match their interests on the basis of real-time analysis.
• Grow sales through continuous daily customer interaction generated across partnerships and connections with provider partners who offer goods and services in every area of consumption, from retail and home services to health, security, travel, leisure, communication and transportation. Based on our experience, a digital customer interacts with providers 12 times more than a non-digital customer. More customer interactions means more opportunities to better understand customer needs to present more relevant offers at the right time and place—enough to increase retention and sell additional products.
• Nurture loyalty to the bank by developing digital capabilities of relationship managers, empowering them to keep pace with customer evolutions. A good example is the BankAmeriDeals service of Bank of America, an innovative and advanced cash back loyalty program. This program is free for all online banking customers and offers discounts on targeted deals. BankAmeriDeals’ discounts are focused on customers’ card spending habits, based especially on previous purchases made in stores. Customers pay the full price with their card, then they receive monthly the discount as a cash back reward.
• Optimize front- and back-office processes for speed, efficiency and scalability— thanks to high automation and partner integration.
The Everyday Bank model is the future of the
banking industry. Although the journey to get
there will be different for every bank, leaders
of the transition will need to determine
answers for four key questions:
• What is our distinct identity as an Everyday Bank? • What does our extraordinary customer experience
look like?
• What is our digital ecosystem, and how do we
orchestrate it?
•
What is the enabling digital platform?
Retail banks should explore approaches that can
lower risk and cost to serve while accelerating
their timelines.
About Accenture
Accenture is a global management consulting, technology services and outsourcing company, with approximately 323,000 people serving clients in more than 120 countries. Combining unparalleled experience, comprehensive capabilities across all industries and business functions, and extensive research on the world’s most successful companies, Accenture collaborates with clients to help them become high-performance businesses and governments. The company generated net revenues of US$30.0 billion for the fiscal year ended Aug. 31, 2014. Its home page is www.accenture.com.
Contacts
To discuss the banking survey results in more detail or how Accenture can help with your digital banking strategy, please contact:
Piercarlo Gera
Senior Managing Director, Accenture Strategy Banking
[email protected] Robert Wollan
Senior Managing Director, Accenture Strategy, Sales & Customer Services [email protected] Francesca Caminiti
Accenture Research Banking [email protected]
Copyright © 2015 Accenture All rights reserved.
Accenture, its logo, and High Performance Delivered are trademarks of Accenture.