ISSN:2455-3956, Volume-2, Issue-4, April 2016 Pages 16-21
Abstract — Surfaces quality is one of the most specified customer requirements for machine parts. The major indication of surfaces quality on machined parts is surface roughness. The research aim is to study the cutting conditions and their effects on the surface roughness. This research will use regression models and neuro-fuzzy to predict surface roughness over the machining time for variety of cutting conditions in turning. In the experimental part for turning, different types of materials (Aluminum alloy, brass alloy, and low carbon steel) were considered with different cutting speed, and feed rate. A linear regression and neuro-fuzzy model depending on statistical-mathematical method between surface roughness, Ra,
and cutting condition will be derived, for the three materials. The effect of cutting parameters on surface roughness is evaluated and the optimum cutting condition for minimizing the surface roughness will be determined. The model will be established between the cutting conditions and surface roughness using regression and neuro-fuzzy model. As the results of this work, the linear regression and neuro-fuzzy model will be used in predicting surface roughness, can be used in manufacturing systems, this modeling helps engineer to reduce the efforts and improve the quality.
I. INTRODUCTION
The surface quality is quite important for the efficient working of machine parts. The structure of a machined surface is one of the most important criteria in terms of quality, and tribological properties of the machined surface are considerably affected from the surface tissue. Generally, the surface quality is characterized with surface roughness. Surface roughness is an important factor which must be considered not only in the conventional subjects of tribology such as abrasion, friction and lubrication but also in different fields such as sealing, hydrodynamics, electrical and heat
D. K. Suker, Department of Mechanical Engineering, Collage of Engineering and Islamic Architecture, Umm Al-Qura University, Makkah, KSA, +966-5599-02-364,
M. S. Alsoufi, Mechanical Engineering Department, Collage of Engineering and Islamic Architecture, Umm Al-Qura University, Makkah, KSA, +966-5545-00-088,
M. M. Alhusaini, Department of Mechanical Engineering, Collage of
conductivity. Surface roughness is mainly affected during the machining process by cutting parameters such as cutting speed, feed rate and constant depth of cut. If these parameters are not chosen convenient, the surface roughness increases. This situation creates a notch effect and results in crack initiation, decrease in fatigue strength and corrosion resistance. So, the characterization and measurement of surface roughness has a great important in the sense of the optimization of machining process [4, 5]. Average roughness (Ra) is defined as the average roughness of the profile about
the mean line (usually the least squares mean line or that generated by a standard filter). It represents the average absolute deviation of the profile points from a mean line and
is perhaps the most widely used ―quoted‖ parameter. If z =
f(x) is the profile measured from the reference mean line and
L is the length of the profile measured from the reference mean line L is the length of the profile being assessed, then Ra
is defined by
An equally spaced digitised 3D surface can be denoted by a function z(xi, yi) with xi = i∆x and yj = j∆y, whereby i = 1, 2, 3,
..., M and j = 1, 2, 3, ..., N. ∆x and ∆y are sampling intervals. M and N represent the number of sampling data points in the
x and y directions, respectively. The 3D parameters are passed on the residual surface η(x, y), which is the difference between the original surface z(xi, yi) and the reference datum
f(xi, yi). The average amplitude of the surface Sa is defined in
3D as
This is an arithmetic average parameter. It insensitive to
Studying the Effect of Cutting Conditions in Turning
Process on Surface Roughness for Different
Materials
effect of feed rate, spindle speed with three different material hardness on surface roughness, Ra.
II. METHODOLOGY
Neuro-Fuzzy Modeling
The adaptive network based fuzzy inference system (ANFIS) architecture and learning is based on a fuzzy inference system [6] implemented in a framework of an adaptive network. Using a hybrid learning procedure, ANFIS can learn an input-output mapping based on human knowledge (in the form of if-then fuzzy rules). The ANFIS architecture has been employed to model non-linear functions, identify non-linear components on-line in a control system, and predict a chaotic time series. ANFIS performs the identification of an input-output mapping, available in the form of a set of N input-output examples, with a fuzzy architecture, inspired by the Takagi-Sugeno modeling approach [7]. The fuzzy architecture is characterized by a set of rules, which are properly initialized and tuned by a learning algorithm. The rules are in the form:
if speed1 is A11 and feed1 is A12 and size1 is A13 then output =f1(speed1,feed1,size1)
if speed2 is A21 and feed2 is A22 and size2 is A23 then output =f2(speed2,feed2,size2)
Where, Aij are parametric membership functions.
The model topology was based on TSK type, 2 input variables, 3 Gaussian membership functions for each variable, 9 rules; training was performed to 30 epochs. Three models were generated, for carbon, brass and aluminum. Results of the models response surface are shown in the following sections. Linear regression equation is given by:
Roughness, Ra = a × feed rate + b × speed + c
III. EXPERIMENTAL PROCEDURE
A. MATERIALS SELECTION
More than 36 samples (a rod bar, from Saline Water Conversion Corporation, Al Shuaiba, KSA) were used in this study with identical dimensions of length of 80 mm (length) × 38 mm (diameter). A saw machine was used to cut the rod bar into identical dimensions. Figure 1 shows the image of the samples (rod bars) to be tested and Table 1 shows the data sheet of the material specifications.
Figure 1: low steel rod while machining
Table 1: material specifications
The chemical compositions and mechanical properties of work materials are shown in Tables 2, 3 and 4, respectively. The effectiveness of turning process can be determined by the effects of surface layer and depend upon three parameters of cutting conditions have been chosen which are cutting speed, feed rate and three different materials (different hardness):
1) Cutting speed, v = 132, 260, 320 and 500 m/min.
2) Feed rate, f = 0.18, 0.31, 0.71 mm/rev.
3) Depth of cut, DOC = 0.5 mm.
Table 2: Chemical compositions of Aluminum 5052
Al Mn Mg Si Cu Ti Zn Fe Cr
96.1 0.1 2.3 0.25 0.1 0.1 0.1 0.4 0.15
Table 3: Chemical compositions of Brass
Cu Fe Pb Zn Sn Ni Ti Al Fe
60.4 0.35 2.7 34.7
- 0.30 0.25 0.05 0.34
Table 4: Chemical compositions of low alloy steel
Fe Mn Cu Si Zn Ti C Al Fe
96.8 0.801 0.253 0.250 0.001 0.002 0.383 0.021 96.8
B. EXPERIMENTAL SETUP
The experiments for testing are carried out on turning machine using various solid carbide cutting tool at different cutting machining parameter combination. Figure 2 shows the image of the samples (rod/round bars) to be tested.
ISSN:2455-3956, Volume-2, Issue-4, April 2016 Pages 16-21 Figure 2: image of the samples (rod/round bars) to be tested
C. CLEANING PROCEDURE
It is of the utmost significant before starting the experiments to clean the samples of any sur`face contaminations, such as dust, grease, or any other soluble organic particles so that there will be no adverse effect on the results. Prior to measurement, samples (rod bar) were cleaned ultrasonically in three five-minute steps using: (i) water with detergent to remove dust and oils; (ii) distilled water to remove detergent; (iii) methanol to remove the distilled water. After cleaning, all samples were stored for 24 hours in the same metrology laboratory that was used for testing, to allow them to
equilibrate with their environment (normally 20±1˚C and
40±5% relative humidity). The procedure that is described above was judge to be adequate at this stage of investigation.
D. TESTING PROCEDURE
The surface profile of all samples were quantitatively analyzed in order to determine the statistical standard parameter of average roughness, Ra, by using Taly-surf®
(from Taylor Hobson Precision, Inc.) which delivers 0.8 nm resolution over 12.5 mm seamless measuring range and includes 0.125 µm horizontal data spacing. A nominal 2 µm stylus was used with a normal load of 0.7 mN and selectable traverse speed down to 0.5 mm s-1 and which conforms to British Standards, see Figure 3. Surface roughness errors were calculated from the standard deviation of the absolute values of height deviation (absolute values). The traces were auto-leveled to a linear least-squares straight line and then filtered with a standard 0.8 mm cut-off. The surface parameters were selected according to the recommendations in the literature and also with respect to the data processing facilities available [8-12].
Figure 3: image of Taly-surf® and specimen Every test condition was repeated at least three times at
different ―new‖ locations on a rod bar surface in order to ensure the repeatability and reproducibility of the results.
The ―new‖ location was at least ±100 µm from the previous
on-flat‖ arrangement applying a linear sliding contact at
constant velocity over a specific distance. Tests were performed by using single scan mode (forwards motion). The profiler had a scan length of 10 mm, which is close to the size of a human fingertip.
E. CALIBRATION PROCEDURE
Standard calibration ball radius D = 22.0161 mm, 112/1844, Serial No. 639-506-B (from Taylor Hobson Precision, Ltd.) was used to calibrate the test-rig. For convenience, ten calibration trials have been carried out. This is adequate as these trials are predominantly about relative behavior; design interpretation to other systems is always vulnerable to variations in terms of materials and dimensions. Calibration showed the cantilever was a linear spring (R2 > 0.99), under operating and environmental conditions typical for this type of device, with absolute uncertainties of <1% of reading and realizable measurement resolution down to at worst 50 nm. Figure 4 shows the set-up of the standard calibration ball and the systematic diagram of the ball and a nominal 2 µm stylus with a normal load of 0.7 mN and selectable traverse speed down to 0.5 mm s-1. This method of calibration ensures that the gauge travels through (and therefore, is calibrated over) most of its range, see [13].
Figure 4: (a) image of standard calibration ball radius D = 22.0161 mm, 112/1844, Serial No. 639-506-B (b) ball with
nominal 2 µm stylus
IV. RESULTS AND DISCUSSION
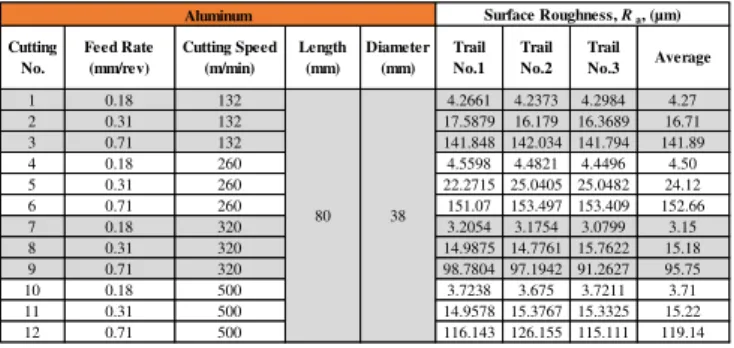
The measured values of surface roughness for the machined surfaces corresponding to all the experimental runs are given in Tables 4, 5 and 6.
Table 4: repeatability performance of Aluminum
1 0.18 132 4.2661 4.2373 4.2984 4.27 2 0.31 132 17.5879 16.179 16.3689 16.71 3 0.71 132 141.848 142.034 141.794 141.89 4 0.18 260 4.5598 4.4821 4.4496 4.50 5 0.31 260 22.2715 25.0405 25.0482 24.12 6 0.71 260 151.07 153.497 153.409 152.66 7 0.18 320 3.2054 3.1754 3.0799 3.15 8 0.31 320 14.9875 14.7761 15.7622 15.18 9 0.71 320 98.7804 97.1942 91.2627 95.75 10 0.18 500 3.7238 3.675 3.7211 3.71 11 0.31 500 14.9578 15.3767 15.3325 15.22 80 38 Surface Roughness, Ra, (µm) Average Trail No.3 Aluminum Feed Rate (mm/rev) Cutting Speed (m/min) Length (mm) Diameter (mm) Trail No.1 Trail No.2 Cutting No.
1 0.18 132 5.6294 5.3204 5.3383 5.43 2 0.31 132 22.4361 20.6543 22.4829 21.86 3 0.71 132 90.4682 90.1949 88.8665 89.84 4 0.18 260 5.8919 5.8646 5.7449 5.83 5 0.31 260 21.4614 22.6225 23.132 22.41 6 0.71 260 89.3569 89.8432 91.846 90.35 7 0.18 320 5.4822 5.4509 5.661 5.53 8 0.31 320 23.3578 23.5526 21.929 22.95 9 0.71 320 89.052 88.4315 86.244 87.91 10 0.18 500 4.4503 4.33263 4.2679 4.35 11 0.31 500 21.555 22.0424 20.7043 21.43 12 0.71 500 82.7338 81.7665 79.4545 81.32 Feed Rate (mm/rev) Cutting Speed (m/min) Length (mm)
Brass Surface Roughness, Ra, (µm)
Average 80 38 Diameter (mm) Trail No.1 Trail No.2 Trail No.3 Cutting No.
Table 6: repeatability performance of low carbon steel
1 0.18 132 6.6597 8.1768 8.1345 7.66 2 0.31 132 12.0783 12.4256 13.877 12.79 3 0.71 132 19.4475 18.3176 19.1891 18.98 4 0.18 260 5.2099 6.9874 7.1914 6.46 5 0.31 260 7.2849 7.9978 7.7982 7.69 6 0.71 260 18.6287 18.125 17.8566 18.20 7 0.18 320 2.868 3.4254 3.2185 3.17 8 0.31 320 4.3151 4.4497 3.977 4.25 9 0.71 320 19.0189 18.2117 18.7516 18.66 10 0.18 500 3.0107 3.2029 2.7492 2.99 11 0.31 500 3.3443 3.3228 3.1917 3.29 12 0.71 500 18.1182 18.7612 18.881 18.59 Carbon Steel Average Surface Roughness, Ra, (µm) 80 38 Trail No.3 Diameter (mm) Trail No.1 Trail No.2 Feed Rate (mm/rev) Cutting Speed (m/min) Length (mm) Cutting No.
A. Repeatability Performance of Aluminum
Figure 5 shows the Aluminum roughness prediction model with linear regression. The linear regression equation is given by:
Roughness, Ra = a × feed rate + b × speed + c
Where,
a = 242.5899, b = - 0.0309 and c = -37.9813 Figure 6 illustrates the neuro-fuzzy model of aluminum including the roughness, feed rate and speed. Figure 7 shows the repeatability performance of aluminum with different cutting speed and feed rate.
Figure 5: Aluminum roughness prediction model with linear regression
Figure 6: neuro-fuzzy model of aluminum
Figure 7: repeatability performance of Aluminum surface roughness
B. Repeatability Performance of Brass
Figure 8 shows the Brass roughness prediction model with linear regression. The linear regression equation is given by:
Roughness, Ra = a × feed rate + b × speed + c
Where,
a = 156.7675, b = - 0.00974 and c = -21.4877 Figure 9 illustrates the neuro-fuzzy model of Brass including the roughness, feed rate and speed. Figure 10 shows the repeatability performance of Brass with different cutting speed and feed rate.
ISSN:2455-3956, Volume-2, Issue-4, April 2016 Pages 16-21
Figure 8: Brass roughness prediction model with linear regression
Figure 9: neuro-fuzzy model of brass steel
Figure 10: repeatability performance of Brass surface roughness
C. Repeatability Performance of Carbon Steel
Figure 11 shows the Carbon Steel roughness prediction model with linear regression. The linear regression equation is given by:
Roughness, Ra = a × feed rate + b × speed + c
Where,
a = 26.36, b = - 0.01325 and c = 3.699
shows the repeatability performance of Carbon Steel with different cutting speed and feed rate.
Figure 11: Carbon Steel roughness prediction model with linear regression
Figure 12: neuro-fuzzy model of carbon steel
Figure 13: Carbon steel surface roughness
V. CONCLUSIONS
The effect of cutting speed and feed rate on the surface roughness shows that a low hardness material ductile material gives (Ra) more than the high hardness brittle materials at
high cutting speed, at the low feed rate. The experiment shows that the change of cutting speed (v) at different cutting feed gives the same relationship, in general. Indeed, at 0.18
results of experiments allow considering the establishing cutting condition on the quality of surface, and then obtain linear regression and neuro-fuzzy models to ensure the quality. The analysis of the effects of various parameters shows that the feed rate has significant effect in the reducing roughness and cutting speed have second effects in reducing the surface roughness, while the working materials has the least effect. The models generated, which includes the effect of cutting speed, feed rate, and working materials. Finally, the most important points are:
In general, the study shows that the cutting speed is by far the most dominant factor for surface roughness then the feed rate, while the working materials has less effect.
The effect of cutting condition on the quality has been established with the help of mathematical models, the optimal conditions to minimize the surface roughness has been determined.
ACKNOWLEDGMENTS
The authors would like deeply to thanks Saline Water Conversion Corporation, AL Shuaiba, KSA, for providing the raw materials with this work.
REFERENCES
[1] Puertas, I., Luis perez, C.J., Surface roughness prediction by factorial design of experiments in turning processes, Journal of Materials Processing Technology 143 –144, 2003.
[2] Cogun, C., Ozses, B., Effect of Machining Parameters on Surface Roughness In Cnc Machine Tools, Gazi Univ.Muh.Mim.Fak. Der. Vol. 17, No1, 59 – 7, 2002.
[3] Koelsch, J., Divining Edge Quality by Reading the Burrs, Quality Magazine, December, 24-28, 2001.
[4] Karayel, D., Prediction and control of surface roughness in CNC lathe using artificial neural network, Journal of Materials Processing Technology, 209: 3125–3137, 2008.
[5] Cetin, M. H., Ozcelik, B., Kuram, E., Simsek, B. T., Demirbes, E., Effect of Feed Rate on Surface Roughness And Cutting Force In The Turning of AISI 3041 Steel With Ep Added Vegetable Based Cutting Fluids, Selcuk University, II. National Machining Symposium, UTİS 2010, S:92-107, Konya, Turkey, 2010.
[6] J. R. Jang, ―ANFIS: Adaptive-network, based fuzzy inference system‖, IEEE transaction on Systems, Man and Cybernetics, 1993, vol. 23, no. 3, pp. 665-685.
[7] G. Bersini, C. Bontempi and Decaestecker ―Comparing RBF and fuzzy inference systems on theoretical and practical basis‖, in Fogelman-Soulie', P. Gallinari (Eds.), International Conference on Artificial Neural Networks, Paris, 1995, vol. 1, pp.169-174.
[8] Dong, W.P., P.J. Sullivan, and K.J. Stout, Comprehensive study of parameters for characterizing three-dimensional surface topography I: Some inherent properties of parameter variation. Wear, 1992. 159(2): p. 161-171.
[9] Dong, W.P., P.J. Sullivan, and K.J. Stout, Comprehensive study of parameters for characterizing three-dimensional surface topography II: Statistical properties of parameter variation. Wear, 1993. 167(1): p. 9-21.
[10] Dong, W.P., P.J. Sullivan, and K.J. Stout, Comprehensive study of parameters for characterising three- dimensional surface topography: III: Parameters for characterising amplitude and some functional properties. Wear, 1994. 178(1–2): p. 29-43.
[11] Dong, W.P., P.J. Sullivan, and K.J. Stout, Comprehensive study of parameters for characterising three-dimensional surface topography:
IV: Parameters for characterising spatial and hybrid properties. Wear, 1994. 178(1–2): p. 45-60.
[12] Thomas, T.R., Characterization of surface roughness. Precision Engineering, 1981. 3(2): p. 97-104.
[13] Alsoufi, M.S. and T.M. Bawazeer, The Effect of Aggressive Biological Materials on a Painted Automotive Body Surface Roughness. American Journal of Nano Research and Applications, 2015. 3(2): p. 17-26.