Integrated Computational System for Portable
Retinal Imaging
by
Jason Boggess
UBRA4RIES
Submitted to the Department of Electrical Engineering and Computer
Science
in partial fulfillment of the requirements for the degree of
Master of Science in Computer Science
at the
MASSACHUSETTS INSTITUTE OF TECHNOLOGY
June 2012
@
Massachusetts Institute of Technology 2012.
A uthor ...
All rights reserved.
Department of Electrical Engineerinp' /d Computer Science
n
Certified by ...
I ~-~-may 23, 2012 Ramesh RaskarAssociate Professor
Thesis Supervisor
-[1
Accepted by ...
Professo] Lese1.
Kolodziejski
Chair, Department Committee on Graduate Students
ARCHIES
(MASSACHUSETTS INSiiUYi
OF TECHNOLOGY
Integrated Computational System for Portable Retinal
Imaging
by
Jason Boggess
Submitted to the Department of Electrical Engineering and Computer Science on May 23, 2012, in partial fulfillment of the
requirements for the degree of Master of Science in Computer Science
Abstract
This thesis introduces a system to improve image quality obtained from a low-light
CMOS camera-specifically designed to image the surface of the retina. The retinal
tissue, as well as having various diseases of its own, is unique being the only inter-nal tissue in the human body that can be imaged non-invasively. This allows for diagnosis of diseases that are not limited to eye conditions, such as diabetes and hy-pertension. Current portable solutions for retinal imaging such as the Panoptic and indirect ophthalmoscopes require expensive, complex optics, and must be operated by a trained professional due to the challenging task of aligning the pupillary axis with the optical axis of the device. Our team has developed a simple hardware/software solution for inexpensive and portable retinal imaging that consists of an LED light source, CMOS camera, and simple LCD display built into a pair of sunglasses. This thesis presents a multistage solution that registers the retinal tissue on the sensor; identifies its shape and size; performs local integration with phase correlation; and performs global integration with panoramic mosaicing. Through this process we can increase signal to noise ratio, increase image contrast, create super-resolution images, and obtain a large field of view image of the retina. We also lay the groundwork for possible 3D reconstruction to increase the amount of information present. The main contributions of this thesis are in computational methods for improving overall image quality, while other team members focused on the illumination source, optics, or other hardware components.
Thesis Supervisor: Ramesh Raskar Title: Associate Professor
Acknowledgments
I would first and foremost like to thank my parents for all their love and support throughout the years. I never would have made it this far in life without their con-tinued help. My extended family from Iowa, Texas, and the surrounding areas have always been there for me with laughter, love, and comfort whenever I needed it. I really appreciate all the support and dedication to my success throughout the years.
I really admire my peers in the Camera Culture Group of the Media Lab. Doug
has always amazed me with his 3D skills, and Gordon is a charismatic leader and understanding individual. Otkrist has been a great friend and companion and always there to grab ice cream when you need him. Nikil has the craziest laugh, and while I may not have known Aydin or Kshitij for long I know they will be successful in all their future endeavors.
I could not have even begun this work without our team members. Everett
Law-son, Research Assistant, originally came up with the project years ago and never dreamed it could turn into what it is today. Other members Siddharth Khullar (Visiting PhD student from RIT), Alex Owal (Post-Doctoral fellow), Gordon Wet-zstein (Post-Doctoral fellow), and Ramesh Raskar (Advisor) have been instrumental in making this project a success.
Technical Contributions. This research is made possible through the MIT
Media Lab, and specifically the Camera Culture Group whose facilities and darkrooms were used extensively to capture data from the eyes. Ramesh Raskar was a key player in finding funding opportunities for the team.
Funding Acknowledgments. Funding was provided by the Media Lab
Corpo-rate sponsors and by the National Science Foundation for Jason Boggess's graduate fellowship. Prize money was also obtained through the CIMIT Primary Healthcare Prize and the Ideas Global Challenge for this research. Google provided us with a fundus camera which was instrumental in doing our research.
Thank you to all the family members who helped proofread this thesis and who will be attending my graduation ceremony.
Contents
1 Introduction
1.1 Research Team . . . . 1.2 Low-Light Imaging . . . . 1.2.1 Thesis Statement . . . . 1.2.2 Challenges in Computational Processing
1.2.3 Contributions . . . .
1.3 Background . . . .
1.3.1 The Human Eye . . . .
1.3.2 Need for Retinal Imaging . . . .
1.4 Scope and Limitations . . . . 2 Retinal Imaging
2.1 Challenges in Retinal Imaging . . . . 2.2 Current Imaging Solutions . . . . 2.2.1 Handheld Ophthalmoscopy . . . . 2.2.2 Fundus Imagery . . . .
2.2.3 Scanning Laser Ophthalmoscopy and 0
mography . . . .
2.3 Our Solution . . . .
2.4 Related Image Processing Work . . . . 2.4.1 Retinal Imaging and Light Transport . . 2.4.2 Low-light Imaging and Integration . . .
2.4.3 Retinal Mosaicing . . . . ptical Coherence 19 . . . . 19 . . . . 20 . . . . 20 . . . . 20 . . . . 22 . . . . 22 . . . . 22 . . . . 25 . . . . 27 31 To-31 33 33 34 37 37 42 42 43 43
3 Algorithms and Methodology 3.1 Processing Overview ...
3.1.1 Overview of Limitations of Captured Data . . . .
3.1.2 Processing Outline . . . .
3.2 Image Registration & Correction . . . .
3.2.1 Frequency Recognition . . . .
3.2.2 Shape and Color Recognition .. . . . .
3.2.3 Vignetting Removal . . . .
3.3 Frame Correlation with Online Clustering . . . .
3.3.1 Phase Correlation . . . .
3.3.2 Online Clustering and Correlation . . . .
3.3.3 Local Image Integration, Upscaling, and Blending
3.4 Global Panoramic Stitching and Mosaicing . . . .
4 Validation and Results
4.1 Hardware Capture Systems . . . .
4.1.1 Our Capture System . . . . 4.1.2 Resolution Analysis . . . . 4.2 Validation . . . . 4.2.1 Software Overview . . . . 4.2.2 Vignetting Falloff Calculations . . . . 4.2.3 Image Integration Verification . . . . 4.2.4 Frame Alignment Verification . . . . 4.3 R esults . . . .
5 Future Research and Conclusions 5.1 Future Research . . . .
5.1.1 Light Field Capture. . .
5.1.2 Hyperspectral Imaging . 5.1.3 Multidirectional Capture 5.1.4 Platform integration . . . 45 . . . . 45 . . . . 45 . . . . 46 . . . . 48 . . . . 48 . . . . 52 . . . . 55 . . . . 59 . . . . 59 . . . . 62 . . . . 69 . . . . 75 79 . . . . 79 . . . . 79 . . . . 80 . . . . 82 . . . . 82 . . . . 82 . . . . 84 . . . . 88 . . . . 95 99 . . . . 99 . . . . 99 . . . . 99 . . . . 100 . . . . 101
5.1.5 Video Overlay . . . . 101 5.2 Awards and Funding Sources. . . . . 102
5.3 Conclusion . . . . 102
A Figures 105
A.1 Examples of Raw Data . . . . 105
A.2 Examples of Data after Integration and De-Vignetting . . . . 110
List of Figures
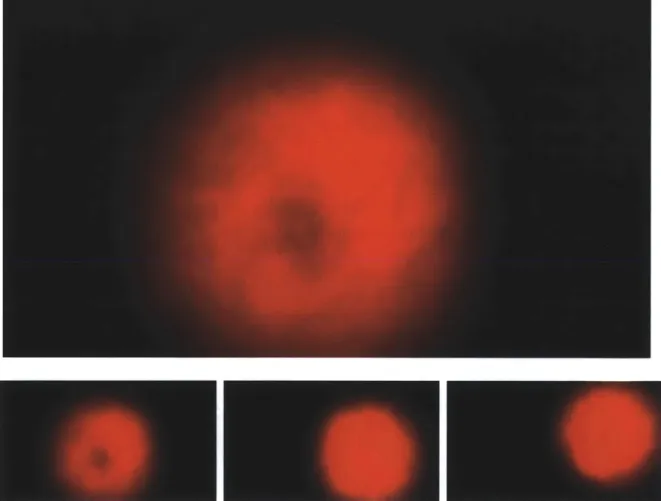
1-1 Raw data as obtained from our camera system. . . . . 21 1-2 The Human Eye. Notice that the light must pass through the pupil
into the vitreous humor and finally diverge into the retina. 1. posterior compartment - 2. ora serrata - 3. ciliary muscle - 4. ciliary zonules - 5.
canal of Schlemm - 6. pupil - 7. anterior chamber -8. cornea - 9. iris
-10. lens cortex - 11. lens nucleus - 12. ciliary process - 13. conjuntiva
- 14. inferior oblique muscule - 15. inferior rectus muscule - 16. medial
rectus muscle - 17. retinal arteries and veins - 18. optic disc - 19. dura
mater - 20. central retinal artery - 21. central retinal vein - 22. optical
nerve - 23. vorticose vein - 24. bulbar sheat - 25. macula - 26. fovea
-27. sclera - 28. choroid - 29. superior rectus muscule - 30. retina . . . 23
1-3 Causes of blindness in the world as of the year 2002. Notice that AMD,
Glaucoma, and Diabetic Retinopathy can all be diagnosed through retinal im ages . . . . 25
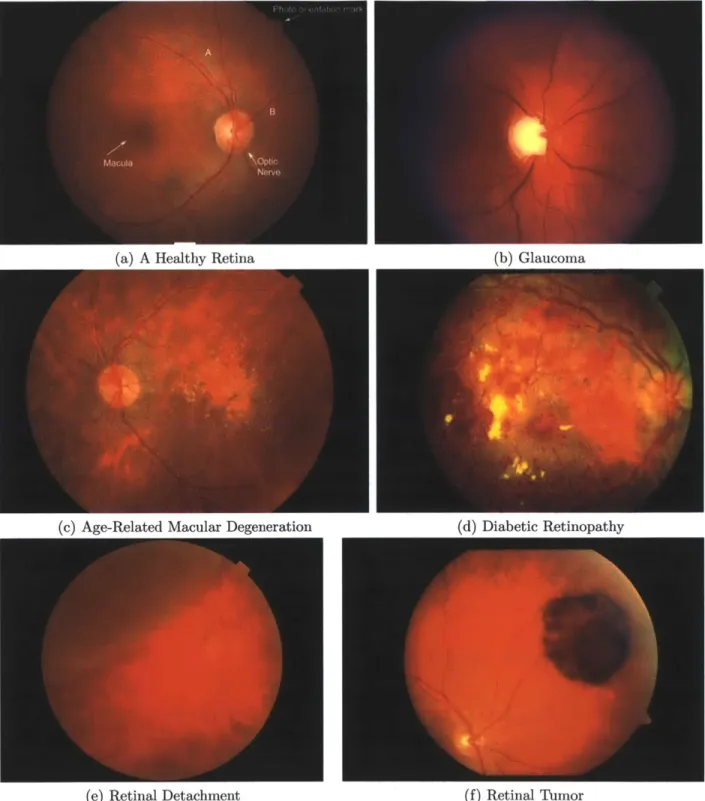
1-4 Comparison of the various Retinal Diseases. These images were cap-tured using a standard fundus camera . . . . 28
2-1 (a) A direct ophthalmoscope with the iPhone 4 attached to a Panoptic with a red plastic called the iExaminer. (b) A worn example of an
indi-rect ophthalmoscope (Courtesy of the Pacific Airforce, http://www.pacaf.af.mil/) 35 2-2 An image captured through the Panoptic, a direct ophthalmoscope . 35
2-3 A fundus camera photographs the retina using complex optics and a
standard SLR camera. These devices are easier to align than handheld
devices and do not require mydriatic drops to operate. . . . . 36
2-4 Scanning Laser Ophthalmoscopes (SLO). . . . . 38
2-5 We have developed a simple solution that trades complex optics for computation in order to take low quality images and extract the most data from them . . . . 39
2-6 Our glasses consist of an LED light source and inexpensive CMOS camera 39 2-7 An LCD display allows the user to control one eye with the other to obtain a large field of view of the retina. Images captured can be digitally processed to greatly enhance the quality. . . . . 40
2-8 A comparison of various retinal imaging devices. . . . . 40
3-1 Flowchart of the image processing system. . . . . 47
3-2 Image Registration & Correction . . . . 48
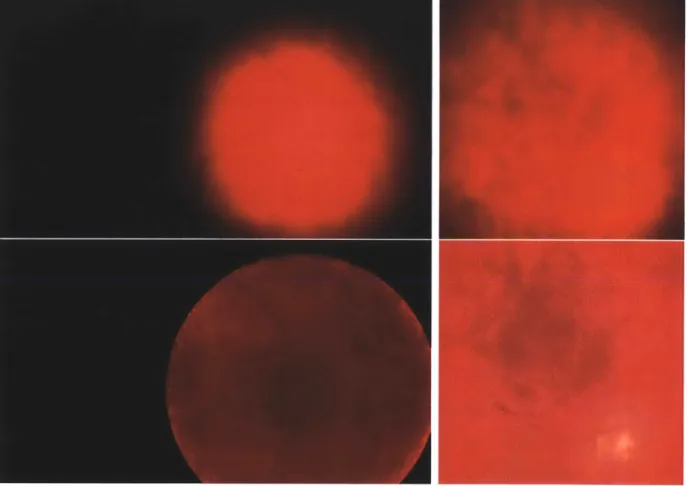
3-3 a) Often times only the retina appears on the sensor as a red spher-ical shape on a black background. The areas of interest are easy to detect with a simple thresholding operation. b) Occasionally there are other image artifacts such as corneal reflections or c) light leakage from around the iris that make retinal tissue registration in the image more challenging. For the latter two conditions, a frequency detection algorithm must be used. . . . . 49
3-4 The resulting frequency response for the blue, green, and red color channels respectively of a retinal image. Notice that even though noise is apparent, the retinal tissue stands out against the black background 50 3-5 a) When the color channels are averaged and then low-pass filtered, we get the above filtered response. Notice that the area of the image we are interested in stands out against the dark background. b) the same image, but with a threshold response. Notice again that the computer can clearly identify which parts are retina and which are not. .... 51
3-6 We can isolate the red channel and take a threshold to identify the area
of interest in the image. Note, this only works for red circular regions on a black background, but the region appears extremely circular. . . 53
3-7 Finding the retinal region. Left column: Frequency filtered selection.
Right Column: Retinal selection by shape and color. In both methods, a binary image is created to show where the retina is most likely to be. 54
3-8 Two examples of retinal vignetting correction. The top images show
the original image before vignetting correction and the bottom images show the change after the image has been corrected. Observe that the edges of the cropped image are no longer dark around the edges, and more detail becomes apparent. . . . . 56 3-9 Results of high-pass-filtered data. (a) Original image as captured by
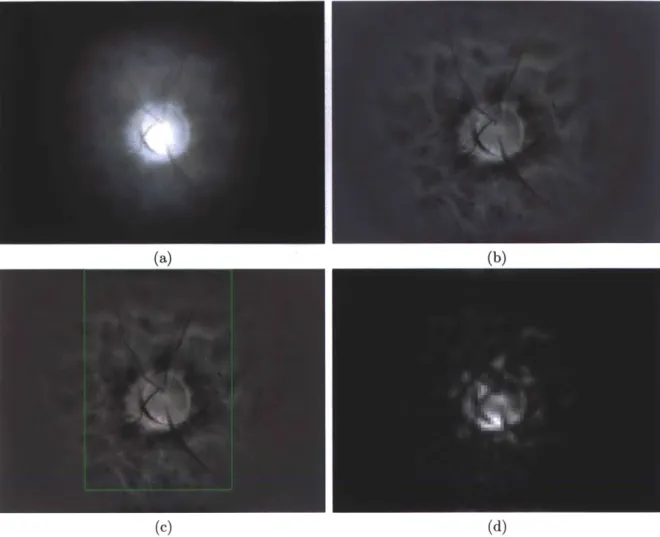
our PointGrey Flea 3.0 camera. (b) The flattened image obtained by taking a wide-band high-pass filter to (a). (c) The region of interest marked based on the highest concentration of frequencies. (d) The fre-quency mask created by low-pass filtering the image in (b). Vignetting effect is diminished but not removed. . . . . 57
3-10 Frame Correlation with Online Clustering . . . . 59
3-11 Phase correlation response graph between two flattened retinal images.
The highest response, large white area, is located to the north-east of center, which is indicated by a single white pixel . . . . 61 3-12 Pair-wise correlation for 200 items (40,000 correlations). Peaks indicate
good correlation while troughs indicate bad correlation. The main diagonal has been removed to better illustrate contrast between similar, but not equal, elements. A normalized matched response of an image with itself always has a magnitude of 1 at location (0, 0). . . . . 63 3-13 Peak Concentration. The same correlations as shown in Figure 3-12,
except shown from the side with the main diagonal down the center. Most of the high correlations occur near the center of the graph and correlations decrease as images become farther apart in time. . . . . . 64
3-14 Correlations of the same dataset with different image resolutions. While the scale is different in each image, the correlations still have the same relative heights. This means we can down-sample the images before
performing a phase correlation to significantly speed up processing time. 65
3-15 As a frame is added to the set, it is correlated with the other elements
from the other sets. If it is well-correlated to all elements of a set, it is added as a member. If not, then the last group to be updated is evicted and the new frame is added as a singleton group. . . . . 67
3-16 Image Integration, Upscaling, and Blending . . . . 69
3-17 Creating a blending mask. The frequency band response calculated in
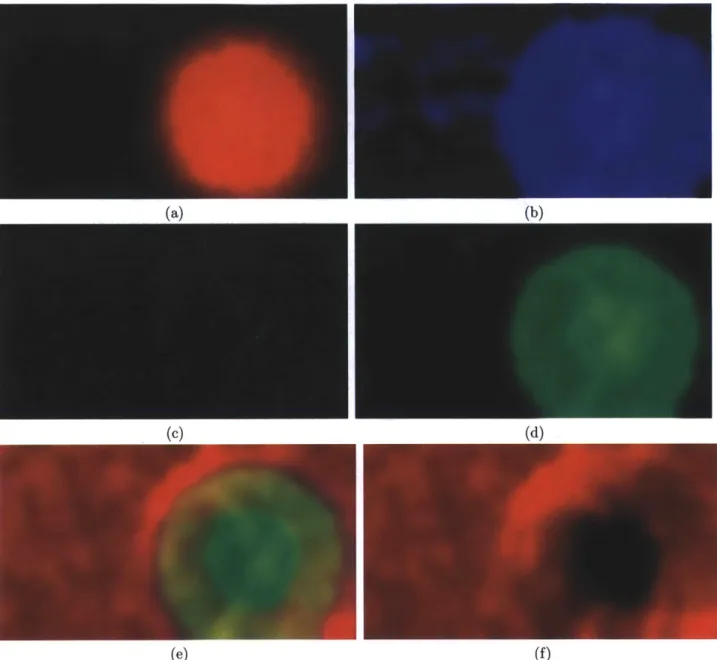
the first step of the imaging process is used to merge the images. a) the original image. b) The combined filter response for all color channels. c) Low-pass filtered to bring out high contrast areas. d-f) The blue, green, and red color channels respectively. Notice that the red color channel in the bottom right is black in the center. This is because the red light is flushed and the area contains no data. This is another reason why red channels were zeroed in many of our captured images. 71 3-18 Results of image local integration. Notice the amount of detail that
appears in (b), including micro vascular structures that were not ap-parent in a single individual frame (a). . . . . 72
3-19 Results of image local integration with PointGrey Flea 3.0 Camera.
Notice the amount of detail that appears in (b), including pigments that were not apparent in a single individual frame (a). This integra-tion only took seven frames. . . . . 73 3-20 Examples of images after they have been integrated together. Red
borders appear due to rounding errors at the edges of masks. . . . . . 74
3-21 Global Panoramic Stitching and Mosaicing . . . . 75
3-22 A panorama stitched automatically without user input by this imaging
process . . . . 75
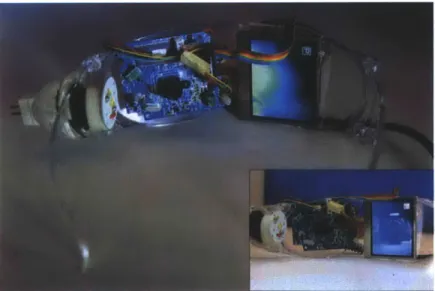
3-24 Image processing pipeline with representative sample images. . . . . . 7 4-1 We present two prototypes for our imaging system. Both prototypes
are based on glasses-mounted design for different methods of stimulus presentation: (a) A display fixed within the glasses, thus providing high portability. (b) View of an external display from the other eye for stimulus control. This particular prototype has the ability to involve another observer if required as is the case for clinical and research settings. . . . . 80
4-2 Resolution analysis using a quadratic exponential (chirp) 2-D pattern.
(1) Original, (2) Fundus Camera, (3) Ours, (4) Panoptic. . . . . 81
4-3 The phase correlation response. Light points indicate translation. (a) The peak correlation appears in the red circle, even though there is a cluster of high intensity in the green circle. (b) After low-pass filter, a blur, has been applied to an image we can clearly see that the response we are looking for is in the green circle. Since the circle is right in the center of our image, it corresponds to a (0, 0) translation. . . . . 83
4-4 Here the vignetting is readily apparent. Changes in lens magnification cause the edges of the retinal image to go dark. Since his image has fairly smooth color throughout its entirety, we can use it to figure out the vignetting falloff. . . . . 84 4-5 The brightness profile of the red channel of a typical image captured by
our hardware. In this image, the vignetting pattern is extraordinarily apparent, with the 3-D shape relatively rotationally symmetrical about its center. . . . . 85
4-6 A linear slice of the retina stretched for emphasis. . . . . 86
4-7 A plot of the cross-section of the retina (blue), and a cosine fit to the
profile (red dash). We can observe that this is almost a perfect match. 86
4-8 Comparison between resolutions of images before and after image inte-gration. Relative pixel sizes are denoted with squares. The amount of detail in (b) is much greater than in image (a) at the same magnification 87
4-9 Noise removal due to image integration. The red channel has been
removed to greater illustrate the effect of integration. . . . . 89
4-10 Noise removal due to image blending compared to the ground truth. The left column contains integrated images without the red channel after one frame, three frames, and five frames fused together. The right column shows the noise profile of each one of the images with respect to the ground truth. After about five images are integrated together the noise profile is almost zero. . . . . 90
4-11 Motion over small distances on the retina is fairly linear. (a) The rigid nature of our device, greatly constrains the degrees of freedom in our system. Instead of having six degrees of freedom (three rotation, three translation), we only have two degrees of translation as the eye moves around, up and down, left and right, behind the camera. (b) Markers show the tracking of features on the surface of the retina as the eye moves around. The distance between these markers stays constant indicating the relative magnification of observed features is nearly constant. . . . .. 91
4-12 An example feature matching between two adjacent frames. Matching points are connected with lines. Since we are assuming all of our motion is translational, all lines should be parallel. Images with high noise are relatively feature-less, which results in low feature detection. . . . . . 92
4-13 Translation #1 of ten neighboring frames . . . . 93
4-14 Translation #2 of ten neighboring frames . . . . 93
4-15 Translation #3 of ten neighboring frames . . . . 94
4-16 Panorama mapped to a sphere and labeled in terms of features and field of view . . . . 96
4-17 Examples of stitched images. The top image was created automatically
by the free Hugin program downloadable from http://hugin.sourceforge.net/.
The bottom image was created in our integrated system using C++ and the OpenCV libraries. The Hugin stitcher yields an image that is more visually pleasing, but with lower fidelity and contrast. . . . . 97
4-18 Large field of view Panorama created by combining 80 images from a PointGrey Flea 3.0 Camera. . . . . 98 5-1 This is example of multidirectional lighting. Two LEDs placed closely
to the eye on opposite sides are modulated so that only one LED is on at a time. By observing shadows in images we can get some depth information about the retinal tissue . . . . 100
A-1 Raw data from dataset 10, captured with a standard HD webcam. . . 106
A-2 Raw data from dataset 10, continued . . . . 107
A-3 Examples of raw data from a diverse set. . . . . 108
A-4 Raw data from the PointGrey Flea 3.0 camera. . . . . 109
A-5 Flattened images without integration. . . . . l11
A-6 Flattened images without integration and without cropping. . . . . . 112
A-7 Integrated images from the PointGrey Flea 3.0 camera. . . . . 113
A-8 Our first panorama, created by hand. . . . . 114
A-9 Our second panorama, created by hand and rendered in 3D Studio Max. 115
A-10 First automatically stitch panorama. Created with Hugin . . . . 116
A-11 Central region of data automatically stitched together from image
in-tegrated together from a PointGrey Flea 3.0 camera. . . . . 117
Chapter 1
Introduction
1.1
Research Team
The team of researchers were instrumental in making this research project a success. Everett Lawson was a key player who motivated the team, thought about illumination challenges, subjected himself to many experiments and focused primarily on building hardware, buying cameras, lighting to develop prototypes, and wiring LEDs. Di Wu also helped significantly in her background research, designing computer algorithms for multimodal capture, and preparing hardware for data capture. Jennifer Wang, an undergrad we worked with for several weeks, aided the team doing validation on retina motion. Ramesh Raskar, our advisor initiated the project and contributed heavily to the direction of the project.
Siddharth Khullar, Alex Olwal, and Gordon Wetzstein were great members of the group helping us write and publish papers, and we could not have done it without the clinicians in the Boston area such as Caio Regatieri and Paolo Antonio Silva. Our clinicians were instrumental in our understanding of retinal diseases, their detection, and the validation of our hardware.
Ramesh Raskar joined the Media Lab from Mitsubishi Electric Research Lab-oratories in 2008 as head of the Media Lab's Camera Culture research group. His research interests span the fields of computational light transport, computational pho-tography, inverse problems in imaging and human-computer interaction. He was a
head researcher on NETRA, refractive error assessment on a cellphone, and CATRA, cataract assessment on a cellphone, and continues to lead research in eyecare devel-opment in retinal image at the MIT Media Lab.
Vitor Pamplona was also a key member of the team, designing NETRA and CATRA, and laying the foundation for the retinal imaging work.
Some of the text in this thesis, especially in the related work section, was used in a recent paper submission and underwent editing by other members of the team.
1.2
Low-Light Imaging
1.2.1
Thesis Statement
I present a computational system designed to take images captured in very low lighting conditions, extract the most meaningful data from these images, and assemble them back together in a meaningful way. By using some re-cent developments in image translation identification, I am able to provide a comprehensive, robust, computational system that recursively integrates im-ages to increase the signal-to-noise ratio in the data. My multistep process is able to take a database of images and autonomously reconstruct them into a panorama without user input.
1.2.2
Challenges in Computational Processing
While the enhancement of retinal images may seem straightforward, photographs captured from our system are unique when compared to natural images. As the eye moves, only a narrow window of the retina is seen through the pupil on the image. This requires registration and identification. Moreover lens distortions such
as vingetting and normal aberrations cause the edges of the data area to become dark and distorted. Traditional computational photography systems rely on feature matching to detect motion between video frames, for the creation of fused image stacks, super-resolution, and panoramic stitching. However, under our low signal-to-noise ratio feature matching is not able to accurately detect features, and thus
reconstruction is impossible with this technique (See Figure 1-1).
1.2.3
Contributions
Specifically for this thesis I will concentrate on the following issues.
" Registration and recognition of the retina in a captured image, including the
position and size of the retinal tissue on the sensor.
* Correction for lens falloff and distortion, due to vignetting and other optical interference.
" Time multiplexing and integration of frames to reduce noise and lens distortions. " Production of super-resolution images from their low-resolution counterparts. " Panoramic stitching to produce a large field of view from several smaller field
of view images.
" Integration on mobile platforms to capture data portably and efficiently. " Framework for three-dimensional representations of the retina using multiple
lighting techniques.
1.3
Background
1.3.1
The Human Eye
The human eye is one of the most dynamic and important features of the human body. Giving us our strongest sense, the eye gives meaning to our environment and helps us develop spacial reasoning. Without our eyes, we would have never discovered outer space, or climbed Mount Everest, or seen the Grand Canyon. There are many tasks that require eyes to perform such as driving a car, that would be nearly impossible to do without sight.
30 29 28 27 26 .25 5 6. 71 13 1 14
Figure 1-2: The Human Eye. Notice that the light must pass through the pupil into the vitreous humor and finally diverge into the retina. 1. posterior compartment - 2. ora serrata - 3. ciliary muscle - 4. ciliary zonules - 5. canal of Schlemm - 6. pupil - 7.
anterior chamber - 8. cornea - 9. iris - 10. lens cortex - 11. lens nucleus - 12. ciliary process - 13. conjuntiva - 14. inferior oblique muscule - 15. inferior rectus muscule
-16. medial rectus muscle - 17. retinal arteries and veins - 18. optic disc - 19. dura
mater - 20. central retinal artery - 21. central retinal vein - 22. optical nerve - 23.
vorticose vein - 24. bulbar sheat - 25. macula - 26. fovea - 27. sclera - 28. choroid
The human eye is a one inch diameter sphere contained in a tough, white shell called the sclera. Light from the environment strikes the cornea at the front-most part of the eye, transfers through the pupil, enters the internal portion of the eye called the vitreous cavity, and is then focused through the lens of the eye onto the retina, a photosensitive tissue [29].
Like the aperture of a camera, the iris opens and closes to adjust the amount of light that enters the eye through the pupil. This function is aided by the use of ganglian cells which respond to the levels of incident light on the eye. The reaction time of the ganglian cells is critical in keeping the retinal tissue from absorbing too much light, a condition known as phototoxicity [29].
The center of the eye is filled with a dense, clear, viscous fluid called the vitreous humor which also contributes to the reflective nature of the light entering the human eye. The average focal length of the eye is between 17 and 24 mm, and most scientific models describe the eye as a perfect sphere. If the eye is too short or too long the lens has trouble focusing the image on the back of the retina, causing what is known as refractive error. Refractive error can be easily corrected with the aid of eyeglasses. The retina is a complex tissue lining the back of the eye. The retina transfers the incoming light through photoreceptors to the optic nerve which then carries the signal to the lower rear of the brain for processing. Blood vessels and nerves appear on the exterior surface of the retina and vitreous humor. The vessels concentrate to a single bundle at place called the optic disc which is the brightest part of the retina appearing as a white circle in most retinal images.
The center of focus of the human eye is called the fovea [19]. The fovea is the darkest spot appearing almost as a dent on the surface of the retina. Surrounding the fovea is an area called the macula which spans between the optic disc and two large arteries on either side of the fovea. Most retinal diseases manifest themselves in the macula or in the area around the optic disc.
The retina makes use of photoreceptor cells to transmit incoming light into a signal that can be processed in the brain. There are two types of these photoreceptor cells called rods and cones corresponding to the shape of the photoreceptor. Rods
Otes, 13.0% Onchocerclasis, 0.8% Trachoma, 3.6% Childhood Blindness, 3.9% Corneal Opacities, Cataract, 47.8% Diabetic Retinopathy_ Age-Related Macular Degeneration, 8.7% Glaucoma, 12.3%
Figure 1-3: Causes of blindness in the world as of the year 2002. Notice that AMD, Glaucoma, and Diabetic Retinopathy can all be diagnosed through retinal images
are long and skinny and are most receptive to dim light. The signal transmitted from rods is interpreted in the brain as black-and-white vision. While there are many rods in the center region of vision and in the macula, there are more rods than cones in the peripheral areas of vision.
There are three different types of cones that respond to three different wavelengths of light. Mostly concentrated in the center of the macula, cones transmit red, green, and blue light information to the brain to be processed. Beyond the retina is the choroid layer which is a muscle group responsible for positioning and moving the eye. In some of our captured images, the choroid can be seen through thin retinal tissue.
1.3.2
Need for Retinal Imaging
In 2010, the World Health Organization(WHO) estimated that 40 million of the 6.7 billion people the world were completely blind and another 264 million of them had low vision [30]. Out of these nearly 300 million people, those who are 50 years old or older have an 82% chance of being blind. Most visual impairment comes from the lack of eyeglasses, something which the Camera Culture Group of the MIT Media Lab addressed in 2009 with their cellphone attachment NETRA [31]. The next major cause of visual impairment according to the WHO is untreated cataracts
which accounts for 33% of the visual impairment cases. The Camera Culture Group and the Media Lab also had a device to measure cataracts on a cell phone, called CATRA, which presents users with a picture of the cataract map of their lens [33]. The primary cause of all blindness globally is cataracts (See Figure 1-3).
Cataracts and uncorrected refractive error are not the only causes of vision loss. The next three major causes of blindness are glaucoma, age-related macular degenera-tion, and diabetic retinopathy [27]. According to the University of Nebraska Medical Center, Department of Ophthalmology and Visual Sciences, every 5 seconds someone in the world loses the ability to see forever. However, 80% of blindness-causing dis-eases are preventable and/or can be cured to near 100% vision restoration [30, 27]. The number of blind people worldwide is expected to double by the year 2020 [30].
Blindness is not distributed equally throughout the world with more than 90% of the world's visually impaired living in developing countries [30]. Southeast Asia (20%) and Western Pacific (26%) have the highest incidence of avoidable blindness, followed by Africa (17%), Eastern Mediterranean (10%), and America (10%).
Vision 2020 is a group that is dedicated to ending preventable blindness by the year 2020. They estimate that the limitations to eye care largely revolve around the lack of a cost-effective programs for screening and detection of diseases such as
diabetic retinopathy [28]. While the prevalence of cataracts can be assessed using portable light field displays [31, 33], other diseases such as glaucoma, age-related macular degeneration, and diabetic retinopathy, require fundus images, or images of the central retina, to detect. Many imaging solutions (discussed in the next section) exist to adequately image the retina, but they are too large, expensive, and bulky to meet the needs of the developing world.
Dr. Caio Regatieri and friend of the MIT Media Lab is a leading researcher and ophthalmologist in the Boston area with specific expertise in retinal diseases. As a Brazil native, he is actively associated with eye screening programs and organizations in his home country. In a recent interview, he mentioned there are very few fundus cameras (one of which he owns) for the entire country of Brazil- 200 million people. Age-related macular degeneration (AMD) is the leading cause of blindness in
de-veloping countries, and in industrialized countries causes half of all blindness. It results in a progressive loss of central vision and is detected by visualizing the retina. As advancements and access to health services lead to increases in average life ex-pectancies around the world, we will observe a global rise in the elderly population, making AMD a greater problem for both the developed and developing world. A major WHO strategy for preventing blindness due to AMD is to increase diagnosis and referral for treatment.
Diabetic Retinopathy is the leading cause of blindness in American adults and disproportionately affects ethnic minorities. The WHO notes that "treatment of established retinopathy can reduce the risk of visual loss by more than 90%". As per Center for Disease Control (CDC) - "50% of 25.8 million diabetics are not getting
their eyes examined or are diagnosed too late for treatment to be effective in the
U.S." Many do not have access to screening with the U.S. alone facing a shortage of 6,000 ophthalmologists by 2020.
Other diseases affect the retinal surface that are not solely eye conditions. Hyper-tension (high blood pressure) and diabetes can sometimes appear in the eye months and possibly years before they show up in blood tests. Recently, it has been revealed that retinal imaging may even detect brain tumors and high cholesterol [15]. As retinal imaging technology becomes more available and common, even more diseases may be found to manifest themselves in retinal tissue (See Figure 1-4).
1.4
Scope and Limitations
While we aim to provide retinal screenings and health care to people in the world in many different places, this work is just the beginning of a long line of retinal imaging publications. Our team goals are as follows:
* Develop a computational system to significantly reduce the need for fundus cameras.
de-(a) A Healthy Retina
(e) Ave-Related Macular Degeneration (d) Diabetic Retinopathy
(e) Retinal Detachment (f) Retinal Tumor
Figure 1-4: Comparison of the various Retinal Diseases. These images were captured using a standard fundus camera
vices) to increase portability across different venues of clinical scenarios.
" Enable individuals to operate the system without the need for a trained
profes-sional.
" Integrate imaging with systematic disease detection/prevention capabilities through
computational algorithms and system integration (with hospital databases). Such an imaging solution will facilitate early detection of diabetes, hypertension, and specific brain abnormalities that manifest themselves first in the retina.
Limitations
" The computational system presented in this thesis while robust may not
incor-porate all data captured or result in an optimum use of the available data. The online algorithm makes use of a clustering heuristic to speed up processing and
may miss frames interspersed between noisy data.
" Ideal processing will be real-time, but this system currently does not operate
at the rate of capture. Future optimization and hardware improvements could make this a possibility.
" Certain restrictions to the position and scale are exercised in order to increase
precision with low feature images. Specifically, the phase correlation of the im-age processing assumes imim-ages have been translated, but not rotated or scaled. Image quality, resolution, noise and fixed depth of field are limitations of the
CMOS sensor used in our system, which currently allows us to resolve structures
down to 45pm. There is a trade-off between the field of view and the camera's proximity to the eye. Fundus cameras achieve high magnification and large field of view in a single photograph without proximity constraints [11].
Chapter 2
Retinal Imaging
Some of the text and figures in this section were developed as part of a team effort for a paper submission.
2.1
Challenges in Retinal Imaging
Current Methods Our Method
Direct, Xenon Bulb / Light Tubes Indirect, Light Emitting Diode External Hardware, Expert Clinician Interaction via Binocular Coupling
Complex Optics Image Mosaicing Complex Optics Small Aperture Camera Strobe Lighting / Short Exposure
Table 2.1: Computer graphics can exploit modern e.g. for retinal imaging.
Lucky Imaging
technologies to simplify devices,
While retinal imaging has emerged as one of the most powerful and rapidly devel-oping ways to detect both eye-specific diseases and other bodily ailments, the barrier to retinal imaging is still high. The main challenges in obtaining a good retinal image are as follows.
Lighting. The retinal tissue is designed to absorb light and is enclosed within
the sclera tissue, making it difficult to image. Traditional devices use bright xenon bulb flashes through the pupil to sufficiently illuminate the retina. In order to take an adequate photograph of the internal eye, we must illuminate the retina effectively
Lighting Alignment Large FOV Focus Blur Motion Blur
and efficiently. With reduction in cost of ultrabright LEDs and portable light sources, we hope our indirect illumination approach will inspire other illumination techniques for existing devices.
Alignment. In order to accurately capture an image of the retina, light from the
eye must travel linearly through the pupil and down the optical axis of an imaging device before it can be observed by the clinician. Aligning two lines in three-space so they are coincident is a very difficult task, even for a trained professional. Com-mercial fundus photography requires non-trivial alignment, presence of an operator, and a controlled environment, such as a clinic or hospital. Coupled illumination and stimulus control, as discussed later in this work, can overcome alignment challenges.
Field of View. While most current retinal imaging systems can function without
the aid of mydriatic (dilation) eye-drops, there still exists a trade-off between field of view, and period of discomfort for the subject. The pupil is a narrow opening into the eye roughly about 4 mm in diameter, and CMOS camera sensors from digital SLRs are in the range of 20 to 30 mm in diameter. Therefore, only a small portion of the camera sensor will contain images of retinal tissue, unless complex relay optics are added to magnify the image of the retina before it hits the camera sensor. The handheld ophthalmoscope can image about a 10-15' field of view. The tabletop fundus cameras and scanning laser ophthalmoscopes can achieve about a 300 field of view in one photograph. However, both of these techniques rely on complex optics. Our system uses mosaicing to post-process the images and achieve a larger field of view. We ensure smooth, wide coverage using binocular coupling.
Focus Blur. The lenses in the human eye and camera must be focused in
con-junction for sharp images of the retina. Traditional setups use complex alignment techniques, while our approach makes use of a small aperture and large depth of field.
Motion Blur. Long exposure times in retinal imaging yield photographs with
motion blur, and short exposure times yield high signal-to-noise ratio. Traditional methods use short exposures and bright lights, but our methods compensate for mo-tion blur by using the "Lucky" imaging approach, taking many images and selecting
only the best [23].
2.2
Current Imaging Solutions
There are three main types retinal imaging solutions doctors utilize in making retinal diagnostics: 1) Handheld Ophthalmoscopes (direct and indirect), 2) Fundus cameras, and 3) Laser rasterizing systems such as Scanning Laser Ophthalmoscopes (SLO) and Optical Coherence Technology (OCT).
2.2.1
Handheld Ophthalmoscopy
The smallest and most inexpensive group of ophthalmoscopes were invented by Charles Babbage in 1847 [39, 21]. These devices rely solely on optics to obtain an adequate view of the retina, similar to a telescope for the eye. These devices do not allow for image capture or postprocessing. The image produced by a direct ophthalmoscope is virtual and direct, but the examination must take place as close to a person's eyes as possible to increase the field of view.
The indirect ophthalmoscope [18] requires a condensing lens which is normally in the range of about 50 diopters. Attending physicians will wear a headmounted optical set up and hold the condensing lens at arm's length in front of the patient's face. Since the image focused from the condensing lens is projected out into real space, the entirety of the retina can be seen by both eyes simultaneously. This allows for stereopsis, or the ability to see 3-D structures on the retina. This feature is not present in direct ophthalmoscopy, which only can result in a 2-D image.
The most common, handheld device used by doctors today in developing regions of the world is an indirect ophthalmoscope because it offers the clearest picture to the attending physician. While both direct and indirect ophthalmoscopes operate on refractive principles, indirect ophthalmoscopy can only see up to the Ora serrata (one third of the way around the eye) while direct ophthalmoscopy can see slightly beyond the equator (halfway around the eye).
pupil to the rear of the eye where it is reflected back towards the ophthalmoscope. However, bright light shone in the human eye causes the iris to constrict around the pupil limiting the field of view seen by the doctor. This can be mitigated with mydriatic, dilating, drops that cause the iris to relax and the pupil to dilate. Dilation allows for a larger field of view, but reduces vision in the patient for several hours following the examination.
For most of these devices, there is no direct way to capture an image and there-fore doctors are required to be present for the examination. Recently there have been developments of many attachments that can be affixed to the end of a direct ophthalmoloscope to record such an image. The iExaminer
[1]
is an iPhone mount that allows the iPhone camera to take a picture through the direct ophthalmoloscope. While you are able to record many pictures on your iPhone using the iExaminer, only a small field of view is captured without the aid of mydriatic drops. Such pictures are almost useless in diagnosing diseases. (Figure 2-2)The cost of these devices is large despite their small size. A direct ophthalmo-scope itself costs around $500. In indirect ophthalmoscopy, the condensing lens alone costs around $500. A binocular helmet used in conjunction with the indirect ophthal-moscopy can cost $1000-$3000. The iExaminer attachment for the iPhone costs $150 in addition to the direct ophthalmoscope for a total cost of over $600 (see Figure 2-1).
2.2.2
Fundus Imagery
A fundus camera is based on the principle of monocular indirect ophthalmoscopy,
but allows the retinal image to be captured on a conventional SLR camera [20] or smaller CMOS camera [14], as opposed being seen by a doctor directly. The biggest advantage over handheld ophthalmoscopes is being able to image the eye without mydriatic drops and still obtain a large field of view image of the retina. This is achieved with a combination of rigid alignment procedures, relay optics, and quick flash illumination that does not cause the eye to constrict until after the photo has been taken. Most fundus cameras have robust alignment mounts with chin and forehead rests ensuring the patient stays in place during the the procedure which
(a) (b)
Figure 2-1: (a) A direct ophthalmoscope with the iPhone 4 attached to a Panoptic with a red plastic called the iExaminer. (b) A worn example of an indirect ophthal-moscope (Courtesy of the Pacific Airforce, http://www.pacaf.af.mil/)
Figure 2-3: A fundus camera photographs the retina using complex optics and a standard SLR camera. These devices are easier to align than handheld devices and do not require mydriatic drops to operate.
reduces the amount of motion blur in the image.
Fundus cameras have another advantage in alignment whereas by shining infrared light into the person's eye, alignment can be done optically before the picture is taken. Since the invisible infrared light does not cause the pupil to constrict, this allows for a wider field of view without the need for mydriatic drops.
Light shone into the eye during fundus imagery passes through two dissimilar paths: one into the pupil illuminating the retina, another out of the pupil from the retina [2]. This minimizes scattering and corneal reflections. Illumination through the sclera has also been addressed in [35], but has never been used in any real-world application.
While robust and efficient, fundus cameras are still large and costly. Tabletop fundus cameras cost around tens of thousands of dollars and require separate cameras that must be attached for image capture. Furthermore, since these devices have large alignment mechanisms such as forehead rests, chin rests, and alignment knobs, they
can weigh 50 pounds and be larger than a small refrigerator. In developing regions of the world where access to health care is limited, access to one of these machines is difficult (See Figure 2-3 for a fundus camera).
2.2.3
Scanning Laser Ophthalmoscopy and Optical
Coher-ence Tomography
Scanning laser ophthalmoscopes (SLOs) operate on a completely different principle than fundus imagery or standard ophthalmology. Instead of relying on conventional imaging and optics, scanning laser ophthalmoscopy uses confocal laser scanning mi-croscopy to image the retina in a rasterized fashion. This provides sharper contrast images that allow for better diagnosis of glaucoma, macular degeneration and other disorders [40].
Invented in the late 1980s, SLO technology is the newest form of ophthalmology.
A collimated laser beam is bounced off a beam splitter and sent into the eye. As the
light returns from the retina it interferes with the original beam in a meaningful way to produce a high contrast image of the retina.
Scanning laser ophthalmoscopy also requires dilation drops, to keep the eye from focusing during the procedure. Accommodation due to eye focus would drastically change the magnification and shape of the data returned as the laser rasterizes through the eye.
SLOs can cost more than a quarter of $1 million (See Figure 2-4).
2.3
Our Solution
Our solution attempts to simplify the five challenges in retinal imaging by reducing the complex optics used in a conventional photograph and replacing them with a computational backend (See Table 2.1). Adequate lighting is achieved, not through the pupillary axis of the eye, but through the external tissue next to the eye via cool to the touch, low power light emitting diodes. We call this technique indirect
(a) A standard Scanning Laser Ophthalmoscope.
(b) Using the SLO in our research lab.
Figure 2-5: We have developed a simple solution that trades complex optics for computation in order to take low quality images and extract the most data from them.
ILLUMINATION
TEST EYE
(3 STIMULUS
____ ~ DISPL AY
DISPEYE
Figure 2-7: An LCD display allows the user to control one eye with the other to obtain a large field of view of the retina. Images captured can be digitally processed to greatly enhance the quality.
Handheld Table-top Fundus Ophthalmoscopes Cameras $500+ SLO and OCT Moderate Moderate Our Device | cost self-capture Ease of Alignment Corneal Reflections o Field of View 2-D resoluton Moderate Image Quality Moderate
Optical
SimplityFigure 2-8: A comparison of various retinal imaging devices.
DISPLAY
diffuse illumination, for its transmissive properties through the surrounding tissue. We make use of small CMOS cameras with an aperture size less than the pupil size which increases the captured field of view and removes issues associated with focus blur.
Motion blur alignment issues are mitigated through computation and the lucky imaging approach [23]. The paradigm of traditional fundus photography is to capture one amazing image, while our philosophy is to capture many images and take the best subset of them, by selecting high quality images through computational procedures. Even though motion blur may be present in some of our images, chances are there is at least a subset that are crisp and sharp, which we can then integrate together computationally.
The entire form factor of our prototypes can fit into a standard eye-worn device. Recent developments in technologies make our hardware setup possible. Super bright, low-power LED light sources have only become become available in the recent history. The proliferation of cameras into our cellphones have not only made the cameras small, but also high resolution and constantly evolving. The high prevalence of mobile devices into our society allows us to compute things cheaply, and effectively, on-demand anywhere in the world.
We have developed a pair of safety goggles that contain an LCD screen on one side and a camera on the other, pointed inward towards the eyes. The user puts on the device, turns on the light, and instantly sees a picture of his or her retina on the
LCD screen. This allows for self-alignment without the need for a trained clinician. A
stimulus is presented on the LCD screen for the eye which is not being tested to follow.
By using gaze lock we can use one human organ to control the test eye, in a process
known as binocular coupling. As the free eye moves around following the stimulus control, the test eye follows in parallel space while we are capturing data from the retina. Images can be subsequently mosaiced together into a large panorama.
We contribute the following to the realm of retinal imaging:
o Optical Simplification. We observe that small-aperture imaging systems, possible today with micro cameras, allow for reduction in optical constraints
and simplify alignment procedures.
" Indirect Diffuse Illumination. Realization of an unexpected avenue to
pro-vide illumination to the retina via emerging solid state light sources such as LEDs with a unique form factor that can be placed near the skin.
" Self-imaging via Binocular coupling. Novel user feedback mechanism to
dramatically simplify alignment and avoid the need for wide field of view imag-ing where coupled gaze allows control of one eye by providimag-ing stimulus to the other eye while recording images with a narrow field of view camera. As far as we know this is the first near eye system to use coupled gaze control.
" Image Composition. Instead of highly engineered optics to overcome
chal-lenges such as alignment, blur, field of view, and timing, we use a computational photography approach to fuse images together from a varying-quality image se-quence.
2.4
Related Image Processing Work
2.4.1
Retinal Imaging and Light Transport
The eye is a key component for translating the external world to comprehensive rep-resentations. In recent years, computer graphics researchers have shown an increased interest in exploring the human visual system. Computational models describing cone distribution [10], anatomy [38], pupil light reflex [32], and light transport [22], have been formulated to improve the performance of various graphics and display applica-tions. Modeling real-world objects and their corresponding reflective, and refractive properties has especially been of great interest. Rendering the anterior segment, es-pecially the iris has been widely explored for a great variety of applications such as modeling realistic video game characters and surrounding objects [8, 24, 25, 36, 41].
2.4.2
Low-light Imaging and Integration
Various methods have been used to reduce noise in images, some using a single image, and others using a composite of many images. The Wiener Filter [42] tries to reduce noise by using an iterative method that first applies a filter and then measures the error from the resulting image. The Wiener Filter was the state of the art filter until [37] which used a nonlinear invariant for noise removal.
Phase correlation has been used in video to stabilize capture [13] due to its speed and accuracy. The work done by [16] shows that phase correlation can be used at a subpixel level which makes super-resolution possible.
super-resolution has been explored in [34] which describes the process by which a higher resolution image can be created with multiple images of lessor resolution. The method created by MIT Prof. Freeman [17] gives an example-based approach to super-resolution by first creating a database of real-images and then matching an upscaled image to natural formations in images. However, this method is not appropriate for medical applications, as many images captured could contain diseases that we would not want superimposed into high-resolution images. Techniques as described in [34]are used in this thesis to create super-resolution images.
The work done by Microsoft researchers in [44] conquers both de-noising and de-blurring in imaging conditions that contain low light (e.g. the retina).
2.4.3
Retinal Mosaicing
There has been much previous work done in panoramic stitching and blending, some-times called mosaicing in multiple dimensions. [3, 4] was one of the first comprehensive panoramic stitching algorithms available. A program called Hugin [9] builds on the panoramic tools to provide exposure correction and other advanced features.
The paper [7] describes a robust method of retinal mosaicing. For multi-modal image registration, we use a more robust method which is widely used in retinal imag-ing related research. Those methods described by [43] can deal with small portion of overlapping, and varying illumination images, a robust method for registration.
Chapter 3
Algorithms and Methodology
3.1
Processing Overview
3.1.1
Overview of Limitations of Captured Data
To capture images of the retina, we developed a hardware setup consisting of an
LED light source (or fluorescent light tube) and a CMOS webcam. This allows us
to capture many images of the retina sequentially in video format and utilize data across the temporal domain. However, each individual frame captured is not as high of quality as you would find in a typical fundus camera image due to the simplified optics and low lighting. As our design exchanges the complex optics and lighting for computation, the simplified images returned from the camera require processing in order to show in a single image as much data as on a typical fundus camera.
Image Ailments
* Fractional Sensor Saturation. Light leaving the eye through the pupil is concentrated in a circular cone which strikes the camera sensor in a particular manner, producing a red sphere on a black background. However, occasionally light leakage around the corner of the eye will cause a background to be non-black. Specifically, the areas around the sides of the retina are often a blurry white, pink, or red. In order to extract the most data that we can from the
sensor, we must identify the part of the sensor that contains the most data.
" Vignetting. Retinal images incident on the sensor appear more like spheres
than flat planes. The lens curvature of the eye creates a cosine falloff, or vi-gnetting, near the edges of the data. Therefore, not only must the region with the most data be determined, but a circular fit must be performed on the data to correct for vignetting. Color channels must also be balanced.
" Low Signal-to-Noise Ratio. Due to the lowlight nature of the eye, captured
images suffer from high gain and, as a result, a low signal-to-noise ratio. This makes it difficult for doctors and nurses to identify diseases that exist at low levels of contrast. For instance, the presence of diabetic retinopathy can some-times show up as yellow dots on the surface of the eye. Without a high contrast
image, we cannot accurately detect the small lesions.
" Partial Field of View. Each frame captured by our retinal imaging camera
contains about a 20 - 30' field of view. However, due to the vignetting and
other lens distortions, only the central 10 - 150 of the field of view contains
useful data. We would like to capture a full 1800 field of view of the retina to see all the way from fovea to the equator on either side of the eye interior. (See Figure 1-1 and Figure A-1 for examples of raw data)
3.1.2
Processing Outline
To address the aforementioned problems, we developed a four-step solution to derive the most data from retinal images.
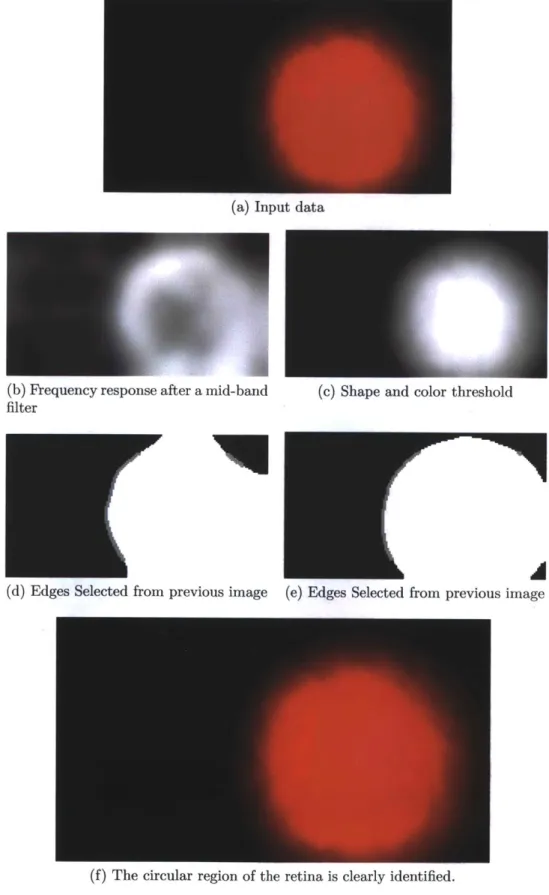
1. Image Registration & Correction. Captured images are analyzed for retinal
tissue. Once the circular region of the retina is identified, anti-vignetting is applied to the region to reduce lens effects and create a "flat" image. A selection is made from the central region of the retina circle as a region of interest. Only frames which contain a full view of the retina and are in sharp focus are used.
2. Frame Clustering. Once images have been vignetting corrected and a region of interest has been identified, corrected images are clustered into groups of similar images to be integrated locally. An online clustering algorithm is used in conjunction with phase correlation to detect similar images.
3. Local Integration. Noise reduction and super-resolution creation are done by
integrating similar images together locally on top of one another. Phase correla-tion is used to align images that may have shifted during capture. This is much faster and more accurate on our data set than traditional feature matching. 4. Panoramic Stitching. Integrated frames have reduced noise, higher
reso-lution, and increased contrast. These processed frames can now be stitched together into a large field of view mosaic using standard panorama techniques.
Fu3tFw Frame a2. 3. Localized 4. Mosaoc .afg rtw
V~dpo clusering Integration stithing ag
3.2
Image Registration & Correction
When images are captured from our setup, even though the retina (as
Image Registration & Correction Phase
through the pupil) is the primary ob-ject of focus, sometimes parts of the iris and sclera are apparent in the resulting
Registration & Retinal Recognition image (See raw data in Figure 1-1 and Figure A-1). Generally since these ob-jects are close to the camera, they ap-pear largely out of focus, and often times very dark/black. This allows us to
eas-Vignetting
Removal ily identify the part of the image sen-sor that contains the retina, by doing
Region-of- a simple thresholding operation
identi-Interest Crop fying the region of the circle that is the
brightest.
However, at times, light from our
fFm LED light source leaks around the sclera
and the iris causing regions around our Figure 3-2: Image Registration & Correc- area of interest on the sensor to glow.
tion Thus, a straightforward algorithm to
identify the region of interest on the im-age sensor presents a challenge (See Figure 3-3 for examples of input data). We present a robust algorithm to work through a large set of captured images.
3.2.1
Frequency Recognition
We try to identify the region of the image that we are interested in by performing a mid-band filter on the image, zeroing the highest and lowest frequencies. The highest frequencies in the image represent the noise, of which there is a lot due to the low