Analysis
What drives households to buy
fl
ood insurance? New evidence
from Georgia
Ajita Atreya
a,⁎
, Susana Ferreira
b, Erwann Michel-Kerjan
a aThe Wharton School, University of Pennsylvania, United States
bDepartment of Agricultural and Applied Economics, University of Georgia, United States
a b s t r a c t
a r t i c l e i n f o
Article history:
Received 1 August 2014
Received in revised form 21 May 2015 Accepted 7 June 2015
Available online 10 July 2015
Keywords: Floods Disaster insurance NFIP Race Georgia
Benefiting from access to detailed data on the federally run National Flood Insurance Program for the entire state of Georgia, USA, we analyze residentialflood insurance purchasing behavior in that state over more than three decades (1978–2010). The demand forflood insurance on an extensive margin, based on take-up rates, is found to be relatively price inelastic. Aligned with the behavioral economics literature, recentflood events tem-porarily increase purchases, but this effect fades after 3 years. We alsofind that the proportion of developed area infloodplains has a significant positive impact on insurance take-up rates. Contrary to what is often assumed, we do notfind evidence that insurance purchase and mitigation efforts are substitutes. Educated individuals, individ-uals over the age of 45, and African-Americans are, all else equal, more likely to purchaseflood insurance.
© 2015 Elsevier B.V. All rights reserved.
1. Introduction
Insurance is one of the most widely recognized risk transfer tools for ex ante management of weather disasters such asfloods. In the United States, after private insurers decided to leave theflood insurance market post the Great Mississippi Flood of 1927 and after several decades of reliance on government disaster relief, the federal government established the National Flood Insurance Program (NFIP) in 1968 (Dacy and Kunreuther, 1969; Michel-Kerjan, 2010). This national program offers
flood insurance coverage to residents and small businesses in communi-ties that adopt minimumfloodplain management policies. The Federal Emergency Management Agency (FEMA), which mapsflood risks, man-ages the program and setsflood insurance premiums. As of January 2015, there were over 5.4 millionflood insurance policies-in-force in the United States managed through this federal program.
While the program has been in place for over forty-five years, aca-demic research on its operation and the demand forflood insurance through the NFIP is fairly recent.1Browne and Hoyt (2000)provide
thefirst non-survey based empirical analysis of homeowners' demand forflood insurance using actualflood insurance purchase data through a state-level analysis across the nation. Their work suggests that the
flood insurance purchase decision is affected by both price and income, and that the decisions are highly dependent on prior year disaster losses.Kriesel and Landry (2004)use household-level data from coastal zones in the United States to examine participation in the NFIP for nine southeastern counties. Theyfind participation responsiveness to price to be inelastic. Expanding upon this analysis,Landry and Jahan-Parvar (2011)confirm a price-inelastic demand forflood insurance andfind that higher income households are more likely to purchaseflood insur-ance, afinding that suggests thatflood insurance is viewed as a normal good. Complementing recent efforts of FEMA to evaluate the NFIP's goals and performance,Dixon et al. (2006)identified factors contribut-ing to the purchase offlood insurance using parcel-level data for 100 NFIP communities across the United States. They show that, as expect-ed, the price offlood insurance has a negative (although not particularly strong) impact on demand, and that a higher proportion of homes in Special Flood Hazard Areas (SFHAs)2and subject to coastalflooding leads to higher demand for insurance. Three studies more recently have looked at specific states or cities:Zahran et al. (2009)show that householdflood insurance purchases in Florida correlate strongly with local government mitigation activities. Additionally, they show that NFIP policy take-up rates correlate positively with priorflood experi-ence, local hazard proximity conditions such as land area in the ⁎ Corresponding author at: Risk Management and Decision Processes Center, The
Wharton School, University of Pennsylvania, Jon M. Huntsman Hall #500, 3730 Walnut Street, Philadelphia, PA 19104, United States.
E-mail address:[email protected](A. Atreya).
1An exception is the seminal work ofKunreuther et al. (1978)who employedfield
sur-veys and laboratory experiments to determine the factors influencing the voluntary pur-chase of insurance by homeowners againstfloods and earthquakes. They found that higher income increased the chances of having an insurance policy; those with at least a high school education and older people were more likely to buyflood insurance than their less educated and younger counterparts.
2
SFHAs (alternatively, 100-yearfloodplains) are areas with a 1% annual chance of get-tingflooded.
http://dx.doi.org/10.1016/j.ecolecon.2015.06.024
0921-8009/© 2015 Elsevier B.V. All rights reserved.
Contents lists available atScienceDirect
Ecological Economics
floodplain, and the education attainment levels of individuals in a local-ity.Michel-Kerjan and Kousky (2010)find similarly that the majority of policies in Florida are located within FEMA-designated SFHAs.Kousky (2010)examines the demand forflood insurance in St. Louis, Missouri andfinds the take-up rates to increase with more land in high-risk
floodplains and to decline with levee protection along major rivers. Building upon these earlier studies, we examine the demand forflood insurance using data onflood insurance policies-in-force in counties of another coastal state, Georgia, which has nearly $24 billionflood insur-ance coverage in force as of 2014. We expand on previous analyses in a number of important ways.
First, we explore a greater array of covariates in our analysis. In addition to controlling for economic variables (income, price) and risk related variables (recentfloods, risk reduction efforts, percent-age of development withinfloodplains) as in earlier studies, we also control for demographic variables such as education and age, and also race.
Earlier, survey-based studies have found that the purchase of disas-ter insurance increases with the level of education and with age (Kunreuther et al., 1978; Baumann and Sims, 1978). We will empirically test whether this is the case using a regression analysis over a longer pe-riod of time (1978–2010) and whether it applies specifically toflood insurance.
To the best of our knowledge, race has never been tested as an ex-planatory variable affectingflood insurance demand. This is surprising since it has been shown that minority groups often differ in terms of world view, socioeconomic status (which we control for here), family organization and structure, political efficacy and trust in social and polit-ical institutions compared to the majority group (see Perry and Mushkatel, 2008, for instance).
Vaughan and Nordenstam (1991)review evidence on differences in environmental risk perceptions across ethnicities, and put forth three hypotheses to explain them: differences in prior experiences with or exposure to various hazards, dissimilar general beliefs about risk and uncertainty, and differences on various qualitative dimensions that
in-fluence non-expert assessments of risk. A review of the literature by Fothergill et al. (1999)synthesizesfindings on how various racial and ethnic groups perceive natural hazard risk, respond to warnings, are dif-ferently affected and recover from hazards. The review shows that there is indeed much variation across race and ethnic groups in the ways they perceive and deal with the risk of natural hazards. That different ethnic groups perceive the risk of a disaster differently has been shown in con-texts other thanfloods. For instance,Turner et al. (1980)found that African-Americans in southern California were much more fatalistic about earthquakes and felt that there was not much one could do to protect against those. Similarly,Palm (1996)found that white men were consistently the least concerned group about the risk to their homes.
Owing to these variations in risk perception, we might thus expect tofind variations between racial groups in the decision to purchase
flood insurance. If confirmed, this can have important implications for improving the way in which information aboutflood risk andflood insurance are communicated to these different groups. Georgia presents an excellent case study to do so since the state has a fairly high percent-age of minorities compared to the national averpercent-age (31% African-American versus 13% nationally). Georgia indeed ranks third in the U.S. by the proportion of the state population that is African American, after Mississippi (37%) and Louisiana (32%) (U.S. Census Bureau, 2010). Second, our empirical strategy controls for the percentage of popula-tion in a“non-participating”county,3and also for the proportion of
owner-occupied homes and renter-occupied homes in a county. It is indeed important to control for the“non-participating”community's population as they are ineligible to purchase flood insurance.
Consequently, having more“non-participating”communities in a coun-ty diminishes the insurance take-up rates. That said, wefind that only 32 communities exited the program over the period we studied and mostly in later years. These communities had only 14 policies-in-force when in the NFIP so we do not expect this variable to have a significant effect, but still consider it.
Third, our analysis benefits from a much longer time period and a larger sample size compared to earlier studies which used only a few years of data and a few counties to examine the demand forflood insur-ance (for example,Kriesel and Landry, 2004andLandry and Jahan‐ Parvar, 2011used 1998–1999 survey data for nine coastal counties). Here we use extensive panel data from 153 counties in Georgia for a pe-riod of 33 years (1978–2010).
Wefind evidence of price-inelastic demand forflood insurance and a positive income effect. We alsofind that recentflood damages have a positive impact on the adoption offlood insurance, consistent with previous literature (Baumann and Sims, 1978; Kunreuther et al., 1978; Kriesel and Landry, 2004; Carbone et al, 2006; Petrolia et al, 2013). Consistent with the availability heuristic (Tversky and Kahneman, 1973), wherein people rely on immediate examples of a hazard that come to mind while estimating their probabilities, we
find that this impact fades over time; the significance vanishes after 3 years.
We alsofind that publicly funded mitigation assistance (dollars spent by the government onflood mitigation per capita) has a posi-tive but insignificant effect on the decision to purchaseflood insur-ance. This is contrary to insurance theory that assumes insurance and mitigation to be substitutes (e.g.,Ehrlich and Becker, 1972; Mossin, 1968).
Regarding the demographic variables, we confirm that the de-mand forflood insurance increases with education level and age andfind that the demand increases with the proportion of African-Americans in the county. The newfinding on race is important for the reasons we discussed before. As one intuitively expects, the pro-portion of developed area in thefloodplain is found to be positively related to the number of policies purchased in a county, whereas having a larger percentage of population in non-participating com-munities in a county is negatively related to the number of policies purchased.
The article is organized as follows.Section 2provides a brief over-view of the operation of the NFIP as it relates to our study.Section 3 dis-cusses our hypotheses based on the literature and the data.Section 4 introduces our methodological approach.Section 5discusses the results andSection 6concludes.
2. The National Flood Insurance Program
The National Flood Insurance Act of 1968 created the NFIP as a vol-untary partnership between the federal government, communities and private insurers. The NFIP developsflood maps, establishes the de-ductible/limit menu, and sets premiums, including subsidized pre-miums for certain existing properties (seeMichel-Kerjan, 2010for a review). Over 90 private insurers collaborate with the program to sell
flood insurance policies through their networks and provide claim ad-justments. They receive an allowance for doing so on behalf of the fed-eral government but do not bear any risk. While there is a small private market forflood insurance, it represents only 5% of what is sold through the NFIP (Dixon et al., 2006).
A significant problem with the NFIP lies in its implementation. Effec-tiveflood damage prevention depends a great deal on the ability and willingness of community planners and property owners to adapt to the program. Due to low take-up rates even at subsidized premiums, Congress passed the Flood Disaster Protection Act of 1973, establishing mandatory purchase requirement for homeowners residing in the SFHA with a mortgage from federally-backed lenders. However, in a sur-vey conducted a decade after the NFIP was instituted, it was found 3
“Non-participating”communities are those that are no longer in NFIP due to either getting suspended from the program or that have withdrawn from the program.
that only 12% or fewer responding individuals of a community par-ticipating in the NFIP were aware of the building codes or land use regulations to mitigateflood damage; and only 1% were aware of the insurance mechanism to manageflood risk (Kunreuther et al., 1978). The mandatory purchase requirement was thus strengthened by the National Flood Insurance Reform Act of 1994. In the same year, the Flood Mitigation Assistance Program (FMA) was created with the goal of reducing insurance claims under the NFIP by providing funds for projects to reduce the risk offlood damage to buildings that are insured by the NFIP. Additionally, the Community Rating System (CRS) program was implemented in 1990 to provide incentives to communities to go beyond the NFIP minimal requirements to reduce
flood risks. Efforts by the community are scored by FEMA and allow residents of active CRS communities to benefit from a reduction in theirflood insurance premium (the higher the score the higher the insurance discount).
While more people are insured today againstflooding than were 25 years ago, the low take-up rate forflood insurance remains a vexing issue. ANew York Timesanalysis published a few days after Hurricane Katrina in 2005 revealed that“in the Louisiana parishes affected by the hurricane, the percentage of homeowners withflood insurance ranged from 58% in St. Bernard's to 7% in Tangipahoa. Six out of 10 res-idents in Orleans Parish had noflood insurance (Bayot, 2005)”. More re-cently, it was found that“only 20% of New York City households in the area inundated by Hurricane Sandy hadflood insurance at the time of the disaster, despite Sandy occurring a year after Hurricane Irene in the same area (NYC, 2013)”.
Althoughflood hazard andflood insurance information is publicly available,Chivers and Flores (2002)find evidence that most households living inflood zones of Colorado were not mindful of the existingflood risk classification nor were aware of theflood insurance rates and re-quirements when submitting their offer to purchase a property. Flood hazard disclosure requirements may prove effective in increasing
flood risk awareness.Troy and Romm (2004)andPope (2008)find that state disclosure laws (in California and North Carolina) brought down the prices of properties in thefloodplain by approximately 4% in both cases, suggesting that before the state disclosure laws, a significant fraction of buyers were unaware offlood risks.4Kriesel and Landry (2004)find that, although compliance is not full, theflood insurance re-quirements of FDIC-backed mortgage lenders increase the probability that homeowners in theflood zone hold such insurance, suggesting that the additional sale and disclosure requirement for mortgage lenders impact both knowledge and requirements to purchaseflood insurance.
In addition to problems with lowflood insurance penetration under the NFIP, Hurricane Katrina in 2005 and Hurricane Sandy in 2012 dem-onstrated that the premiums collected by this federal program were in-sufficient for the program to provide claim payments by itself when large disasters strike, without borrowing money from the U.S. Treasury, as the program was designed to do. The volume of claims after Hurri-cane Katrina was so high (more than the cumulative claim payments by the program since its inception) that, combined with Hurricanes Rita and Wilma, and then Hurricane Ike in 2008, it put the NFIP in debt for $18 billion (Michel-Kerjan, 2010). Hurricane Sandy in 2012 in-creased the debt even more. As of July 2013, the NFIP's debt was approx-imately $24 billion in total. The NFIP's debt and the current premium structure have raised concerns regarding its long-termfinancial solven-cy. Some advocacy groups have argued that the program disproportion-ately benefits wealthy households with expensive waterfront properties, but with a few exceptions (e.g.,Bin et al., 2011), there has
not been much research to determine who benefits from and who bears the cost of the NFIP.5
In 2012, the U.S. Congress passed the (Biggert–Waters) Flood Insur-ance Reform Act (BW-12) with a key provision to increase the existing discountedflood insurance premiums to full-risk levels, aimed to make the program morefinancially sound. However, BW-12 was re-vised in March 2014 curbing the planned insurance rate increase with the passage of the Homeowner Flood Insurance Affordability Act (HFIAA-14), in response to constituent concerns over affordability of the proposed premium increases. The program is up for renewal again in 2017 and could benefit from a more solid understanding of who is purchasingflood insurance and thus will be affected by changes in the program.
3. Data and Hypotheses 3.1. Hypotheses
To establish the hypotheses of our empirical analysis we rely onfi nd-ings from previous literature as well as theories underpinning the de-mand for insurance. Previous studies have noted that spending on insurance is viewed by homeowners as a poor investment (Baumann and Sims, 1978; Kunreuther et al., 1978). Other research, both theoret-ical and empirtheoret-ical, suggests a positive relationship between income and insurance purchases, and a negative relationship between price and in-surance purchases (Kunreuther et al., 1978; Browne and Hoyt, 2000). We thus hypothesize that an increase in income will positively affect the decision to purchaseflood insurance, while an increase in the price of the premium will affect it negatively.
Subjective perception of risks–influenced by events such as recent
flooding–also affects the decision to buyflood insurance. Household surveys in the Netherlands and Germany have established such rela-tionships between individualflood risk perceptions and willingness to pay forflood insurance (Botzen and van den Bergh, 2012; Seifert et al., 2013). In the United States,Petrolia et al. (2013)found that the likeli-hood of holdingflood insurance increased with previousflood event experience.Browne and Hoyt (2000),Dixon et al. (2006), andLindell and Hwang (2008)allfind thatflood experience serves as an immediate reminder of exposure toflood risk, resulting in higher demand forflood insurance which is mostly attributed to the availability heuristic (Tversky and Kahneman, 1973). On the other hand, the“gambler's falla-cy”may lead some people to believe that the odds of anotherflood oc-curring in the area in subsequent years have declined after a recent
flood (Kunreuther and Michel-Kerjan, in press).Croson and Sundali (2005) find evidence of the gambler's fallacy in their laboratory research in casinos. In the context of natural disasters, a recent review article byPidot (2013)shows that individuals recently struck by hurri-canes think that the hurricane was a once in a lifetime event, not to hap-pen again. Based on the opposing predictions of the availability heuristic and the gambler's fallacy, we are agnostic about the sign of the relation-ship between pastflood damage and demand forflood insurance.
Mitigation (actions taken to lower exposure) reduces the expected loss fromflooding and, therefore, could reduce the perceived need for
flood insurance. Burby (2006)provides evidence that the federal government's actions, such as building levees, make residents feel safer, supporting the common assumption that mitigation may serve as substitute forflood insurance. We expect tofind a negative relation-ship between government investment in mitigation and the demand for
4
Troy and Romm found the price discount to be more marked in neighborhoods with larger Hispanic population shares, suggesting that this group was particularly uninformed aboutflood risks.
5
Various proposals for reforming the NFIP have been suggested, including issuing long-term insurance contracts tied to the property instead of one-year renewable policies tied to the individual homeowner (Kunreuther and Michel-Kerjan, 2010) to reduce the num-ber of residents canceling their policies after just 2 or 3 years as has been shown to be the case (Michel-Kerjan et al., 2012), using federal funds to compensate existing landowners, and targeting properties deemed high-risk or environmentally sensitive to purchaseflood insurance (Barnhizer, 2003).
flood insurance, as found byBrowne and Hoyt (2000). However,Zahran et al. (2009)show that local government mitigation efforts, such as ac-tivities under CRS which translate toflood premium discounts, lead to more people buyingflood insurance.Botzen et al. (2009)find that homeowners are willing to make investments in mitigation in exchange for premium discounts. In the U.S., community participation in the NFIP is required in order to purchaseflood insurance. Therefore it is impor-tant to control for the proportion of population in a county that does not participate in the NFIP, which we hypothesize will be negatively re-lated to the demand forflood insurance.
There is also evidence that the same people who behave in a less risky manner are more likely to purchase insurance because they are prudent people generally speaking (Finkelstein and McGarry, 2006). In addition, one might expect that mitigation expenditures are highest in SFHAs where the potential benefits and need for mitigation are the largest. For that reason, our regressions control for objective exposure toflood risk with a variable capturing the proportion offloodplain in de-veloped areas of a county. We hypothesize that households in thefl ood-plain demand moreflood insurance due to perceived risk offlood and, therefore, this variable should have a positive impact on the demand forflood insurance.6
As indicated above, we are not aware of prior research that has test-ed whether racial differences impact the adoption offlood insurance. In regard to tolerance of risk,Sung and Hanna (1996)find that whites are more likely to be willing to take risks and that blacks tend to be less risk tolerant. Survey research byPalm (1998)suggests that non-white households exhibit a greater fear of disaster although it is unclear if that fear translates into the purchase offlood insurance or any other mitigation activities. Thus, the racial difference in the adoption of
flood insurance is ambiguous and needs to be tested empirically. As mentioned in the introduction section, the adoption of disaster insurance is found to be positively related to the level of education and age. Therefore, we hypothesize that a higher level of education and age will have a positive impact on the demand forflood insurance. Similarly, thefindings ofRiley and Chow (1992), that risk aversion rises at the age of 65, are consistent with the demand forflood insurance in-creasing with age.
The effect of the owner-occupied home status on the demand for in-surance is unclear. On one hand it should be positive, as for most homeowners, the house is a primary asset in their portfolio (Flavin and Yamashita, 2002) and one would want to protect it. On the other hand, as we indicated above, many homeowners do not purchase
flood insurance.
Table 1presents the variables that are expected to affect theflood in-surance purchasing decision and their hypothesized signs.
3.2. Data
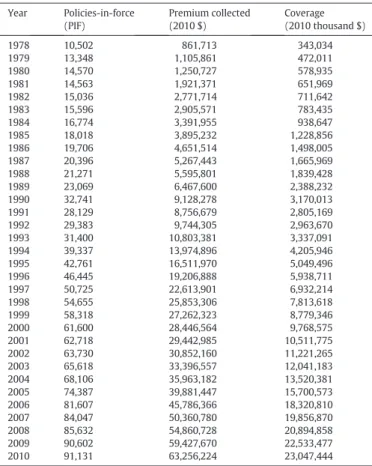
We collected our data from several sources. County-level data on NFIP policies-in-force from 1978 to 2010 were provided to us by FEMA.7This dataset includes the number of policies-in-force (PIF),
flood insurance premium collected, andflood insurance coverage in-force for a given county and for a given year (Table 2). Over this period, the number of NFIPflood insurance policies-in-force increased almost 9-fold (from about 10,500 to over 91,000), while the population in the state less than doubled (from about 5.2 million in 1978 to 9.7 million in 2010). As of 2010, the last year covered by the study, there was nearly $24 billion of NFIPflood insurance coverage in place in Georgia, a level that has grown only by a few percentage points since. Additionally, also from FEMA, we obtained data on Flood Mitigation Assistance (FMA) provided to counties in Georgia.8
We obtained a GISfile withfloodplain maps and land cover data for the state of Georgia from Georgia's GIS clearinghouse and overlaid FEMAfloodplain maps onto the land cover layer to calculate the propor-tion of developed area of a county that falls in afloodplain. This ensures that the uninhabitedfloodplain areas of the county are excluded from the analysis.9Ideally, we would have performed the analysis using
household-level data, but for privacy reasons, data at this level of disag-gregation were not available from FEMA.
6
Also, as noted earlier in the article, properties in the SFHA are affected by state disclo-sure requirements and mandatory purchase offlood insurance if they have FDIC-regulated mortgage lenders.
Table 1
Drivers offlood insurance purchasing decision.
Variables Hypothesized sign Results
Income + +
Price − −
Recentflood event ? +
Mitigation ? + (insignificant)
Race ? + (for African-American) &
−(insignificant for Whites)
Education(high school & up) + +
Age + + (for 45 & up) Home occupancy (owner) ? −(insignificant) Home occupancy (renter) ? + (insignificant) Percent offloodplain in
developed area of a county
+ + Proportion of population in “non-participating” communities in NFIP − −(insignificant) 7
We thank the Mitigation Directorate at FEMA, DHS for providing the data.
8
NFIP-participating communities with approved hazard mitigation plans are eligible to apply for FMA grants. For more details see:http://www.gema.ga.gov/Mitigation/Pages/ Flood-Mitigation-Assistance-%28FMA%29.aspx.
9
We thank an anonymous referee for pointing this out. We used the 100-yearfl ood-plain sinceflood insurance is mandatory for the 100-yearfloodplain properties only and excluded 500-year properties from thefloodplain variable.
Table 2
NFIP policies-in-force, premium and coverage in Georgia from 1978 to 2010. Year Policies-in-force (PIF) Premium collected (2010 $) Coverage (2010 thousand $) 1978 10,502 861,713 343,034 1979 13,348 1,105,861 472,011 1980 14,570 1,250,727 578,935 1981 14,563 1,921,371 651,969 1982 15,036 2,771,714 711,642 1983 15,596 2,905,571 783,435 1984 16,774 3,391,955 938,647 1985 18,018 3,895,232 1,228,856 1986 19,706 4,651,514 1,498,005 1987 20,396 5,267,443 1,665,969 1988 21,271 5,595,801 1,839,428 1989 23,069 6,467,600 2,388,232 1990 32,741 9,128,278 3,170,013 1991 28,129 8,756,679 2,805,169 1992 29,383 9,744,305 2,963,670 1993 31,400 10,803,381 3,337,091 1994 39,337 13,974,896 4,205,946 1995 42,761 16,511,970 5,049,496 1996 46,445 19,206,888 5,938,711 1997 50,725 22,613,901 6,932,214 1998 54,655 25,853,306 7,813,618 1999 58,318 27,262,323 8,779,346 2000 61,600 28,446,564 9,768,575 2001 62,718 29,442,985 10,511,775 2002 63,730 30,852,160 11,221,265 2003 65,618 33,396,557 12,041,183 2004 68,106 35,963,182 13,520,381 2005 74,387 39,881,447 15,700,573 2006 81,607 45,786,366 18,320,810 2007 84,047 50,360,780 19,856,870 2008 85,632 54,860,728 20,894,858 2009 90,602 59,427,670 22,533,477 2010 91,131 63,256,224 23,047,444
Data on totalflood damage per capita in previous years was collected from SHELDUS, a county-level hazard dataset derived from the National Climatic Data Centre.10The socio-demographic variables:Age, Educa-tion,Income,OccupancyandRacecome from the Bureau of Economic Analysis and the U.S. Census Bureau. The variableIncomeis available an-nually;Age,Education,OccupancyandRacewere interpolated decennial data from the U.S. Census Bureau to get yearly estimates.11
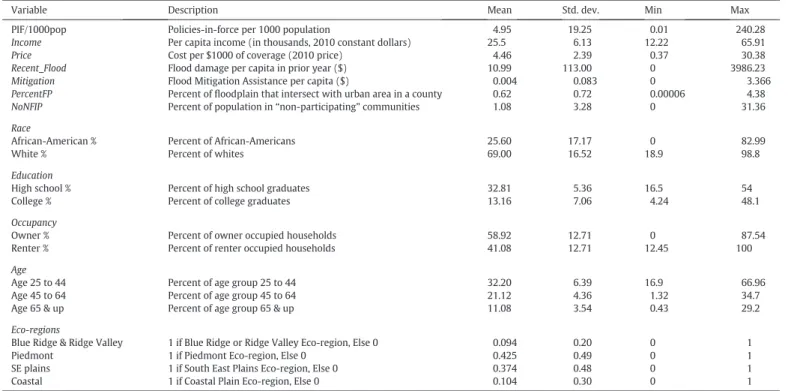
Table 3reports the summary statistics of the variables included in the model. The average per capita income over the period 1978–2010 was almost $26,000 (2010 prices). The average number of policies-in-force per thousand population at the county level was 4.95.12The average
cost was $4.46 per $1000 offlood insurance coverage (2010 prices). The meanflood damage per capita during the precedingflooding event was $11.13Federal mitigation spending was on average only $0.004 per capita
for the State of Georgia over our study period. On average, 0.62% of the developed county areas fall in thefloodplain with a maximum of 4.38% in Glynn County.
Table 4reports the comparison of the summary statistics between coastal and inland counties. Wefind much higher market penetration in coastal counties. The cost per $1000 offlood insurance coverage is not statistically different between inland and coastal counties, indicat-ing that the level of risk is, accordindicat-ing to the FEMA risk mappindicat-ing, not that different on average (even though the risk perception might be). The meanflood damage per capita per year is actually higher in inland counties ($11.86) than in coastal counties ($6.63). It is worth mention-ing that all the significantflood events during our period, such as those in Albany (1994 and 1998) and Atlanta (2009), were in inland counties.
The amount per capita spent on mitigation is much higher for the coast-al counties, a 5-to-1 ratio, compared to spending in inland counties. Interestingly, wefind no significant differences among the socio-economic variables between coastal and inland counties.
4. Methods
4.1. Econometric Model
Using the data described above, we analyze the demand forflood in-surance across 153 counties14in Georgia for the period 1978–2010. We
estimate the following demand equation:
lnðPI F=1000popÞit¼β0þαiþβ1ln Incomeð Þitþβ2ln priceð Þit þ∑6
j¼1φjln recent floodð Þi tð−jÞþβ3ln Mitigationð Þitþβ4PercentFPiþβ5NoNFIPit þ∑2 j¼1ηjRacejitþ∑ 2 j¼1τjEducationjitþ∑ 2 j¼1ρjOccupancyjitþ∑ 3 j¼1ξjAgejit þ∑4 j¼1γjEcoregionsjiþδtþεit: ð1Þ The dependent variable is the logarithm of the number offlood in-surance policies-in-force (PIF) purchased per 1000 population in a county-year.15The income variable, ln(Income), is the log of per capita
income in the county during the year. The variable ln(Price) is the log of the cost per $1000 of insurance coverage. We measured the cost per $1000 offlood insurance coverage (Price) by dividing the dollar value of the premium paid by residents forflood insurance in the county during the year by the dollar value of NFIP insurance coverage (in thou-sands) in the county during the year. Taking the natural logarithm of 10
SHELDUS refers to Spatial Hazard Events and Losses Database for United States. Details on how the data is collected can be found athttp://webra.cas.sc.edu/hvri/products/ sheldusmetadata.aspx.
11
We calibrated an exponential curve to the decennial data (1980, 1990, and 2000) for each county. Using a linear curve to estimate the data, however, did not change the results.
12There is a large difference in market penetration between coastal counties (21
policies-in-force per 1000 population) and inland counties (only 2 policies-in-force per 1000 population).
13
This is aligned with the $9.8figure inBrowne and Hoyt (2000).
Table 3
Variables and descriptive statistics for county-level analysis (1978–2010).
Variable Description Mean Std. dev. Min Max
PIF/1000pop Policies-in-force per 1000 population 4.95 19.25 0.01 240.28
Income Per capita income (in thousands, 2010 constant dollars) 25.5 6.13 12.22 65.91
Price Cost per $1000 of coverage (2010 price) 4.46 2.39 0.37 30.38
Recent_Flood Flood damage per capita in prior year ($) 10.99 113.00 0 3986.23
Mitigation Flood Mitigation Assistance per capita ($) 0.004 0.083 0 3.366
PercentFP Percent offloodplain that intersect with urban area in a county 0.62 0.72 0.00006 4.38
NoNFIP Percent of population in“non-participating”communities 1.08 3.28 0 31.36
Race
African-American % Percent of African-Americans 25.60 17.17 0 82.99
White % Percent of whites 69.00 16.52 18.9 98.8
Education
High school % Percent of high school graduates 32.81 5.36 16.5 54 College % Percent of college graduates 13.16 7.06 4.24 48.1
Occupancy
Owner % Percent of owner occupied households 58.92 12.71 0 87.54 Renter % Percent of renter occupied households 41.08 12.71 12.45 100
Age
Age 25 to 44 Percent of age group 25 to 44 32.20 6.39 16.9 66.96 Age 45 to 64 Percent of age group 45 to 64 21.12 4.36 1.32 34.7 Age 65 & up Percent of age group 65 & up 11.08 3.54 0.43 29.2
Eco-regions
Blue Ridge & Ridge Valley 1 if Blue Ridge or Ridge Valley Eco-region, Else 0 0.094 0.20 0 1 Piedmont 1 if Piedmont Eco-region, Else 0 0.425 0.49 0 1 SE plains 1 if South East Plains Eco-region, Else 0 0.374 0.48 0 1 Coastal 1 if Coastal Plain Eco-region, Else 0 0.104 0.30 0 1
14Of the 159 counties in Georgia, data were missing for 6 counties: Clay, Lincoln, Marion,
Schley, Treutlen and Webster.
15
FollowingZahran et al. (2009), we replaced the dependent variable with the number of policies-in-force per 100 households in a county and the results were robust.
both the income and the price allows us to interpret the results as income and price elasticities of the demand offlood insurance, respectively.
According to the availability heuristic, recent largeflood events could heighten risk perceptions and this could influence the decision to purchaseflood insurance. To control for the effect of recentflooding on individuals' demand for flood insurance we use the variable ln(Recent_Flood) that measures the dollar value of totalflood damage per capita in the county during the preceding year.Atreya et al. (2013)andBin and Landry (2013)find that largeflood events result in a marked price drop for properties infloodplains but that this effect vanishes over time, as early as four years after theflood. To capture the potential decay in the effect of experiencing aflood, we included up to six lags for the ln(Recent_Flood) variable, that is, we include annual totalflood damages per capita for the preceding six years. To measure the effect of federal assistance to mitigateflood damages on the decision to purchaseflood insurance, we included per capitaflood mitigation as-sistance by FEMA per county-year: ln(Mitigation).PercentFPdenotes the percentage of developed county land within the 100-yearfloodplain. NoNFIPis the percentage of population in a county residing in commu-nities that do not participate in the NFIP.
The decision to buyflood insurance could also depend on whether the county is coastal or is located inland.16We control for regional
variation in Georgia by including dummies for thefive eco-regions in Georgia: Blue Ridge, Ridge and Valley, Piedmont, Southeast Plains; the control group being the coastal plains. This distinction separates the higher elevation Blue Ridge, Ridge and Valley, and Piedmont from the low-lying southeast plains and coastal plains.17
Unlike most previous papers, we include the socio-demographic char-acteristics of the households at the county level in our models.Racein Eq.(1)is measured with two variables—the percentage of the population who is African-American and the percentage of white population in a county. TheEducationvariables include the percentage of high school graduates and the percentage of college graduates in a county. Three dif-ferent age categories are included in theAgevariable: 25 to 44, 45 to 64, and 65 and up. All these variables are entered as a percentage of total pop-ulation in a county. We also include the percentage of houses in the coun-ty that are rented and the percentage of houses that are owner-occupied (Occupancy). The distinction between the owner-occupied and
non-owner occupied properties is important since a substantial portion of the non-owner occupied properties are located inflood zones.
4.2. Estimation Methods
First, we estimated Eq.(1)using afixed effects (FE) panel regression;
δtare the yearfixed effects that capture any common time trends across counties over the study period, whileαidenotes a county-specific inter-cept that controls for unobserved characteristics at the county level that are constant over time. We note, however, that the location in thefl ood-plain variable (Percent FP) and theEcoregiondummies do not vary over time and drop from the FE model.18Thus, we also estimated Eq.(1)
using a random-effects (RE) model including these time-invariant vari-ables. We conducted a Hausman test to determine the best model to use in our case. The test failed to reject the null that the coefficients estimat-ed by the efficient RE estimator and the consistent FE estimator are the same (χ2= 19.25,p-value = 0.99), and thus we opted for a RE model. With over 30 years of data, serial autocorrelation is a concern in our model. We performed a Wooldridge test (Wooldridge, 2002; Drukker, 2003) and indeed found evidence of serial autocorrelation (F = 130.40,p-valueb0.001). Therefore, we corrected the RE model for serial autocorrelation.
5. Results
5.1. Market Penetration
Wefirst estimate county-level market penetration rates, that is, the proportion of households in a county that have purchasedflood insur-ance. As expected, penetration rates are highest in coastal counties where the proportion of land in thefloodplain is higher.19Fig. 1shows
market penetration rates by county for 2010. We divided the total num-ber of residential policies-in-force by the total numnum-ber of household with data from the 2010 U.S. Census. The topfive counties with the highest percentage of market penetration in 2010 were Glynn (44.86%), Bryan (40.28%), Chatham (27.42%), Camden (19.22%), and McIntosh (10.50%).
Not surprisingly, there is a strong correlation between the market penetration and the proportion offloodplain area within a county.20The coastal counties where the percentage offloodplain is the largest tend to have the highest penetration rates (Fig. 1andTable 5), most likely be-cause of the mandatory purchase requirement for properties in 100-year
floodplains with a mortgage and because residents may be more aware of the risk they face. Our measure of market penetration, however, refers to the total number of properties in a county, and not specifically to those in thefloodplain. Another factor that could potentially explain the market penetration rate is a recentflooding event in a county.Atreya et al. (2013)find that after a significantflood event (“theflood of the century”) in 1994 in Dougherty County, GA, the take up rates increased dramatical-ly. Dougherty is precisely the county with the largest market penetration among inland counties in Georgia (Fig. 1).
5.2. Regression Results
We report the results of the estimation of Eq.(1)inTable 6. Thefirst column shows the estimates from thefixed effect (FE) model. We com-pare these results with those from a random effects (RE) model in the second column (2) while still dropping the time-invariant variables. In the third column (3) we estimate a RE model that includes important
16
Dixon et al. (2006)found a significant regional variation and higher market penetra-tion in coastal counties.
17The eco-regions are characterized by a large degree of homogeneity in geographical
phenomena including geology, physiography, vegetation, climate, hydrology, and soils. A simpler distinction between inland and coastal counties by including a coastal dummy did not change the results.
18
Thefloodplain maps were not updated in the 33 years covered in our sample. Georgia started a map modernization program in partnership with FEMA in 2009 to develop and updateflood hazard maps for all its counties.
19 SupportingDixon et al. (2006),Kousky (2010)alsofinds a higher market penetration
in census tracts with more land in the 100-year and 500-yearfloodplains in St. Louis Coun-ty, Missouri.
20
The correlation coefficient between the two is 0.70.
Table 4
Variables and descriptive statistics: coastal counties and inland counties. Variables Coastal counties Inland counties
Mean Std. dev. Mean Std. dev. PIF/1000pop 20.53 43.43 1.83 3.05 Income ($ thousands) 23.32 5.94 26.40 6.66 Price 4.16 2.14 4.52 2.43 Recent_Flood 6.63 57.56 11.86 121.07 Mitigation 0.01 0.14 0.002 0.07 African-American% 26.59 11.10 25.40 18.14 White % 69.62 11.91 68.87 17.29 High school % 34.88 5.56 32.39 5.22 College % 11.45 5.32 13.51 7.32 Owner % 60.31 12.64 58.63 12.71 Renter % 39.68 12.64 41.36 12.71 Age 25 to 44 32.08 5.40 32.23 6.58 Age 45 to 64 19.71 4.75 17.03 3.64 Age 65 & up 10.03 3.50 12.94 1.84 Floodplain % 1.38 1.34 0.53 0.54 No NFIP participation 0.20 0.67 1.18 3.44
time-invariant variables that drop from the FE model:Percent FPand Eco-region dummies. In the fourth column (4) we estimate a RE model that is corrected for serial autocorrelation.
The empirical analysis supports hypothesis that income and price significantly influence the decision to buyflood insurance. The estimat-ed income elasticity in the RE model (column 4) is 0.39 and statistically significant at a 5% level. The estimated coefficient for the price elasticity of insurance (where price is measured by the cost per $1000 dollars of coverage) is negative and statistically significant at a 1% level across all models, with a point estimate ranging from−0.16 to−0.30. This is
broadly consistent with previous studies at the state level (Browne and Hoyt, 2000) and individual level (Kriesel and Landry, 2004) that
find an inelastic demand forflood insurance.
Our empiricalfindings also suggest that, consistent with the avail-ability heuristic,flood damage in previous years has a significant posi-tive impact on the decision to buyflood insurance. This effect is statistically significant for damages up to three years back, and then it vanishes (replacing per capita damage in previous years by the number offlood events in the county did not change the results).
Wefind a positive but insignificant relationship betweenflood mit-igation assistance andflood insurance purchases at the county level, which is in contrast to the general assumption that mitigation and in-surance are substitutes. This result could be due to the fact that the mit-igation assistance funds used by Georgia are too small to have an economically meaningful impact on the demand forflood insurance.
Wefind a strong positive relationship between the proportion of developed area in afloodplain and the policies-in-force in a county, implying that people living infloodplains are in fact more likely to buy
flood insurance. This result could be driven by the mandatory purchase requirement for the properties with a federally backed mortgage in the 100-yearfloodplain. Results show that a unit increase (measured in Fig. 1.Flood insurance market penetration in Georgia defined as the rate of policies-in-force divided by the number of housing units., 2010.
Source: Authors prepared map based on data provided by FEMA.
Table 5
Top 5 counties in Georgia for percent offloodplain area andflood insurance market penetration.
County Floodplain (%) County Market penetration (%) Glynn 72.24 Glynn 44.86 Chatham 72.22 Bryan 40.28 Camden 54.68 Chatham 27.42 Bryan 54.14 Camden 19.22 Ware 52.43 McIntosh 10.50 Note: As of 2010.
percentage point increments) in the proportion of developed area in
floodplains is associated with a 1.009 proportionate rise in the NFIP take up rates. For Georgia, this means that an increase in the developed area infloodplain by 1 percentage point (for example from 1% to 2%) in-creases thecountof NFIP policies per 1000 population by 5, that is, by approximately 100%. Our estimate for the effect ofPercentFPis larger than in most of the earlier studies, however, we note that our calcula-tion ofPercentFPis more precise in that we do not take into account the undeveloped area of a county that falls in thefloodplain.
Race, education and age all have a significant impact onflood insurance purchases. We consistentlyfind that the higher the propor-tion of African-American populapropor-tion in a county, the higher theflood in-surance take-up rate. A unit increase in the proportion of African-American population (measured in percentage point increments)
increases the NFIP policies per 1000 population by 1.05% (column (4) inTable 6). We do notfind a significant relationship between the proportion of white population in a county and theflood insurance take-up rates. These twofindings are certainly worth pursuing in future research.
Regarding education, the result suggest that for the average county, a 1 percentage point increase in the percentage of high school graduates is associated with a 4.35% increase in NFIP policies per 1000 population and the magnitude of the effect is the same for college graduates as well. Wefind that on average, there is a positive and significant effect associ-ated with age and insurance take-up rates. For example, in column (4), a 1 percentage point increase in the age group 45 to 64 in the average county is associated with an approximately 4.7% increase in the policies-in-force per 1000 population. This increase is 5.6% for the age group 65 and up.
We do notfind a significant relationship between the occupancy of a home on the insurance take-up rates except in column 2, where an in-crease in owner-occupied homes in a county is associated with de-creasedflood insurance policies-in-force while an increase in renter-occupied homes in a county is associated with increasedflood insurance policies-in-force. This result may be attributable to tax benefits of owning rental properties, that is, landlords get to deduct insurance from income, which homeowners do not. It is also consistent with a moral-hazard argument whereby landlords insure their properties against generic hazards, includingfloods, as a precaution from careless tenants. Thisfinding is not surprising in light of statistics by the Congressional Budget Office (CBO) (2007)that roughly one-quarter of the coastal properties with subsidizedflood insurance are not primary residences and that 20% of the NFIPflood insurance contracts were for non-principal residences.
Lastly, wefind that compared to coastal plains in Georgia, other eco-regions buy fewerflood insurance policies as suggested by negative and significant coefficients of the eco-region variables. The results are robust to including a dummy for coastal counties in a separate regression in-stead of controlling for different eco-regions in Georgia.
Of all the results, of particular interest to this paper is the effect that race has on the uptake offlood insurance policies. In order to check for the robustness of our results, we estimated a number of alternative re-gressions. First, we tested whether the effect of race that we see in our result was conditional upon income levels. To do this, we ran a separate model including the interaction of the race variable with income. Al-though statistically significant, the magnitude of the interaction term was extremely small to make any difference to the results. Similarly, we interacted the race variable with the price of insurance. This interac-tion was insignificant, suggesting that the effect of race was not mediat-ed by the price of insurance. We then separatmediat-ed our sample into two periods: 1978–1994 and 1995–2010 to see if the effect of race has remained the same over these two time periods.21To our surprise, we
find that there was no significant effect of race in the pre-1994 period; in contrast, in the post-1994 period the effect was much stronger (pos-itive and significant at the 1% level for the African-American variable, and negative and significant at the 5% level for the white variable), sug-gesting that our results are driven by the most recent observations.22
6. Conclusions
The National Flood Insurance Program was established by the feder-al government in the United States in 1968 to provide affordableflood
21
We chose 1994 as our cutoff date since the mandatory purchase requirement was strengthened after the 1994 Reform Act.
22
The results are available upon request. Another variable that stood out in the pre- and post-1994 analyses is“recentflood event”. Wefind that in the pre-1994 sample period, the effect of recentflooding was significant for up to 5 lags (t−5) while in the post 1994 sample period the effect was significant only for up to 2 lags (t−2). This points to a change in mindset that is much more oriented to short-term thinking in the second half of the sample period.
Table 6
Regression results—dependent variable: ln(policies-in-force/1000 population). Variables (1) (2) (3) (4) Fixed effects Random effects Random effectsa Random effectsb ln(Income) 0.261 0.380* 0.408** 0.390** (0.203) (0.200) (0.199) (0.191) ln(Price) −0.302*** −0.299*** −0.298*** −0.156*** (0.040) (0.040) (0.039) (0.030) ln(Recent_Flood) (t−1) 0.015* 0.016** 0.016** 0.026*** (0.007) (0.007) (0.007) (0.004) ln(Recent_Flood) (t−2) 0.018** 0.018** 0.018** 0.024*** (0.007) (0.007) (0.007) (0.005) ln(Recent_Flood) (t−3) 0.016** 0.016** 0.017** 0.023*** (0.007) (0.008) (0.008) (0.006) ln(Recent_Flood) (t−4) 0.003 0.004 0.005 0.008 (0.008) (0.008) (0.008) (0.006) ln(Recent_Flood) (t−5) 0.007 0.008 0.008 0.009* (0.008) (0.007) (0.007) (0.005) ln(Recent_Flood) (t−6) 0.0004 0.001 0.001 0.005 (0.007) (0.007) (0.007) (0.004) ln(Mitigation) 0.073 0.071 0.078 0.018 (0.067) (0.070) (0.07) (0.035) PercentFP – – 1.016*** 1.009*** (0.140) (0.152) NoNFIP 0.080 −0.048 −0.023 −0.0327 (0.058) (0.0296) (0.02) (0.026) African-American % 0.018*** 0.014*** 0.014*** 0.0105** (0.003) (0.003) (0.003) (0.004) White % −0.009** −0.005 −0.004 −0.0002 (0.004) (0.003) (0.003) (0.002) High school % 0.05*** 0.049*** 0.051*** 0.0435*** (0.006) (0.006) (0.006) (0.010) College % 0.031*** 0.033*** 0.034*** 0.0445*** (0.008) (0.007) (0.007) (0.012) Owner % −0.0005 −0.005** −0.003 −0.0005 (0.002) (0.002) (0.002) (0.003) Renter % 0.001 0.005* 0.0015 −0.0015 (0.003) (0.003) (0.003) (0.004) Age 25 to 44 0.022** 0.018* 0.015 0.0043 (0.009) (0.009) (0.009) (0.017) Age 45 to 64 0.069*** 0.057*** 0.060*** 0.0472** (0.015) (0.013) (0.013) (0.021) Age 65 & up 0.104*** 0.076*** 0.068*** 0.0565** (0.018) (0.016) (0.015) (0.0254) Blue Ridge & Ridge Valley – – −0.219 −0.362
(0.447) (0.470) Piedmont – – −1.726*** −1.669*** (0.268) (0.286) SE plains – – −1.047*** −0.932*** (0.287) (0.300) Constant −7.250*** −7.971*** −7.773*** −7.172*** (2.090) (2.049) (2.028) (2.068) Yearfixed effects Yes Yes Yes Yes Observations 2887 2887 2887 2887 R-Squared 0.668 0.665 0.666 0.666 Notes: Standard errors in parentheses; *** pb0.01, ** pb0.05, * pb0.1; a) includes time invariant variables; b) includes time invariant variables and is corrected for serial autocor-relation using the xtregar command in STATA.
insurance to homeowners and to mitigate flood losses through community-enforced building and zoning ordinances. The NFIP has long struggled with the low take up offlood insurance coverage despite the enduring efforts to overcome this challenge. Our analysis of the factors that influence Georgia homeowners' decisions to purchase
flood insurance should contribute to the emerging research literature aiming to better understand the drivers offlood insurance purchases. We also depictflood insurance market penetration in the state of Georgia.
Unsurprisingly, the flood insurance market penetration rate is higher in coastal counties than inland. More generally, our analysis at the county level for the period 1978–2010 suggests that, as we would expect, the counties with higher proportion of developed land within
floodplains purchase moreflood insurance policies. We alsofind the price elasticity offlood insurance to be fairly low (at−0.30,−0.15) suggesting that those exposed the most want and do purchase that cov-erage. At a time when issues of affordability are at the forefront of the NFIP's reform debate, thefinding that an increase in the price of pre-miums does not highly impact the take-up offlood insurance can help policymakers make informed policy decisions.
Ourfindings suggest that other determinants of risk perception, such as having experienced recentflood events, have a significant pos-itive effect on the number of policies-in-force, supporting the hypothe-sis of the availability heuristic. A recentflood event can be easily brought to mind and therefore heightens the perceived probability of a futureflood, which leads to purchasingflood insurance. We found that this effect vanishes after 3 years, however; memory is short.
Demographic variables such as education and age are found to have a significant effect on the number of policies-force in a county. It is in-teresting to note that age groups above 45 are more likely to buyflood insurance which may be suggestive that these age groups are more risk averse than their younger counterparts and that therefore aware-ness campaigns regarding the role of insurance in reducing losses should target the younger population. We also tested the impact of race and found that areas with higher concentration of African-Americans had, all things being equal, a higher demand forflood insur-ance. It would be interesting to perform a similar analysis nationwide to see if race has the same effect as in Georgia. FEMAflood risk awareness campaigns have never segmented target audience by race or age. Our analysis suggests that it might be important to do so.
Acknowledgments
The authors thank Jeffrey H. Dorfman, Elizabeth Kramer, Warren Kriesel, Howard Kunreuther, Carol Heller and two anonymous re-viewers for useful comments. The authors also thank Susan Bernstein at FEMA for providing the data. Funding for this research comes from the Zurich Insurance Foundation, the Center for Risk and Economic Analysis of Terrorism Events (CREATE) at the University of Southern California (U.S. Department of Homeland Security’s Center of Excellence), the Travelers–Wharton Partnership for Risk Management Fund, and the Wharton Risk Management and Decision Processes Center.
References
Atreya, A., Ferreira, S., Kriesel, W.P., 2013.Forgetting theflood? An analysis of theflood risk discount over time. Land Econ. 89 (4), 577–596.
Barnhizer, D.D., 2003.Givings recapture: funding public acquisition of private property in-terests on the coasts. Harv. Environ. Law Rev. 27, 295–375.
Baumann, D.D., Sims, J.H., 1978.Flood insurance: some determinants of adoption. Econ. Geogr. 54 (3), 189–196.
Bayot, J., 2005. Payouts hinge on the cause of damage. N.Y. Times (August 31)http://www. nytimes.com/2005/08/31/business/payouts-hinge-on-the-cause-of-damage.html. Bin, O., Bishop, J., Kousky, C., 2011.Redistributional effect of National Flood Insurance
Pro-gram. Public Financ. Rev. 40 (3).
Bin, O., Landry, C.E., 2013.Changes in implicitflood risk premiums: empirical evidence from the housing market. J. Environ. Econ. Manag. 65 (3), 361–376.
Botzen, W.J.W., Aerts, J.C.J.H., van den Bergh, J.C., 2009.Willingness of homeowners to mitigate climate risk through insurance. Ecol. Econ. 68 (8), 2265–2277.
Botzen, W.J.W., van den Bergh, J.C., 2012.Risk attitudes to low-probability climate change risks: WTP forflood insurance. J. Econ. Behav. Organ. 82 (1), 151–166.
Browne, M.J., Hoyt, R.E., 2000.The demand forflood insurance: empirical evidence. J. Risk Uncertain. 20 (3), 291–306.
Burby, R.J., 2006.Hurricane Katrina and the paradoxes of government disaster policy: bringing about wise governmental decisions for hazardous areas. Ann. Am. Acad. Pol. Soc. Sci. 604 (1), 171–191.
Carbone, J.C., Hallstrom, D.G., Smith, V.K., 2006.Can natural experiments measure behavioral responses to environmental risk? Environ. Resour. Econ. 33 (3), 273–297.
CBO, 2007.Value of Properties in the National Flood Insurance Program (No. Pub. No. 2807). Congressional Budget Office (United States Congress).
Chivers, J., Flores, N.E., 2002.Market failure in information: the National Flood Insurance Program. Land Econ. 78 (4), 515–521.
Croson, R., Sundali, J., 2005.The gambler's fallacy and the hot hand: empirical data from casinos. J. Risk Uncertain. 30 (3), 195–209.
Dacy, D.C., Kunreuther, H., 1969.Economics of Natural Disasters: Implications for Federal Policy. The Free Press, New York.
Dixon, L., Clancy, N., Seabury, S.A., Overton, A., 2006.The National Flood Insurance Program's Market Penetration Rate. RAND Corporation.
Drukker, D.M., 2003.Testing for serial autocorrelation in linear panel-data models. Stata J. 3 (2), 168–177.
Ehrlich, I., Becker, G.S., 1972.Market insurance, self-insurance, and self protection. J. Polit. Econ. 80 (4), 623–648.
Finkelstein, A., McGarry, K., 2006.Multiple dimensions of private information: evidence from the long-term care insurance market. Am. Econ. Rev. 96 (4), 938–958.
Flavin, M., Yamashita, T., 2002.Owner-occupied housing and the composition of the household portfolio. Am. Econ. Rev. 92 (1), 345–362.
Fothergill, A., Maestas, E.G., Darlington, J.D., 1999.Race, ethnicity and disasters in the United States: a review of the literature. Disasters 23 (2), 156–173.
Kousky, C., 2010.Understanding the demand forflood insurance. Nat. Hazards Rev. 12 (2), 96–110.
Kriesel, W., Landry, C., 2004.Participation in the National Flood Insurance Program: an empirical analysis for coastal properties. J. Risk Insur. 71 (3), 405–420.
Kunreuther, H., Ginsberg, R., Miller, L., Sagi, P., Borkan, B., Katz, N., 1978.Disaster Insur-ance Protection: Public Policy Lessons. John Wiley & Sons, New York.
Kunreuther, H., Michel-Kerjan, E., 2015.Demand forfixed-price multi-year contracts: ex-perimental evidence from insurance decisions. J. Risk Uncertain. (in press).
Kunreuther, H.C., Michel-Kerjan, E.O., 2010.Market and government failure in insuring and mitigating natural catastrophes: how long-term contracts can help. In: Brown, Jeffrey R. (Ed.), Public Insurance and Private Markets. The AEI Press, Washington, pp. 115–142.
Landry, C.E., Jahan‐Parvar, M.R., 2011.Flood insurance coverage in the coastal zone. J. Risk Insur. 78 (2), 361–388.
Lindell, M.K., Hwang, S.N., 2008.Households' perceived personal risk and responses in a multihazard environment. Risk Anal. 28 (2), 539–556.
Michel-Kerjan, E., 2010.Catastrophe economics: the National Flood Insurance Program. J. Econ. Perspect. 24 (4), 165–186.
Michel-Kerjan, E., Kousky, C., 2010.Come rain or shine: evidence onflood insurance pur-chases in Florida. J. Risk Insur. 77 (2), 369–397.
Michel-Kerjan, E., Lemoyne de Forges, S., Kunreuther, H., 2012.Policy tenure under the U.S. National Flood Insurance Program. Risk Anal. 32 (4), 644–658.
Mossin, J., 1968.Aspects of rational insurance purchasing. J. Polit. Econ. 76 (4), 553–568.
NYC, 2013.PlaNYC: A Stronger More Resilient NYC. Mayor's Office of Long Term Planning and Sustainability, New York City (http://www.nyc.gov/html/sirr/html/report/report.shtml).
Palm, R., 1998.In: Kunreuther, Howard, Roth, Richard (Eds.), Demand for Disaster Insurance: Residential Coverage, Chapter 3 in Paying the Price: The Status and Role of Insurance against Natural Disasters in the United States. Joseph Henry Press, Washington, D.C.
Palm, R., 1996.Communicating to a diverse population. Presentation of Research Results at the Natural Hazards Workshop, Denver.
Perry, R.W., Mushkatel, A.H., 2008.Minority Citizens in Disasters. University of Georgia Press.
Petrolia, D.R., Landry, C.E., Coble, K.E., 2013.Risk preferences, risk perceptions, andflood insurance. Land Econ. 89 (2), 227–245.
Pidot, J., 2013.Deconstructing disaster. B.Y.U.L. Rev. 213, 243–254.
Pope, J.C., 2008.Do seller disclosures affect property values? Buyer information and the hedonic model. Land Econ. 84 (4), 551–572.
Riley Jr., W.B., Chow, K.V., 1992.Asset allocation and individual risk aversion. Financ. Anal. J. 48 (6), 32–37.
Seifert, I., Botzen, W.J.W., Kreibich, H., Aerts, J.C.J.H., 2013.Influence offlood risk charac-teristics onflood insurance demand: a comparison between Germany and the Netherlands. Nat. Hazards Earth Syst. Sci. 13 (7), 1691–1705.
Sung, J., Hanna, S., 1996.Factors related to risk tolerance. Financ. Couns. Plan. 7, 11–20.
Troy, A., Romm, J., 2004.Assessing the price effects offlood hazard disclosure under the California Natural Hazard Disclosure Law (AB 1195). J. Environ. Plan. Manag. 47 (1), 137–162.
Turner, R.H., Nigg, J.M., Paz, D.H., Young, B.S., 1980.Community Response to Earthquake Threat in Southern California. Institute for Social Science Research, University of California, Los Angeles.
Tversky, A., Kahneman, D., 1973.Availability: a heuristic for judging frequency and prob-ability. Cogn. Psychol. 5 (2), 207–232.
U.S. Census Bureau, 2010. State and County Quick Facts Derived from.http://quickfacts. census.gov/qfd/states/00000.html.
Vaughan, E., Nordenstam, B., 1991.The perception of environmental risks among ethni-cally diverse groups. J. Cross-Cult. Psychol. 22 (1), 29–60.
Wooldridge, J., 2002.Econometric Analysis of Cross Section and Panel Data. MIT Press.
Zahran, S., Weiler, S., Brody, S., Lindell, M., Highfield, W., 2009.Modeling nationalflood insurance policy holding at the county scale in Florida, 1999–2005. Ecol. Econ. 68 (10), 2627–2636.