Volume 2, Issue 7, July 2015, PP 102-110
ISSN 2349-4751 (Print) & ISSN 2349-476X (Online)
A 3D Motion Trajectory Signature Identification for
Human-Computer Interaction (HCI) Applications
N. F. Attia
Computer Engineering Department, Pharos University, Alexandria, Egypt
S. M. Youssef
Computer Engineering Department, University Arab Academy for Science and
Technology, Alexandria, Egypt [email protected]
S.M. Elkaffas
Computer Science Department, University Arab Academy for Science andTechnology, Alexandria, Egypt [email protected]
Abstract: Trajectory tracking is used to keep tracks objects. Trajectory tracking control is used to affect desired trajectories of a device, human and anything can move. In order to precisely track specified trajectories, or be able to follow more general trajectories, many tracking control algorithms have been proposed, but still there is some problems of tracking trajectory in its application. This paper introduces a new model for trajectory signature tracking that integrates the maximally stability extremal regions (MSER) feature extraction of first level transformed domain descriptors with K- nearest neighbour classifier. Experiments have been carried out on large datasets of tracking trajectories with different characteristics. MATLAB software version R2013a is used to implement and test the proposed method. Experimental Results showed that the proposed model produces satisfactory performance. Significant improvements have been illustrated in terms of recognition rate and recognition efficiency.
Keywords:Trajectory tracking, Motion trajectory, maximally stability extremal regions (MSER), K- Nearest neighbour classifier.
1.
I
NTRODUCTIONTrajectory tracking control means tracking reference trajectories predefined or given by path planners. It has been widely [17] studied and various effective methods and tracking controllers have been developed. Trajectory tracking, measuring the positions and lengths of the stationary points is also useful for perceiving the characteristics of the pause. Trajectory tracking is related to line simplification, on the one hand, and protocols for tracking an object’s current position, on the other hand. For clarity, we refer to the word as (real-time) position tracking [11]. This paper addresses the motion trajectory matching problem.
Trajectory based motion recognition is one of the most important objectives in motion characterization. The recognition mode, accuracy and efficiency are the three key factors related to the configurations of trajectory representation and recognition engine. Recognition modes can be categorized according to the initialization modes. Motion trajectory is a compact and robust clue for motion characterization and it has been extensively studied for describing actions, behaviors and activities in different applications. No matter for simple actions, median behaviors or complex activities, the consequent motions can be characterized by identifying the involved subjects (human body, head, hands, or feet) and extracting the underlying motion trajectories [1]. That is, motion can be analyzed spatio-temporally by the joint description of spatially parallel and/or temporally sequential motion trajectory compositions.
Motion trajectories are involved in many different situations where various requirements on motion characterization exist [20]. The basis to account for the different requirements lies in a flexible trajectory description. Raw trajectory data can be used directly. However, such a simple way of using the raw data is quite inflexible because it relies much on the absolute positions of the data points. Instead, building trajectory representations using some intrinsic properties would be a better way to capture the shape features of a trajectory and to avoid suffering from the constraints of absolute
coordinates. Furthermore, developing dynamic and adjustable trajectory representation structures (for example, changeable in size) can benefit the adaptability of trajectory descriptions.
Trajectory tracking has many applications in our life like, hand tracking, eye tracking, trajectory tracking of wheeled mobile application, motion tracking, etc.
Motion trajectories can be extracted by visual tracking from the motions of humans, robots or other moving objects. It might be a single trajectory tracked from an individual tracking point of interest, or a set of multiple, interrelated, concurrent trajectories extracted from a complicated motion. In fact, a large body of work about motion tracking can be found in the literature [1]. This research work just reasonably assumes that the motion trajectories have been extracted from motions.
This paper is organized as follows. Section two represents the background and related concepts; section three represents the related word; section four illustrates the proposed model; section five demonstrates the Excremental results; finally section six gives conclusion.
2.
B
ACKGROUND ANDR
ELATEDC
ONCEPTSThis section provides the main related concepts and key terms. 2.1.Signature-Based Trajectory Description
For a free form 3-D motion trajectory Γ (t) is parameterized by:[20] Γ (t) = {X (t), Y (t), Z (t) |t € [1, N]}
Where, t is temporal index and N is trajectory length. Its 3-D Euclidean signature S is defined in terms of differential invariants: curvature (κ), torsion (τ) and the first order derivatives with respect to Euclidean arc-length s (κs = dκ/ds and τs = dτ/ds), in the following form,[20]
S= {[κ (t), τ (t), κs(t), τs(t)]|t€[1,N]} (1)
In practice, an approximate signature S* was numerically implemented in terms of the joint Euclidean invariants (the inter-point Euclidean distances) [20]. This not only enhances the signature’s robustness by avoiding calculating the noise sensitive high order derivatives in the accurate signature, but also eliminates the requirement to the differentiability of the signature components. As the joint invariants are local features, the signature admits the computational locality that is the basis to deduce substantial descriptive invariants, and that makes the signature insensitive to occlusion. From the above definition, it is observed that the signature is based on the features extracted from all the sampled trajectory points. Hence it is a complete description to the entire raw trajectory data, which is able to capture and preserve most motion features. Thus the fitting inaccuracy is not a problem for the signature descriptor [12].
To ensure the existence of the signature mathematically, it is assumed that the trajectory denoted by Γ (t) is regular, say, for all t, Γ˙ (t) = 0. For the representation of irregular trajectories, the stationary points will be firstly detected by examining the condition of Γ (˙ t) = 0 and then the trajectory is regulated to be regular by removing the stationary points. Due to continuous tracking, this means leaving one and removing the extra points among a set of consecutively sampled points that admit stationary points. Accordingly, it is able to generate a single signature for the regulated trajectory. Meanwhile, the positions and length of the removed stationary points are saved for the later use for trajectory reconstruction [20].
2.2.Motion Trajectory Signature
Signature (trajectory) has two levels. While the first level is the full description to the entire raw trajectory data, the second level is the condensed description of the first level signature data [8]. First Level: Euclidean differential invariants features are employed to build a loose trajectory signature. As differential invariants are typical local features, they are not only capable of characterizing trajectory shapes, but also can offer richer invariants in trajectory representation with respect to rigid, metric and viewpoint change and insensitivity to occlusion. Focusing on the detailed motion features captured by the first-level signature, motion perception to different trajectory instances can be achieved readily via the visualization of the nonlinear inter-trajectory warping paths. The first-level signature is particularly appropriate for small scale application concerning both trajectory recognition and motion perception [8].
Second Level: Second level is motivated by reducing the redundancy data in the first-level signature to obtain a compact signature description towards faster trajectory recognition. Applying PCA transform to the first-level signature, we get the second-level signature with less data but preserving most variance of the trajectory features. Further, based on the Gaussian Mixture modelling to the second-level signature, a Bayesian classifier is developed to replace the time-consuming matching algorithm. These resorts can speed much up the recognition especially for larger scale database [8].
3.
R
ELATEDW
ORKHuman-Computer Interaction (HCI) is becoming more significant in the life. With the progress of computer science, the existing physical devices currently used in the interaction (e.g. keyboard, mouse,) are not satisfying human needs nowadays. Many designers attempt to improve the usability and make the interaction more natural and easier. They introduced the technique of Human-to-Human Interaction (HHI) into the domain of HCI to reach this purpose [10]. In this context, using hand gestures is among the richest HHI domain since everyone uses mainly hand gestures to explain ideas when he communicates with others [6].
Communication with hand gestures becomes important and much clearer with the consideration of sign language. Sign language (SL) is the natural way of communication among deaf persons. As letters and words in natural languages, we find the corresponding elements on sign languages, which are the movements, gestures, postures and facial expressions. Many researchers exploited hand gestures in other application fields such as hand tracking [2] and interactive computer graphics [3]. Similarly, several studies have focused on automatic sign language recognition so as to facilitate communication between hearing and deaf persons and to improve HCI usability [1] [2].
Several works in the domain of automatic sign language recognition have been interested in the manual information such as the trajectories of both hands. In order to recognize human gestures by motion information, many methods based on trajectories and motions have been proposed to analyze these gestures [4].
Bobick and Wilson adopted a state-based method for gestures recognizing [5]. They used a number of samples, for each gesture, to calculate its main curve. Each gesture sample point was mapped to the length of arc at curve. Afterword, they approximated the discretized curve using a uniform length in segments. They grouped the line segments into clusters, and to match the previously learning state of sequences and the current input state, they used the algorithm of Dynamic Time Warping.
For continuous ASL (American Sign Language recognition), Haynes and Jain (2010) used a view-based approach [9]. A language recognition application has been developed view-based on 3D continuous sign [14]. They used the Longest Common Subsequence method for sign language recognition instead of HMM (Hidden Markov Model), which is a costly double stochastic process.
A research on automatic recognition of sign language mainly focused on the domain of the dependent signer. A little work has been devoted to independent signer [10][13]. The sign language recognition systems based on independent signer have a promising trend in practical systems that can recognize a different signers SL. But the problem of the recognition of signer independent is hard to resolve regarding the great obstacle from different sign variations.
4.
P
ROPOSEDM
ODELFigure1 shows the proposed model. It has different phases including pre-processing, build component tree, arrange extremal regions, refining the selection and the last phase is recognition. This paper is uses the MSER for feature extraction with the first level of the signature with the advantage of using K-NN search with motion trajectory in recognition.
4.1.Raw Motion Trajectory
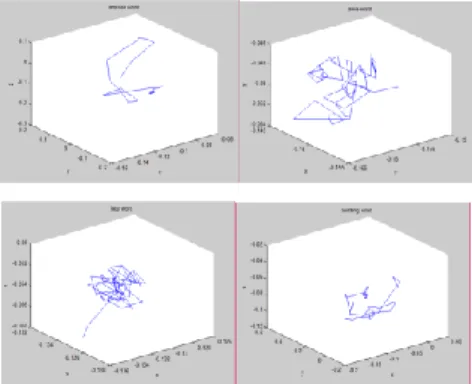
A larger trajectory dataset of UCI KDD high quality ASL is used to test the signature’s retrieval performance especially the improvement in efficiency benefitted from the second-level signature [18]. The ASL trajectory dataset consists of 95 sign classes, and 27 samples were captured for each sign. Figure 2 illustrates some trajectories from the dataset.
Fig2. Sign samples of some words
4.2.Pre-Processing
The raw motion trajectory is used to convert raw matrix to matrix contains values in range from (0 to 1), then deal with this numbers as from 0.0 (black) to 1.0 (full intensity or white).
4.3.Build Component Tree
It is the first phase in MSER. MSER a method for a blob detection in images[14][15], blob detection methods are aimed at detecting regions in a digital image that differ in properties, such as brightness or colour, compared to surrounding regions. Informally, a blob is a region of an image in which some properties are constant or approximately constant; all the points in a blob can be considered in some sense to be similar to each other. A method for a blob detection in images [14] [15].
Blob detection methods are aimed at detecting regions in a digital image that differ in properties, such as brightness or colour, compared to surrounding regions. Informally, a blob is a region of an image in which some properties are constant or approximately constant; all the points in a blob can be considered in some sense to be similar to each other.
This method of extracting a comprehensive number of corresponding image elements contributes to the wide-baseline matching, and it has led to better stereo matching and object recognition algorithms MSER is a feature detector; Like the SIFT detector , the MSER algorithm extracts from an image I a number of co-variant regions, called MSERs. An MSER is a stable connected component of some level sets of the image I. optionally; elliptical frames are attached to the MSERs by fitting ellipses to the regions; for a more in-depth explanation of the MSER detector.
A stable region has a small variation. The algorithm finds regions which are "maximally stable", meaning that they have a lower variation than the regions one level below or above. Note that due to the discrete nature of the image, the region below or above may be coincident with the actual region, in which case the region is still deemed maximal.
In general, an extremal region is a set of pixels connected by their 4-neighbors that satisfy the property that all of their intensities are uniformly greater or less than the intensities of every pixel that surrounds the region. An extremal region is maximally stable if given intensity i and a margin ∆, the change in the number of pixels in the region from i − ∆ to i + ∆ is a local minimum. A large value for ∆ will generate only a few highly stable regions, while a smaller value will detect many less-stable regions. The advantage of a small delta value is that more regions will be detected which allows more invariant information to be extracted from an image [16].
Component tree is a representation of a gray-level image that contains information about each image component and the links that exist between components at sequential gray-levels in the image, all pixels are arranged by their intensity and neighborhood relationship. Every child tree is corresponding to a region, and the root of the child tree is the index of the pixel that has the biggest value in the region.
4.4.Arrange the Extremal Regions
It the second stage in MSER. Extremal regions are the nodes whose parent nodes have a bigger value. Arrange the extremal regions in a tree of nested regions, as shown in Figure 3. Connecting two regions R_l and R_l+1, if and only if Rl R
R Rm in ,..., R ,R 1,..., Rm ax
B l l (2)
Fig3. Extremal regions are arranged in a tree of nested regions [19] Rl Rl Rl Rl
B , 1,..., , the stability score is: [19]
l l l l R R R R v (3)
Select the maximally stable region in the branch B Rl Rl,Rl1,..., Rl, which has a local minimal stability score is
If v Rl <
v (Rl1), mark Rl1 as unstable
If v Rl > v (Rl1), mark Rl as unstable
Otherwise, do nothing 4.5.Refining the Selection
It is the last stage in Maximally Stable Extremal Region (MSER).In this stage we finalize the Maximally Stable Extremal Region algorithm by:
Remove very small and very big regions
Remove regions which have too high area variation
Remove duplicated regions 4.6.Recognition
In the this phase K-NN classifier is used to find the distance between the regions orientation , the most close signs gives us lower distance than others , the next tables shows some orientation distances to show the accuracy of the proposed model. The k-Nearest Neighbours algorithm is a non-parametric method used for classification and regression. In both cases, the input consists of the k closest training examples in the feature space. The output depends on whether k-NN is used for classification or regression. In k-NN classification, the output is a class membership. An object is classified by a majority vote of its neighbors, with the object being assigned to the class most common among its k nearest neighbors (k is a positive integer, typically small). If k = 1, then the object is simply assigned to the class of that single nearest neighbour. In k-NN regression, the output is the property value for the object. This value is the average of the values of its k nearest neighbours [7].
KNN for classification, in this case, we are given some data points for training and also a new unlabeled data for testing. Our aim is to find the class label for the new point. The algorithm has different behavior based on k, for example: k = 1, this is the simplest scenario. Let x be the point to be labeled. Find the point closest to x. Let it be y. Now nearest neighbor rule asks to assign the label to x. This seems too simplistic and sometimes even counter intuitive.
5.
E
XPERIMENTALW
ORKA larger trajectory dataset of UCI KDD high quality ASL [18] is used to test the trajectory recognition performance in terms of two important measurements: accuracy and efficiency. The ASL trajectory
dataset consists of 95 sign classes (words), and 27 samples were captured for each sign. We used half the samples for training and the other half for testing. Several classes of samples were randomly selected and recognized in our proposed method. Moreover, different results from the scheme have been compared with results of other algorithms in [8] [20].
Problem
Find the most stable region from motion trajectory. Solution
Motion trajectory are set of positions ((x1,y1,z1),(x2,y2,z3),………..(xn,yn,zn)).
Convert the matrix of location to gray scale matrix, smallest reflect black pixels, largest reflect white pixels.
Then represent the gray scale matrix as a gray scale image as shown in Figure 4 and compute all previous steps showed in 4.3, 4.4 and 4.5 to extract the MSER region from the motion trajectory.
(a)Sign sample of a alive word (b) Alive word as an intensity image
Fig4. Sign sample with its corresponding intensities levels
5.1.Test and Validation
We apply some cases as a small example belong to small database to meet our used experiment, in this example the database contains a sign samples from two classes (alive, answer) for example, each class contain 3 signs.
5.1.1.Case One
The test sign is from one of these samples from the database to check validation using the word alive, sign number three.
Table1. Distances between Train Words and Test Word for Case One
Class one (Answer ) Class two (Alive) answer-1 & alive-3 answer-2 & alive-3 answer-3 & alive-3 Alive-1 & alive-3 Alive-2 & alive-3 Alive-3 & alive-3 0.0021 0 0 0.0049 0 0 0.0021 0 0 0.0049 0 0 0.0008 0.0006 0.0002 0.0004 0.0004 0 0.0027 0.0038 0.0042 0.0112 0.0093 0 0.0012 0.0002 0.0002 0 0 0
5.1.2.Case Two
The test sign is from one of these samples from the database to also check validation using the word answer sign number two.
Table2. Distances between Train Words and Test Word for Case Two
Class one (Answer ) Class two (Alive) answer-1 & answer-2 answer-2& answer-2 answer-3 & answer-2 Alive-1 & answer-2 Alive-2& answer-2 Alive-3& answer-2 0.014 0 0.0004 0.0226 0.0207 0.0113 0.0002 0 0.0013 0.0015 0.0004 0.001 0.0013 0 0.0004 0.0002 0.0002 0.0002 0.0011 0 0.0004 0.0074 0.0055 0.0038 0.0007 0 0.0029 0.0031 0.0012 0.0026 0.0021 0 0 0.0049 0 0
Fig6. The distance between train sample classes and a test class sample that describe Table 2
5.1.3.Case Three
The test sign is a sign belongs to the classes but not in the database to check verification, the test sign is belongs to class two.
Table3. Distances between Train Words and Test Word for Case Three
Class one (Answer ) Class two (Alive)
answer-1 & alive answer-2& alive answer-3 & alive Alive-1 & alive Alive-2& alive Alive-3& alive
0.01 0.0121 0.0121 0.0071 0.009 0.0121
0.0006 0.0007 0.0007 0.0009 0.0009 0.0003
0.0059 0.008 0.008 0.0031 0.0049 0.008
Fig7. The distance between train sample classes and a test class sample that describe Table 3, the recognized class is class number two , and specilally is recognized to alive-1class
5.1.4.Case Four
The test sign is a sign not belongs to any class in the database to check verification, the test sign is belongs to class (word) eat.
Table4. Distances between Train Words and Test Word for Case Four
Class one (Answer ) Class two (Alive)
answer-1 & eat answer-2& eat answer-3 & eat Alive-1 & eat Alive-2& eat Alive-3& eat
0.0003 0.0005 0.0019 0.0021 0.0002 0.0015
0.0028 0.0017 0.0013 0.0057 0.0038 0.0051
The output of the previous case is that class is not recognized to any class becouse it doesnot match our verification test .The proposed model achive 100 % for validation and it has a high accuracy with respect to algorithm in [8][20] that shown in Table 5 , and it has a higher efficiency (in terms of query time) , as the classes number increases, the efficiency decreases much slower as shown in Table 6.The proposed model behaves generally better on both accuracy and efficiency with respect to previous algorithms in [8][20].
Table5. Average Ratio of Correct Recognition
Class No 2 4 8
Proposed model 97% 95% 92% The second-level signature[8] 92.38% 86.17% 78.66% Full signature based GMM and Bayesian recognition[21] 92.73% 88.58% 83.02% Full signature and DTW matching [21] 90.03% 87.52% 91.19%
Table6. Recognition Efficiency Comparison (Units MS/Query)
Class No 2 4 8
Proposed model 62 124 248 The second level signature [ 8 ] 139 146 158 Full signature based GMM and Bayesian recognition[20] 163 187 191 Full signature and DTW matching [20] 730 1245 2286
6.
C
ONCLUSIONThis paper presented a new method for 3D motion trajectory that integrates the maximally stability extremal regions (MSER) feature extraction of first level transformed for main descriptors with K- nearest neighbour classifier. The proposed model achieves efficient and high recognition accuracy compared with previous algorithms.
R
EFERENCES[1] Vogler, “C.P.: American Sign Language recognition reducing the complexity of the task with phoneme-based modeling and parallel hidden markov models”. PhD thesis, University of Pennsylvania, Philadelphia, PA, USA. Supervisor-Dimitris N. Metaxas, 2003.
[2] Lefebvre-Albaret, F., “Automatic processing of videos FSL: Modeling and operating phonological constraints of movement” PhD thesis, University of Toulouse III - Paul Sabatier, 2010.
[3] Freeman, W.T., Anderson, D., Beardsley, P., Dodge, C., Kage, H., Kyuma, K., Miyake, Y. “Computer vision for interactive computer graphics, in Proc. IEEE Computer Graphics and Applications, May-June, 1998, pp. 42-53.
[4] Johansson,” G.”A Visual Perception of Biological Motion and a Model for Its Analysis, Perception and Psychophysics”, vol. 73, no. 2, 1973, pp. 201-211.
[5] Bobick, A.F., Wilson, A.D. “A State-Based Approach to the Representation and Recognition of Gesture”, in ptoc. IEEE Trans. Pattern Analysis and Machine Intelligence, Dec. 1997, vol. 19, no. 12, pp. 1325-1337.
[6] Vogler, C., Metaxas, D. ”A ASL Recognition Based on a Coupling between HMMs and 3D Motion Analysis”, in Proc. Sixth IEEE Int’l Conf. Computer Vision, 1998,pp. 363- 369.
[7] Sitong Liu, Jianhua Feng, Yongwei Wu ,” Region-aware Top-k Similarity Search”, Lecture Notes in Computer Science Berlin, Germany: Springer Volume 9098, 2015, pp. 387-399.
[8] Shandong Wu, Y. F. Li and Jianwei Zhang,” A Hierarchical Motion Trajectory Signature Descriptor,” in Proc. IEEE International Conference on Robotics and Automation, 2008 , pp.3070-3075.
[9] Haynes, S., Jain, R.,” A Detection of Moving Edges”, Computer Vision, Graphics, and Image Understanding, vol. 21, no. 3, pp. 345- 367, 1980
[10] Maher Jebali, Patrice Dalle, Mohamed Jemni,” Extension of hidden markov model for recognizing large vocabulary of sign language”, International Journal of Artificial Intelligence & Applications, Vol. 4 Issue 2, p35, Mar2013.
[11] Ralph Lange, Frank D¨urr , Kurt Rothermel,” Efficient Real-Time Trajectory Tracking”, VLDB Journal, Vol.20,pp. 641–642, 2011.
[12] S. D. Wu, Y. F. Li and J. W. Zhang, ”Signature descriptor for free form trajectory modeling,” in Proc. IEEE International Conference on Integration Technology, Shenzhen, China, 2007, pp. 167-172.
[13] Liang, R.H., Ming, O.” A Sign Language Recognition System Using Hidden Markov Model and Context Sensitive Search”, in Proc. of ACM Symposium on Virtual Reality Software and Technology, 1996, pp.59-66.
[14] Jaballah, K., Jemni,M. , Toward Automatic Sign Language Recognition fromWeb3D Based Scenes, ICCHP, Lecture Notes in Computer Science Berlin, Germany: Springer,vol.6190, July 2010.
[15] Zaman Khan, R., Adnan Ibraheem , N., “Hand Gesture Recognition: A Literature Review”, International Journal of Artificial Intelligence & Applications (IJAIA), Vol.3, No.4,pp.161-174, July 2012.
[16] J. Matas, O. Chum, M. Urban, and T. Pajdla. “Robust wide baseline stereo from maximally stable extremal regions”, In 13th BMVC, September 2002, pages 384–393.
[17] Razvan Solea , Urbano Nunes, “Trajectory Planning and Sliding-Mode Control Based Trajectory-Tracking for Cybercars”, Integrated Computer-aided Engineering, Int. Journal, IOS Press, vol.14, n.1, pp.33-47, 2007.
[18] UCI KDD ASL Archive, [Online], Available: http://kdd.ics.uci.edu/databases/auslan2/auslan. html. Last accessed on 29/6/2015.
[19] Marc O’Malley Hussein Al Hadad, “Automatic Registration of Large Images from Light Microscopy”, M.E. thesis, Lund University Faculty of Engineering.
[20] Shandong Wu and Y.F. Li, "Flexible Signature Descriptions for Adaptive Motion Trajectory Representation, Perception and Recognition," Pattern Recognition, vol. 42, no. 1, pp. 194-214, Jan. 2009.
A
UTHORS’
B
IOGRAPHYNehal Fathi is a teaching assistant in the department of Computer Engineering, Pharos University, Alexandria. Egypt. She received her B.Sc. degree in Computer Engineering from Arab Academy for Science and Technology in 2010.
Sherin M. Youssef, Professor, head of computer Engineering Department. She obtained her Ph.D., Mphill from University of Nottingham, UK (2004) in the field of Intelligent Systems, and M.Sc. from University of Alexandria (1996) in Machine Learning & Pattern Analysis. Her research interest lies in the field of signal processing, video/image processing, image coding, intelligent systems, signal compression, Biomedical Engineering, Biometrics, QoS intelligent networks, Machine learning, Genetic algorithms, Neuro-based systems, Swarm Intelligence, and Multimedia systems.
Saleh Mesbah Elkaffas, Associate Professor at the Dept. of IS, College of Computing & IT, Arab Academy for Science, Technology & Maritime Transport (AASTMT). He is currently the director of the Remote Sensing & Spatial Studies Unit, AASTMT. He received his B.Sc. in Electronics & Telecommunications Engineering, M.Sc. and Ph.D. from Alexandria Univ. His research interests include digital image processing, satellite remote sensing, geographic information systems (GIS) and environmental studies.