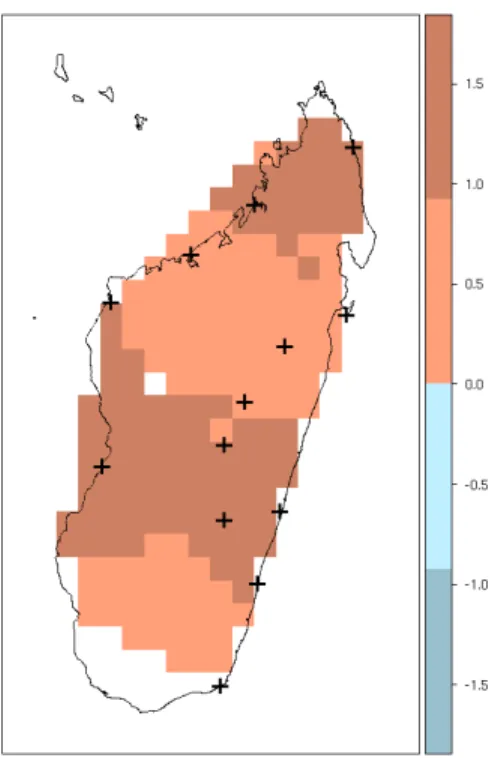
Climate change in Madagascar; recent past and future
Full text
Figure


Related documents
When its dark, the sensor looks like an large resistor up to 10MΩ, as the light level increases, the.. resistance
Chrysanthemum [8,9], ii) the antioxidant enzyme activities and lipid peroxidation of Dendrobium candidum [10], iii) the stimulation on the secondary structure of plasma
The objectives of the Bank’s foreign exchange regulation and foreign exchange control were as follows: reducing the imbalance of resident for- eign currency accounts on current
Given a set of reviews, the tasks of senti- ment analysis in ReNew are (1) splitting each re- view into segments, (2) associating each segment with a sentiment label (positive,
EXISTING GUARDPOST EXISTING GUY WIRE EXISTING LIGHT POLE EXISTING WATER MANHOLE EXISTING STORM MANHOLE. EXISTING TELEPHONE PEDESTAL EXISTING
Dominican Republic-Punta Cana Grand Palladium Palace Resort Spa & Casino Dominican Republic-Punta Cana Grand Palladium Punta Cana Resort & Spa Dominican Republic-Punta
Chapter 7 Employers and worker representatives’ perceptions regarding good practice health and safety measures for older workers (interview study)
