Visualizing Object-Oriented Software in Virtual Reality
Jonathan I. Maletic
1, Jason Leigh
2, Andrian Marcus
1,
and Greg Dunlap
11
Division of Computer Science
2Electronic Visualization Laboratory
The Department of Mathematical Sciences
University of Illinois at Chicago
The University of Memphis
MC154, 1120SEO, Dept. EECS
Campus Box 523240
851 S. Morgan St.
Memphis TN 38152-3240
Chicago IL 60607
[email protected], [email protected], [email protected], [email protected]
Abstract
The paper describes a system, Imsovision, for visualizing object-oriented software in a Virtual Reality Environment. A visualization language (COOL) is defined that maps C++ source code to a visual representation. Our aim is to develop a language with few metaphors and constructs, but with the ability to represent a variety of elements with no ambiguity or loss of meaning. In addition, the visualization has to maximally use the potential of the used media. The design of the OO software system and its attributes are represented in the visualization. Class information, relationships between classes, and metric information is displayed. VRML is used for the visualization and it is rendered in the CAVE environment.
1. Introduction
Visual representations, both simple and complex, are important for the comprehension and development of large software systems. Notations such as UML are becoming widely popular for the simple fact that they are visual in nature and support quick understanding of long natural language (or source code) passages. While these types of notations allow for an abstraction of an existing software system, they do not scale up well with respect to comprehension. That is, it is quite difficult to “see” an entire software system with these notations. They suffer from the same cognitive related problems as source code.
The work here presents a software visualization system that represents object-oriented software in a virtual reality environment. The work is motivated by some of the recent advances in the field of information visualization. Our goal is to develop visualization tools that assist software developers and maintainers to comprehend software systems.
1.1. Background
Software visualization is the graphical display of information about a software system. Software structure, runtime behavior, and the code itself are properties of software that is visualized. While there have been many software visualization efforts, these have been limited in both scope and application because the amount of information to be included is far larger than can be displayed. Visualization tools and environments display information at various degrees of abstraction, from the statement level to architecture of the system level. Many of the existing software visualization systems concentrate on program/algorithm animation and graph-based visualization of static and dynamic relations between software components. In addition, these tools concentrate on representing various aspects of the source code (e.g., control flow, data flow, layout). In general, they are not concerned with design and architecture aspects. A good review of existing software visualization tools is presented in [10].
Practical software visualization must provide tools to select and display just the information of interest. It must provide a quality visual display that is intuitive, has a powerful abstraction capacity, and avoids information (cognitive) overload. A practical software visualization system can be achieved by focusing on abstractions.
In general, a software visualization system should determine the abstraction level of the information it depicts about the software system. It should use a visual language or mapping to translate source code (and possibly external documentation) into a visual representation. The semantics of the language should be unambiguous, natural, and learnable by the user. The choice of mapping depends on the type of information it represents and the media used in the representation. The user tasks (i.e., manipulation, navigation, etc.) that the system supports, including program comprehension tasks, should be specified.
Since our system takes advantage of virtual reality (VR), we now describe the differences between VR and 2D/3D display models.
1.2. Virtual Reality versus 3D and 2D
One has to make distinction between 3D and VR. A user immersed in a Virtual Reality Environment (VE) can always access external information (e.g., the actual source code) without leaving the environment and the context of the representation (e.g., using a palmtop or laptop).
While both representations offer the perception of depth, only VEs allow the user to immerse oneself into the representation. Also, this immersion allows the user to take advantage of their stereoscopic vision. Stereopsis can be a great benefit in disambiguating complex abstract representations. It also helps the viewer to judge relative size of objects and distances between objects. In 3D, you have to move the view around to understand the diagram.
The work of Hubona, Shirah and Fout [11] suggests that users' understanding of a 3D structure improves when they can manipulate the structure. One of the defining features of VR representations is the ability of the user to manipulate the visualization, by being immersed in the environment. The work of Ware and Franck [24] indicates that displaying data in three dimensions instead of two can make it easier for users to understand the data. In addition the error rate in identifying routes in 3D graphs is much smaller than 2D [23, 26]. They also show that motion cues combined with stereo viewing can substantially increase the size of the graph that can be perceived [25]. VR combines stereopsis and motion. The CyberNet system [8] shows that mapping large amount of (dynamic) information to 3D representation is beneficial, regardless of the type of metaphors (real or virtual) used. CyberNet is used to map network services and workstation information to a city landscape metaphor or to a solar system metaphor, and geographical data to a building metaphor. Real-life based metaphors have advantages (using preexisting knowledge) but also disadvantages (information overload and natural limitations).
2. Imsovision
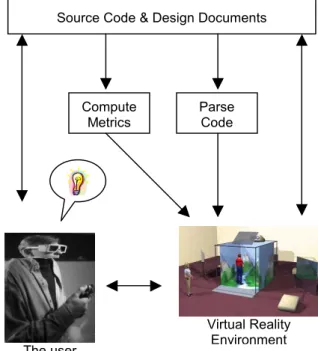
Imsovision (IMmersive SOftware VISualizatION) is a system that supports program understanding and development through software visualization (see figure 1). It uses a VE as the medium for visualization. Thus, it makes use of all the special features of such environments (e.g., 3D navigation, collaborative problem solving, etc.).
Also, it uses a specially designed visualization language that maps source code into the VE. This language, COOL, (Language for Comprehending OO software) incorporates some of the features of UML and
allows for a natural representation of certain source code level complexity metrics. COOL maps heterogeneous data (classes, entities, relationships, and quantitative information) to the visual metaphors. Metric information, in this case, lines of code measures, is also incorporated into the visualization. The size of the visual objects represents the physical (or metric) sizes of the entities they correspond to in the source code.
Currently, we do a large part of the mapping from source code and documentation to VRML manually, though some steps are partially automated. We are currently constructing an automatic translation system that given source code, generates the VRML source for the visualization.
The remainder of this section describes the details of our mapping language and the underlying concepts we used in its design. The current features of Imsovision are also described.
2.1. Mapping raw data to visualization
Mackinlay [18] defined two criteria to evaluate the mapping of data to a visual metaphor: expressiveness and effectiveness. These criteria were used in 2D mappings, but can also be applied for 3D mappings.
Expressiveness refers to the capability of the metaphor of visually representing all the information we desire to visualize. For instance, if the number of visual parameters available in the metaphor for displaying information is fewer than the number of data values we
Virtual Reality Environment
Figure 1. Architecture of Imsovision
Source Code & Design Documents
Compute Metrics
Parse Code
wish to visualize, the metaphor will not be able to meet the expressiveness criterion.
The relationship between data values and visual parameters has to be a univocal relationship; otherwise, if more than one data value is mapped onto the same visual parameter, and then it will be impossible to distinguish one value’s influence from the other. On the other hand, there can always be visual parameters that are not used to map information, as long as there is no need for them to be utilized.
The second criterion, effectiveness, relates to the efficacy of the metaphor as a means of representing the information. Along the effectiveness dimension we can further distinguish several criteria: effectiveness regarding the information passing as visually perceived, regarding aesthetic concerns, regarding optimization (e.g., number of polygons needed to render the world).
In the case of quantitative data, not only the number of visual parameters has to be sufficient to map all the data, but also, they must be able to map the right data (i.e., there are visual parameters that are not able to map a specific category of data; for instance, shape is not useful for mapping quantitative data, while the size of a metaphor is).
The second criterion is, as in the case above, the one of effectiveness. This criterion implies the categorization of the visual parameters according to its capabilities of encoding the different types of information. Moreover, this also implies categorizing the information according to its importance so that information that is more important can be encoded more efficiently when options must be taken. This categorization of the importance of the information has two expressions: one is an assigned importance of the information in the context of a software system; the other is a preference of the user. Nonetheless, the user may choose to override this and define his own importance of the data, according to his priorities when visualizing a software system. For example, COOL gives preference by default to the public members of a class, versus the private ones.
In order to satisfy these criteria for the mapping, one must have a solid data characterization. Data characterization is usually the first step to understand a phenomenon or system. Developing a taxonomy helps to make sense of large amounts of information. This is why COOL is based on the UML as it is well known and widely used in the software community.
Although these characteristics of data apply mostly to data visualization, they must be taken into consideration in software visualization as well. The metaphors of COOL are designed such that they maximize the amount of data that can be represented with an accent on the user’s information seeking goals.
The power of a visualization language is derived from its semantic richness, simplicity, and level of abstraction.
Our aim is to develop a language with few metaphors and constructs, but with the ability to represent a variety of elements with no ambiguity or loss of meaning. In addition, the visualization has to maximally use the potential of the used media. Therefore, a good VR representation will make use of all the navigation possibilities in a 3D landscape and the fact that the user is immersed in the environment, while maintaining a natural feeling of the representation, and avoiding the information overload.
An important aspect to be considered in defining a visual language is the nature of its users. Our language is designed for use by software developers with solid knowledge of programming, program designs, and system architecture; also, they must possess a reasonable ability to abstract. Therefore, the metaphors in the language should be simple, having a familiar form and straightforward mapping to the source code.
The media type for the visual representation is also an important factor to consider. In the case of VEs, there is often a trade-off between levels of detail (i.e., resolution, accuracy) and speed of navigation and/or the ability to support collaborative work (i.e., network of two or more VEs). We consider of primary importance the easy and fast navigation ability, and the support for collaborative work. If the metaphors are carefully chosen, the lack of detail and accuracy of representation causes aesthetic discomfort rather than loss of information and meaning. Existing visualizations often lack in one or more of these areas. They are either too complex to navigate, learn, or they lose essential information by abstracting too much.
2.2. Visualizing object-oriented software
To view software systems in VR we have developed a visual representation language. Version 1.0 of COOL is summarized in tables 1 and 2. This language defines a formal mapping from an Object Oriented language, such as C++ or Java, to a visualization in VR. Currently, the language only supports syntactic and other static features of a program. We plan to incorporate semantic and dynamic information in future versions of the representation language. But, along with visualizing the syntactic constructs of the program, metric information, that gives clues to code complexity, is also represented in the display language.
The basic construct in an OO language is the class; this is realized as a platform in our visualizations. Platform size is proportional to the size of the class (i.e., number of methods and attributes). Thus, the platform size gives an overall visual measure of the complexity of the class (in a particular dimension). Attributes of a class are viewed as spheres and member functions viewed as columns. The height or size represents either lines of code or memory size, respectively.
The different types of member functions are also color-coded, white for constructors, green for accessors, and purple for modifiers. The placement of the different types of member functions reflect their usage, constructors are grouped in the center, accessors are placed around these, and modifiers are placed on the outer edges of the class platform. The coloring and placement support quick identification of the different concepts.
Table 1. Depicting entities in COOL. The size of the entities reflects a metric size value.
Name Visualization Meaning
Platform Class Platform Size Number of methods plus the number of attributes Sphere Attribute
Sphere Size Attribute Type of
White Column
Constructor Member Function
Green Column Accessor Member Function
Purple Column Member Modifier Function Column Size Logical Lines of Code per Method Sphere/ Column Location Information Hiding
To depict information hiding (public versus private), private items are positioned on the bottom side of the class (platform). This type of natural representation reduces the cognitive overhead of the visualization. We are also experimenting with using semi-transparent class platforms. This allows one to see the private items and also get a feel of what is directly below the class in the overall landscape.
Table 2. Depicting relationships in COOL.
Name Visualization Meaning
Adjacency with
Shading Inheritance
Yellow Stacks Overloaded Element
Aqua Flat Link Dependency Relationship
White Flat Link Aggregation Relationship
Relationships between classes are visualized in a simple and natural manner. Class adjacency represents inheritance. We view this as analogous to a metropolitan area. There is a main city (Chicago) surrounded by a number of suburbs (Evanston, Oak Park). The main city is analogous to a base class and the suburbs are much like derived classes. The shading of the derived classes is lighter in color then the base class. Multiple-inheritance is simply represented by having a derived class adjacent to more then one base class, much like there are suburbs that are adjacent to both St. Paul and Minneapolis.
Overloaded attributes and member functions have a yellow top. This allows for quick inspection of the amount of overloading done in a derived class. Aggregation is represented as an aqua link, and dependency is a white link, analogous to roads between cities.
COOL is a multi-layered visualization language. The first layer of abstraction is based on the idea of a class diagram. Platforms represent classes, and links and adjacency represent relationships between the classes. This level is based directly on UML notation. The second layer of abstraction is based on the metrics of size and
lines of code per function. The final level of abstraction, dealing with functions, is the ability to drill down into the source code from the visualization.
2.3. Navigation
In Imsovision, the visualizations are marked up in VRML 1.0 [4], and therefore take advantage of the navigation functionality that is incorporated into the particular VE that renders the VRML source.
Imsovision is designed to use the CAVE (originally in [7] and more recently described in [17]) as the primary representation medium. The CAVE is a virtual reality system where the display is a 10 foot-cubed room that is rear-projected with stereoscopic images, creating the illusion that 3D objects appear to co-exist with the user in the room. A user dons a pair of lightweight liquid crystal shutter glasses to resolve the stereoscopic imagery, and holds a three-button ‘wand’ for three-dimensional interaction with the virtual environment. An electromagnetic tracking system attached to the shutter glasses and the wand allows the CAVE to determine the location and orientation of the user's head and hand at any given moment in time. This information is used to instruct the graphic drivers of the CAVE to render the imagery from the point of view of the viewer. This way, the user can physically walk around an object that appears to exist in 3D in the middle of the CAVE. If the viewer wants to look behind a virtual object, he walks around to the back. If the viewer wants to look under an object in the CAVE, they crouch down and physically look under the virtual object. The wand contains three buttons and a joystick that can be programmed for different features depending on the application. Typically, the joystick is used to navigate through environments that are larger than the CAVE itself, such as in architectural walk-throughs. The buttons can be used to change modes, or bring up menus in the CAVE, or to ‘grab’ a virtual object.
A `fish tank' desktop system [1] would probably be the best alternative for those wanting a currently affordable hardware platform, allowing the user to see stereoscopic images using a computer monitor and stereo shutter glasses.
However, since the visualization is written using VRML, a simple desktop computer can also be used as a low-cost, non-immersive alternative to the CAVE. There are a number of exiting VRML viewers that can be utilized, such as Cosmo Player [6]. Such viewers are very easy to use and come as plug-ins to existing html browsers or as stand-alone applications. They offer a set of easy-to-use navigation tools. Table 3 gives a summary
of these navigation tools. These tools allow the user to move in different directions (X, Y, and Z).
Table 3. Navigation functions in VRML viewer.
Name Function
Go Move forward in z direction Slide Move in the xy plane
Tilt Tilts the world Rotate Rotates world in any direction
Zoom Allows zooming to a particular position Pan Change position of the world Seek Select and zoom to one item
By using these navigation tools that are inherent to VEs that support VRML, we have complete navigation inside the visualization. We can move into, back away form, and turn left or right inside the world. We can also move up or down, but more than that we can move the world while keeping ourselves stationary, thus allowing us to look at the private attributes of a system, and simply move the mouse or wand to look at the public features of the software system. Thus, the system allows us full freedom of movement inside the virtual world. The user can explore the subsystems that make up the complete system, look at the system from different angles, and find aspects of the system that would be hidden in a UML or source code representation. Also, if the user gets disoriented while traveling through the world, there are a number of fixed camera positions that allow the user to go to known positions in the world.
An immersive VE such as the CAVE offers even more flexibility in navigation. If the user navigates through the visualization, he/she can always look back or around to see the part of the visualization that was traversed. With the desktop viewer, the traversed part of the visualization practically disappears from the perspective of the user.
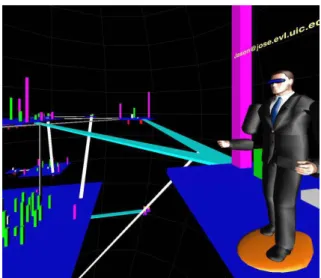
It is common to have several people standing in the CAVE at the same time. While only one person has the correct stereo viewpoint and the ability to interact with the environment, the other viewers can still see the virtual world in 3D. In software development, collaboration and teamwork are essential for the success of a project. All of us have found that the ability to talk with co-workers who are standing next to you is very important, and since the CAVE does not isolate the user from the real world, it is convenient to have these interactions. Current research on tele-immersion [17], focuses on making remote collaboration just as easy, or even better than standing next to your collaborator. It allows each user to stand within the shared virtual environment seeing a view of that environment that is customized to their interests and experience (see figure 2).
Figure 2. A remote user immersed in the VE investigating a visualization of a software
system.
2.4. Support for user tasks
When creating an information visualization application, it is important to identify primary tasks before choosing an information visualization language [27].
Our task analysis is based on Shneiderman [19], who presents seven high level tasks that an information visualization application should support. For evaluation purposes, we must refine these into lower-level tasks as done by Wiss, Carr, and Jonsson [27].
Overview: Gain an overview of the entire collection of data that is represented. This is in fact one of the strong features of COOL. It allows an overview of the entire software system that is represented because it makes use of all the dimensions in the VE. Its abstraction power allows making better use of space than UML, for example. The VE practically offers to the user unlimited space for visualization. The lack of details on the metaphors also is a feature that permits the user to zoom out and see the entire system in a single view (see figure 4).
Zoom: Zoom in on items of interest. The VRML viewer has zoom in and zoom out features, which allow the user to see any part of the system in detail (see figure 6). The seek function also allows selection of a single item in the visualization, and the system automatically zooms in to that element. In addition, the user can navigate through the visualization from one part of the system to another at any zoom level. When zooming, it is important that global context can be retained. Because in the VE the user is immersed into the visualization and he/she can look in any direction (up, down, back, and forward) the global context is not lost. The VRML browser allows for definition of fixed views of the entire
(or parts) of the visualizations. When zooming in on a part of the system, it takes just one click to zoom out and have the global view.
Filter: Filter out uninteresting items. Filtering by removing parts of the visualization will necessarily disturb the global context. Therefore, it is important to see whether the design supports some kind of abstraction of the removed parts. At this point COOL does not directly support filtering. However, the design of COOL is such that it emphasizes the most accessed features (e.g., public attributes and methods) by placing them in the most natural positions on the visualization (e.g., on the upper part of the platforms). The less accessed elements (e.g., private attributes and methods) are placed in less natural places (e.g., under the platforms). The navigation power of the VE allows the user to switch the natural orientation of the visualization, thus at any time, change a less natural positioning into a more natural. Since the size of the visual elements directly reflect some measure of the complexity of the represented objects, the larger ones will thus emphasize the most complex elements.
Details-on-demand: Select an item or group and get details when needed. Getting details on a selected item is usually implemented by the embedding application. As mentioned before, the detail representation is of less importance in COOL, priority was given to easy and fast navigation and rendering. The visual metaphors are designed such that there is no loss of meaning while zooming in or out. In its current version, COOL supports two types of detail-on-demand features. By placing the cursor over a method that overloads another one in a parent class, the overloaded method is highlighted. Maintaining a constant link between these types of item pairs would make the visualization too complex.
In addition, by right clicking on the mouse, we can open up, in a new window, the source code that is behind the visualization. This allows the user to look through the software system and find the parts they want to look at and when they comprehend the functionality of the system, they can go and look at the source code directly. Also, if a user activates (by clicking a mouse button) the overloaded function (denoted by yellow) it will change color, and the function that it overloaded will also highlight letting the user map the overloaded function to its parent function.
Relate: View relationships among items. For a hierarchical data structure, it is necessary that the visualization show parent-child relationships. This is one of the most important features of COOL. Currently, COOL supports three kinds of static relationships between classes (i.e., dependency, aggregation, inheritance - see table 2) and overloading between methods.
History: Keep a history of actions to support undo, replay, and progressive refinement. A visitation path
should be supported. The VRML viewer allows for definitions of viewpoints. That is a set of attributes, which describe the position of the camera, the light, and the zoom level. These viewpoints can be saved and reviewed. A sequence of such viewpoints can be played, thus representing a path within the visualization, which could represent the history.
Extract: Allow extraction of sub-collections and of query parameters. This task concerns saving the current state of the visualization. This is related only to the application and the underlying data set. How the data is visualized does not affect this. The extract task is therefore excluded from our evaluation.
3. An example visualization
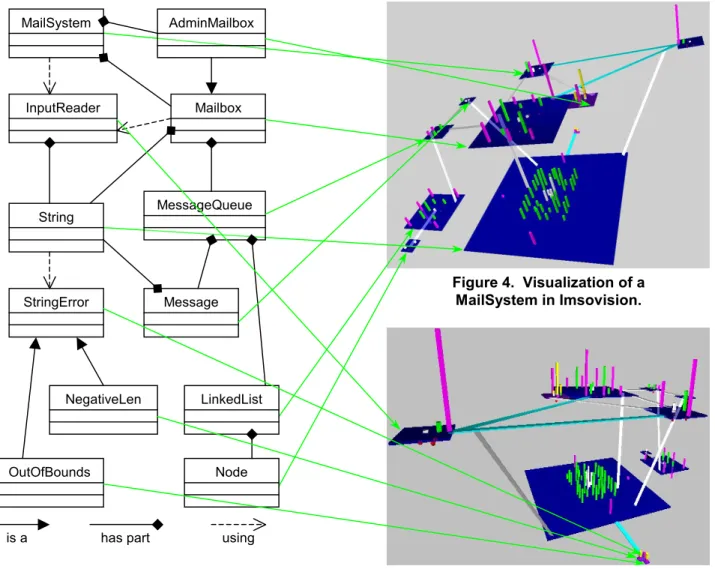
Figure 3 gives the UML class diagram for a simple mail system. It represents an implementation for a voice
mail system to an internal phone system. There are twelve classes that make up the system. The basic types of relationships between classes are represented in this system. The MailSystem has a number of Mailboxes and also has an AdminMailbox. Mailsystem uses an InputReader. Also, AdminMailbox is a specialization of Mailbox.
Figures 4 and 5 are a visualization of this same software system in Imsovision using a VRML browser. The first thing one sees in this view is the large class at the bottom. Its size tells us that it is larger, in terms of methods and attributes, than any of the other classes. This happens to be the String class. One may think this unusual, but the class is very well developed and overloads all the relational operators that are shown as a clustering of green columns – (accessor functions). Notice also that the string class mainly consists of accessor functions rather than modifier functions (purple MailSystem AdminMailbox Mailbox InputReader String Message MessageQueue StringError OutOfBounds NegativeLen Node LinkedList
is a has part using
Figure 4. Visualization of a MailSystem in Imsovision.
Figure 5. Another view of the MailSystem looking from the opposite
direction as figure 4. Figure 3. UML Class Diagram of
columns on the outside edges). Another thing that is easily seen in these view are the relative sizes of the member functions and that large member functions are easily discerned.
In figure 6, we see the simple class hierarchy of Mailbox (center) and AdminMailbox (bottom right). Part of the String class is seen below Mailbox. The yellow shading on the tops of the member function in AdminMailbox represents operator overloading.
As seen in the example, even in its current version, Imsovision offers more information (e.g., size metrics, methods and attribute types) to the user than the UML diagram; it is more than just placing an UML diagram into a 3D space. In addition, the VE allows for representation of much more complex systems. A software system with around 50 classes with similar complexity level as the Mailbox system presented here, is impossible to represent in a one-page UML diagram.
4. Uses of Imsovision
The primary function of Imsovision is for program understanding in software development, maintenance, or reengineering. A COOL visualization is built based on the source code and provides to the developer insight in the OO design of the software system. By understanding the relationships between classes and the complexity of them, the developer can decide where to concentrate the development effort in the next step. In the case of reengineering, Imsovision helps the user understand how classes relate to each other and thus make it easier to map source code to elements in the problem or solution domain. In addition, the size metrics combined with the coupling information will indicate to the software engineer which classes need possible attention.
In addition to class information, Imsovision offers information at the method and class attribute level. The developer can easily assess the size/complexity of attributes and methods. Different types of member functions (e.g., constructors, accessors, modifiers) are very easy to identify in the visualization. Also, with a simple click, the user can see an entire chain of overloaded function in a class hierarchy. The user can also see all the accessible methods and attributes to a particular object, by simply considering the public side of the current plane in the VE. Usually it is not an easy task to infer such information, which is extremely useful in the development or in the usage of a class.
Much like UML, Imsovision is intended for use in the design phase of the software development process. The COOL visualization at this phase represents the envisioned class diagram of the system, with the relationship between classes, member functions of different type (e.g., public, private, constructors, destructors, accessors, modifiers, etc.), and attributes. As
the system is implemented, additional metric information is incorporated into the visualization (e.g., size of attributes, methods, and classes).
Imsovision can be used not only for program understanding, but also for process management. In its current version, Imsovision is able to capture the development of the represented software system. One can capture two representations of the system at two different moments in time. By overlapping the two visualizations, one could highlight the differences that describe the evolution of the system. The columns associated with the methods will be increased in size, showing the status of their implementation. Newly added elements into the visualization indicate design changes. After the source code is written, a new visualization can be generated from the source code and compared to the one created in the design phase, thus observing if the mapping from design to the source code was preserved or not.
Figure 6. The Mailbox and AdminMailbox classes.
Figure 7. An inverted view of the LinkedList and Node classes. The private data elements are seen along with a private member function in LinkedList. The class platform is also
Since the COOL visualization is a “map” of the software system, it also shows areas that are under development, or need to be developed further. Additional color information can be included to highlight such aspects of the system.
In essence, Imsovision combines the advantages of using UML diagrams and software metrics in one. As mentioned, its design allows for inclusion of additional, dynamic information about the system. Once that is accomplished, Imsovision could successfully replace the UML diagrams, the debugger, and the system dependency graph. All these tools and the user tasks associated with them will be integrated into the VE, were the developer has noted advantages over traditional media (i.e., paper, desktop).
5. Related work
Much of the work on software visualization is referred to in a recent collection of papers put together by Stasko [20]. This collection reflects the different categories of software visualization including visual programming, algorithm animation, program visualization, and information visualization. Our work concentrates on visualizing an entire software system for the purposes of comprehending the systems design and architecture.
Closely related research to what is presented here is by Knight [12-15] and Young [28]. This work involves using virtual reality and 3D graphics to visualize software systems. Knight’s work, Software City, uses a city metaphor for visualization. The world is the entire software system, a country is the directory structure, cities are files, and so on. The Software World is a semantically rich environment designed to be familiar to humans. However, this feature comes at the expense of underutilizing the 3D navigation features (e.g., it does not consider navigation “under ground” or “in the sky”) and at the expense of complexity (e.g., a building has too many elements that represent detailed information, which in fact decreases the level of abstraction and increases the complexity of the visualization). In general, the resemblance between a VE and a real world environment makes the user feel more “at home”, but the complexity increases too much and, if the VE represents some abstract elements (e.g., source code), the mapping is usually unnatural.
Other work that addresses the problems of visualizing entire software systems to support program comprehension and maintenance include SeeSoft [2, 3, 9], VOGUE [16], Rigi [21, 22]] and InfoBUG [5]. The SoftArch environment [10] has the power to represent static and dynamic aspects of the software system at various degrees of abstraction. It is one of the few systems that allows for visualization at system architecture level. As many other software visualization
systems suffers from the limitation of 2D media. The GraphVisualizer3D [26] uses Graph Definition Language to represent object-oriented software in 3D, using the same underlying methods: modules of source code are shown as atomic units, and relationships between modules are depicted by connecting lines [23]. These approaches do not make use of virtual reality environments and their representations are in 2D and 3D forms.
6. Future work
As mentioned earlier, we are currently working on a translator system that fully automates the conversion of source code into a visualization. Our current prototype is only partially automated. We are also working to fully support differing syntactic features of the source code. Integrating this with existing UML class diagrams is also a major goal.
The long-term goals of this project are to build additional features to support the following:
• Static visualization • Dynamic visualization
• Collaborative problem solving (remote) • Visualization of system evolution
• Support for representing reusable components and design patterns
• Process and resource management
A number of new features that support static view of the system are planned. Filtering, labeling, and various additional drilldown features will be added. A number of layout algorithms are being examined to best support the display of the classes.
A number of features to support dynamic aspects of the source code are planned. Data flow and control flow aspects will be integrated into the visualization. Highlighting parts of the system that are active over a slow motion run of this system is envisioned. This will act much like a debugger trace, but at a much higher level of abstraction.
Features to support collaborative problems solving within the VE will be of great benefit to large-scale software development. Multiple developers can enter the VE from the same or remote sites to address problems of design, maintenance, or error correction. This type of environment will also prove useful for explaining the complexities of a software system to new team members.
The future version of Imsovision will be further integrated into the software development process. The representation of the software system will be updated as each line of code is written or changed and saved. Imsovision will be used not only as an understanding tool, but also as a management tool. In a collaborative environment (such as the CAVE), the project manager
will be able to see each developer at work. The manager will be able to monitor what component the developer working on, how much each component is complete, or how much it has changed from the last version.
7. References
[1] Arthur, K. W., Booth, K. S., and Ware, C., "Evaluating 3D task performance for fish tank virtual worlds", ACM
Transactions on Information Systems, vol. 11, no. 3,
July 1993, pp. 239-265.
[2] Ball, T. and Eick, S., "Visualizing Program Slices", in Proceedings of IEEE Symposium on Visual Languages, St. Louis, MO, 1994, pp. 288-295. [3] Ball, T. and Eick, S., "Software Visualization in the Large",
Computer, vol. 19, no. 4, 1996, pp. 33-43.
[4] Bell, G., Parisi, A., and Pesce, M., "The Virtual Reality Modeling Language Version 1.0 Specification", Webpage,
http://www.vrml.org/VRML1.0/vrml10c.html, 1996. [5] Chuah, M. C. and Eick, S., "Glyphs for Software
Visualization", in Proceedings of 5th International Workshop on Program Comprehension, Dearborn, MI, 1997, pp. 183-191.
[6] CosmoPlayer, "Cosmo Software", Computer Associates, Webpage, Date Accessed: 8/2000,
http://www.cai.com/cosmo/, 2000.
[7] Crus-Neira, C., Sandin, D., and Defanti, T., "Surround-Screen Projection-Based Virtual Reality: The Desing and Implementation of CAVE", in Proceedings of SIGGRAPH93, 1993, pp. 135-142.
[8] Dos Santos, C. R., Gros, P., Abel, P., Loisel, D., Trichaud, N., and Paris, J. P., "Mapping Information onto 3D Virtual Worlds", in Proceedings of IEEE International Conference on Information Visualization, London, England, July 19-21 2000.
[9] Eick, S., "Graphically Displaying Text", Journal of
Computational and Graphical Statistics, vol. 3, no. 2,
1994, pp. 127-142.
[10] Grundy, J. and Hosking, J. G., "High-level Static and Dynamic Visualisation of Software Architectures", in Proceedings of IEEE Symposium on Visual
Languages, Seattle, Washington, September, 10-14 2000.
[11] Hubona, G. S., Shirah, G. W., and Fout, D. G., "3D Object Recognition with Motion", in Proceedings of CHI'97, 1997, pp. 345-346.
[12] Knight, C. and Munro, M., "Comprehension with[in] Virtual Environment Visualisations", in Proceedings of Seventh International Workshop on Program Comprehension, Pittsburgh, PA, 5-7 May 1999, pp. 4-11.
[13] Knight, C. and Munro, M., "Visualising Software - A Key Research Area", in Proceedings of International Conference on Software Maintenance (ICSM99), Oxford, England, 1999.
[14] Knight, C. and Munro, M., "Virtual but Visible Software", in Proceedings of International Conference on
Information Visualisation (IV00), London, England, July 19-21 2000.
[15] Knight, C., Munro, M., "Should Users Inhabit Visualisations?", in Proceedings of Knowledge Management Networking Workshop of WET ICE 2000, Washington, DC, 2000.
[16] Koike, H., "The Role of Another Spatial Dimension in Software Visualization", ACM Transactions on
Information Systems, vol. 11, no. 3, 1993, pp.
266-286.
[17] Leigh, J., Johnson, A. E., Brown, M., Sandin, D., and Defanti, T. A., "Visualization in Teleimmersive Environments", IEEE Computer,, vol. 32, no. 12, December 1999, pp. 66-73.
[18] Mackinlay, J., "Automating the design of graphical presentation of relational information", ACM
Transaction on Graphics, vol. 5, no. 2, April 1986, pp.
110-141.
[19] Shneiderman, B., "The Eyes Have It: A Task by Data Type Taxonomy for Information Visualizations", in Proceedings of IEEE Visual Languages, 1996, pp. 336-343.
[20] Stasko, J., Dominque, J., Brown, M., and Price, B.,
Software Visualization, MIT Press, 1998.
[21] Storey, M.-A. D., Fracchia, F. D., and Mueller, H. A., "Cognitive Design Elements to Support the Construction of a Mental Model during Software Visualization", in Proceedings of 5th International Workshop on Program Comprehension, 1997. [22] Storey, M.-A. D., Wong, K., and Muller, H. A., "On
Integrating Visualization Techniques for Effective Software Exploration", in Proceedings of IEEE Symposium on Information Visualization, Phoenix, AR, 1997.
[23] Ware, C. and Franck, G., "Representing Nodes and Arcs in 3D Networks", in Proceedings of IEEE Conference on Visual Languages, St. Louis, October 1994, pp. 189-190.
[24] Ware, C. and Franck, G., "Viewing a Graph in a Virtual Reality Display is Three Times as Good as a 2D Diagram", in Proceedings of IEEE Visual Languages, 1994, pp. 182-183.
[25] Ware, C. and Franck, G., "Evaluating stereo and motion cues for visualizing information nets in three dimensions", ACM Transaction on Graphics, vol. 15, no. 2, April 1996, pp. 121-140.
[26] Ware, C., Hui, D., and Franck, G., "Visualizing Object Oriented Software in Three Dimensions", in Proceedings of CASCON'93, Toronto, Ontario, Canada, October 1993, pp. 612-620.
[27] Wiss, U., Carr, D., and Jonsson, H., "Evaluating Three-Dimensional Information Visualization Designs A Case Study of Three Designs", in Proceedings of International Conference on Information
Visualisation, London, England, July 29-31 1998. [28] Young, P. and Munro, M., "Visualising Software in Virtual
Reality", in Proceedings of 6th International Workshop on Program Comprehension, Ischia, Italy, 1998, pp. 17-24.