Visualizing Software in an Immersive Virtual Reality Environment
Jonathan I. Maletic
1, Jason Leigh
2, and Andrian Marcus
11
Division of Computer Science
2Electronic Visualization Laboratory
The Department of Mathematical Sciences
University of Illinois at Chicago
The University of Memphis
MC154, 1120SEO, Dept. EECS
Campus Box 523240
851 S. Morgan St.
Memphis TN 38152-3240
Chicago IL 60607
[email protected], [email protected], [email protected]
Introduction
The problems faced by an individual trying to understand a software system are very difficult. As the size of software systems increases so do the complexities in understanding. A reasonable solution to this problem is the construction of software tools that assist us in the comprehension tasks. An obvious way to assist us with this problem is to build visual representation of the software. For example, the Unified Modeling Language (UML) uses a graphical notation to describe software in a visual manner. While these types of notations allow for an abstraction of an existing software system, they do not scale up well with respect to comprehension. That is, it is quite difficult to “see” an entire software system with these notations and tools. They suffer from the same cognitive related problems as source code. There is a critical factor limiting these notations (and other software visualization tools), namely they represent the information in only two visual dimensions.
By utilizing Virtual Reality (VR) for software visualization, we can take advantage of a wider range of a user’s perceptual senses and their ability to navigate through the visual representation. The immersive environment allows the user to utilize their stereoscopic vision. Stereopsis can be a huge benefit in disambiguating complex abstract representations. It also helps the viewer to judge relative size of objects and distances between objects. We believe that using VR for software visualization will result in the same types of advancements that have taken place in the scientific visualization arena.
Our work focuses on the visualization of very large software systems by combining innovative research in three areas: information visualization, virtual reality, and computer supported cooperative work. The vision is to support the development, maintenance, and reverse engineering phases of software engineering, by using a highly interactive, collaborative, and immersive visualization environment.
We are involved in the development of a Virtual Reality Environment (VE) for software visualization. The system, Imsovision (IMmersive SOftware VISualizatION), will act as a research platform to investigate how immersive visualization environments can assist in the problems of software development and maintenance. We are combining the theories, methodologies, and current research of program comprehension and software visualization with technology of virtual reality to produce a holistic environment to support the development, maintenance, and reverse engineering of software. Specifically, we plan to support the following features in Imsovision: Visualization of static structures of the physical source code and system architecture; Visualization of software metric information; Visualization of dynamic aspects of the software system; Collaborative problem solving for maintenance and development; Visualization of system evolution and change; Support for different programming languages and paradigms (e.g., OO and Structured); Visualization of components, design patterns, and reuse abstractions; Process and resource management.
Virtual Reality versus 3D and 2D
One has to make distinction between 3D and VR. A user immersed in a Virtual Reality Environment (VE) can always access external information (e.g., the actual source code) without leaving the environment and the context of the representation (e.g., using a palmtop or laptop). While both representations offer the perception of depth, only VEs allow the user to immerse oneself into the representation. Also, this immersion allows the user to take advantage of their stereoscopic vision. Stereopsis can be a great benefit in disambiguating complex abstract representations. It also helps the viewer to judge relative size of objects and distances between objects. In 3D, you have to move the view around to understand the diagram.
The work of Hubona, Shirah and Fout [Hubona'97] suggests that users' understanding of a 3D structure improves when they can manipulate the structure. One of the defining features of VR representations is the ability of the user to manipulate the visualization, by being immersed in the environment. The work of Ware and Franck [Ware'94] indicates that displaying data in three dimensions instead of two can make it easier for users to understand the data. In addition the
error rate in identifying routes in 3D graphs is much smaller than 2D [Ware'93, Ware'94]. They also show that motion cues combined with stereo viewing can substantially increase the size of the graph that can be perceived [Ware'96]. VR combines stereopsis and motion. The CyberNet system [Dos Santos'00] shows that mapping large amount of (dynamic) information to 3D representation is beneficial, regardless of the type of metaphors (real or virtual) used. CyberNet is used to map network services and workstation information to a city landscape metaphor or to a solar system metaphor, and geographical data to a building metaphor. Real-life based metaphors have advantages (using preexisting knowledge) but also disadvantages (information overload and natural limitations).
While VR is being successfully applied to scientific visualization (i.e., medicine, chemistry, etc.), little research has been done on using VR for information and software visualization. VR is typically used to visualize something physical, in a virtual way. Here we propose to visualize the very abstract concept of software in VR. This gives rise to a number of research issues: What are the most efficient methods to visually represent software systems? What are the perceptual limits of these visualizations with respect to large software systems? How do we represent static and dynamic information about the software? What are the user’s most important information needs with respect to particular software engineering tasks? What features are most suited to supporting collaborative problem solving in this domain? What software engineering tasks benefit most from this collaborative environment?
Imsovision
In Imsovision, the visualizations are marked up in VRML, and therefore take advantage of the navigation functionality that is incorporated into the particular VE that renders the VRML source. Imsovision is designed to use the CAVE (originally in [Crus-Neira'93] and more recently described in [Leigh'99]) as the primary representation medium. The CAVE is a virtual reality system where the display is a 10 foot-cubed room that is rear-projected with stereoscopic images, creating the illusion that 3D objects appear to co-exist with the user in the room. A user dons a pair of lightweight liquid crystal shutter glasses to resolve the stereoscopic imagery, and holds a button ‘wand’ for three-dimensional interaction with the virtual environment. An electromagnetic tracking system attached to the shutter glasses and the wand allows the CAVE to determine the location and orientation of the user's head and hand at any given moment in time. This information is used to instruct the graphic drivers of the CAVE to render the imagery from the point of view of the viewer. This way, the user can physically walk around an object that appears to exist in 3D in the middle of the CAVE. If the viewer wants to look behind a virtual object, he walks around to the back. If the viewer wants to look under an object in the CAVE, they crouch down and physically look under the virtual object. The wand contains three buttons and a joystick that can be programmed for different features depending on the application. Typically, the joystick is used to navigate through environments that are larger than the CAVE itself, such as in architectural walk-throughs. The buttons can be used to change modes, or bring up menus in the CAVE, or to ‘grab’ a virtual object.
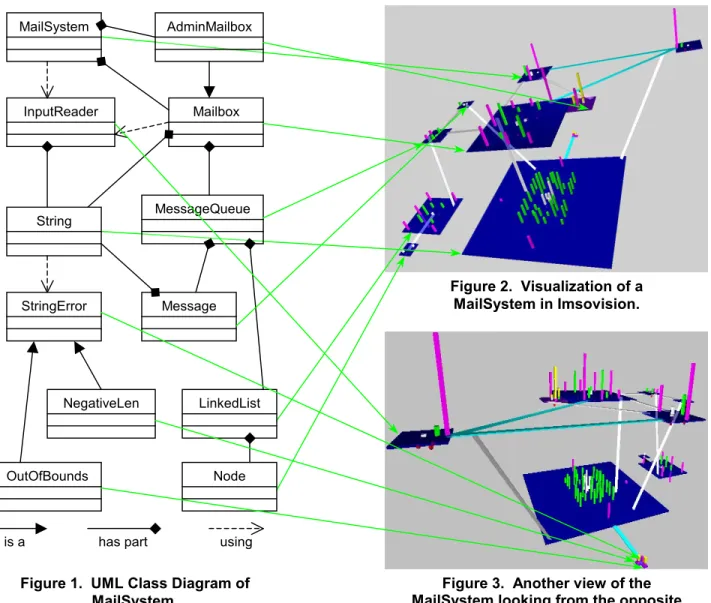
Figure 1 gives the UML class diagram for a simple mail system. It represents an implementation for a voice mail system to an internal phone system. There are twelve classes that make up the system. The basic types of relationships between classes are represented in this system. The MailSystem has a number of Mailboxes and also has an AdminMailbox. Mailsystem uses an InputReader. Also, AdminMailbox is a specialization of Mailbox. Figures 2 and 3 are a visualization of this same software system in Imsovision using a VRML browser. The first thing one sees in this view is the large class at the bottom. Its size tells us that it is larger, in terms of methods and attributes, than any of the other classes. This happens to be the String class. One may think this unusual, but the class is very well developed and overloads all the relational operators that are shown as a clustering of green columns – (accessor functions). Notice also that the String class mainly consists of accessor functions rather than modifier functions (purple columns on the outside edges). Another thing that is seen in these view are the relative sizes of the member functions and that large member functions are easily discerned. As seen in the example, even in its current version, Imsovision offers more information (e.g., size metrics, methods and attribute types) to the user than the UML diagram; it is more than just placing an UML diagram into a 3D space. In addition, the VE allows for representation of much more complex systems. A software system with around 50 classes with similar complexity level as the Mailbox system presented here, is impossible to represent in a one-page UML diagram.
The remaining sections are devoted to the underlying concepts we are using in the construction of our system. They describe the issues of mapping the raw data to a visualization, the user tasks that we intend to support, and the concepts behind supporting collaborative tasks.
Mapping raw data to visualization
Mackinlay [Mackinlay'86] defined two criteria to evaluate the mapping of data to a visual metaphor: expressiveness and effectiveness. These criteria were used in 2D mappings, but can also be applied for 3D mappings. Expressiveness refers to the capability of the metaphor of visually representing all the information we desire to visualize. For instance, if the number of visual parameters available in the metaphor for displaying information is fewer than the number of data values we wish to visualize, the metaphor will not be able to meet the expressiveness criterion.
The relationship between data values and visual parameters has to be a univocal relationship; otherwise, if more than one data value is mapped onto the same visual parameter, and then it will be impossible to distinguish one value’s influence from the other. On the other hand, there can always be visual parameters that are not used to map information, as long as there is no need for them to be utilized.
The second criterion, effectiveness, relates to the efficacy of the metaphor as a means of representing the information. Along the effectiveness dimension we can further distinguish several criteria: effectiveness regarding the information passing as visually perceived, regarding aesthetic concerns, regarding optimization (e.g., number of polygons needed to render the world). In the case of quantitative data (such as the metrics in our case), not only the number of visual parameters has to be sufficient to map all the data, but also, they must be able to map the right data. There are visual parameters that are not able to map a specific category of data; for instance, shape is not useful for mapping quantitative data, while the size of a metaphor is.
MailSystem AdminMailbox Mailbox InputReader String Message MessageQueue StringError OutOfBounds NegativeLen Node LinkedList
is a has part using
Figure 2. Visualization of a MailSystem in Imsovision.
Figure 3. Another view of the MailSystem looking from the opposite
direction as figure 2. Figure 1. UML Class Diagram of
The second criterion is, as in the case above, the one of effectiveness. This criterion implies the categorization of the visual parameters according to its capabilities of encoding the different types of information. Moreover, this also implies categorizing the information according to its importance so that information that is more important can be encoded more efficiently when options must be taken. This categorization of the importance of the information has two expressions: one is an assigned importance of the information in the context of a software system; the other is a preference of the user. Nonetheless, the user may choose to override this and define his own importance of the data, according to his priorities when visualizing a software system. For example, one could give preference in the visualization to the public members of an object-oriented class, versus the private ones.
In order to satisfy these criteria for the mapping, one must have a solid data characterization. Data characterization is usually the first step to understand a phenomenon or system. Developing a taxonomy helps to make sense of large amounts of information. Although these characteristics of data apply mostly to data visualization, they must be taken into consideration in software visualization as well. The metaphors should be designed such that they maximize the amount of data that can be represented with an accent on the user’s information seeking goals.
An important aspect to be considered in defining a visual language is the nature of its users. Our language is designed for use by software developers with solid knowledge of programming, program designs, and system architecture; also, they must possess a reasonable ability to abstract. Therefore, the metaphors in the language should be simple, having a familiar form and straightforward mapping to the source code. The media type for the visual representation is also an important factor to consider. In the case of VEs, there is often a trade-off between levels of detail (i.e., resolution, accuracy) and speed of navigation and/or the ability to support collaborative work (i.e., network of two or more VEs). We consider of primary importance the easy and fast navigation ability, and the support for collaborative work. If the metaphors are carefully chosen, the lack of detail and accuracy of representation causes aesthetic discomfort rather than loss of information and meaning. Existing visualizations often lack in one or more of these areas. They are either too complex to navigate, learn, or they lose essential information by abstracting too much.
When creating an information visualization application, it is important to identify primary tasks before choosing an information visualization language. Our task analysis is based on Shneiderman [Shneiderman'96], who presents seven high level tasks that an information visualization application should support. For evaluation purposes, we must refine these into lower-level tasks as done by Wiss, Carr, and Jonsson [Wiss'98]. These primary tasks include: Overview- Gain an overview of the entire collection of data that is represented; Zoom- Zoom in on items of interest; Filter- Filter out uninteresting items; Details-on-demand- Select an item or group and get details when needed; Relate- View relationships among items; History- Keep a history of actions to support undo, replay, and progressive refinement; Extract- Allow extraction of sub-collections and of query parameters.
Support for Collaboration Tasks
In order to support collaboration effectively one must consider how adding collaboration can improve the overall efficiency of the software visualization process. Hence, the goal is not to re-invent past visualization techniques and tools, but to re-examine them in the new context of collaboration. Our approach therefore is to extend Schneiderman’s seven information tasks (described above,) to allow them to be performed collaboratively. This deeply affects both the underlying architecture of Imsovision and its overall interaction paradigm. An over-arching principle that we will adopt to define Imsovision’s collaborative interaction paradigm, is a concept we developed for collaborative scientific visualization called Multiple Collaborative Representations (MCR) [Park'00]. MCR is motivated as follows: in the real world, individuals who are trying to solve a common problem gather (in workshops, for example) in the hopes that their combined experiences and expertise will contribute new perspectives and solutions to the problem. In many existing collaborative VR applications, participants typically all view and modify the same representation of the data they are viewing. It is our belief that a greater benefit will be derived if the participants are given the power to create and modify their own representations, based on their particular areas of interest and expertise [Leigh'96]. Recent work in providing multiple representations to enhance learning has implied that this is a non-trivial problem [Ainsworth'97, Larkin'87, Salzman'98].
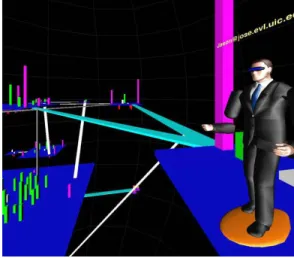
Figure 4. A remote user immersed in the VE investigating a visualization of a
software system.
We envision a powerful application of MCRs in the visualization of software. Here the large number of dimensions of a software system may be partitioned across multiple users to assist in reducing the overall complexity of the content being visualized. The goal of research in MCR is to develop techniques to allow participants to coordinate their interpretations of each representation to enable a more efficient collective understanding of the data being explored. One example of a tool that has incorporated this technique is CAVE6D [Lascara'99] developed between EVL and the Center for Coastal and Physical Oceanography. CAVE6D is a tool for collaboratively viewing multi-dimensional numerical data from atmospheric, oceanographic, and other similar models, including isosurfaces, contour slices, volume visualization, wind/trajectory vectors, and various image projection formats. We have already conducted an exploratory design study using CAVE6D in which we confirmed the usefulness of MCRs
[Park'00]. We found that while multiple perspectives can enhance pattern discovery in complex multi-dimensional data, it can also lead to increased confusion. Furthermore, we found that the typical pattern of activity during a collaborative session was that of users initially agreeing on parameters to search for; then separating to perform explorations on their own; and then reconvening to compare results. This is a clear indication for the need to support multiple, tailorable representations in collaborative VR. This finding closely reflects those of Gutwin [Gutwin'98] however, whereas Gutwin’s work is centered on 2D desktop computer supported cooperative work, our work focuses on immersive VR. In Van Dam’s recent paper on the state of immersive visualization [van Dam'00], he cites that our work in MCR is an important beginning towards understanding how to facilitate collaboration in immersive environments. We believe that combining the principals derived from MCR with Schneiderman’s seven tasks is a logical next step that will determine the way collaborative visualization software will be defined in the future.
Related work
Much of the work on software visualization is referred to in a recent collection of papers put together by Stasko [Stasko'98]. This collection reflects the different categories of software visualization including visual programming, algorithm animation, program visualization, and information visualization. Our work concentrates on visualizing an entire software system for the purposes of comprehending the systems design and architecture.
Closely related research to what is presented here is by Knight [Knight'99, '00] and Young [Young'98]. This work involves using virtual reality and 3D graphics to visualize software systems. Knight’s work, Software City, uses a city metaphor for visualization. The world is the entire software system, a country is the directory structure, cities are files, and so on. The Software World is a semantically rich environment designed to be familiar to humans. However, this feature comes at the expense of underutilizing the 3D navigation features (e.g., it does not consider navigation “under ground” or “in the sky”) and at the expense of complexity (e.g., a building has too many elements that represent detailed information, which in fact decreases the level of abstraction and increases the complexity of the visualization). In general, the resemblance between a VE and a real world environment makes the user feel more “at home”, but the complexity increases too much and, if the VE represents some abstract elements (e.g., source code), the mapping is usually unnatural.
Other work that addresses the problems of visualizing entire software systems to support program comprehension and maintenance include SeeSoft [Ball'94, '96, Eick'94], VOGUE [Koike'93], Rigi [Storey'97, Storey'97]] and InfoBUG [Chuah'97]. The SoftArch environment [Grundy'00] has the power to represent static and dynamic aspects of the software system at various degrees of abstraction. It is one of the few systems that allows for visualization at system architecture level. As many other software visualization systems suffers from the limitation of 2D media. The GraphVisualizer3D [Ware'93] uses Graph Definition Language to represent object-oriented software in 3D, using the same underlying methods: modules of source code are shown as atomic units, and relationships between modules are depicted by connecting lines [Ware'94]. These approaches do not make use of virtual reality environments and their representations are in 2D and 3D forms.
References
[Ainsworth'97] Ainsworth, S. E., Wood, D. J., and Bibby, P. A., (1997), "Evaluating principles for multi-representational learning environments", in Proceedings of 7th EARLI conference, Athens.
[Ball'94] Ball, T. and Eick, S., (1994), "Visualizing Program Slices", in Proceedings of IEEE Sym. on Visual Languages, pp. 288-295. [Ball'96] Ball, T. and Eick, S., (1996), "Software Visualization in the Large", Computer, vol. 19, no. 4, pp. 33-43.
[Chuah'97] Chuah, M. C. and Eick, S., (1997), "Glyphs for Software Visualization", in Proceedings of 5th IWPC, pp. 183-191. [Crus-Neira'93] Crus-Neira, C., Sandin, D., and Defanti, T., (1993), "Surround-Screen Projection-Based Virtual Reality: The Desing
and Implementation of CAVE", in Proceedings of SIGGRAPH93, pp. 135-142.
[Dos Santos'00] Dos Santos, C. R., Gros, P., Abel, P., Loisel, D., Trichaud, N., and Paris, J. P., (2000), "Mapping Information onto 3D Virtual Worlds", in Proceedings of IEEE International Conference on Information Visualization, London, England, July 19-21. [Eick'94] Eick, S., (1994), "Graphically Displaying Text", J. of Computational and Graphical Statistics, vol. 3, no. 2, pp. 127-142. [Grundy'00] Grundy, J. and Hosking, J. G., (2000), "High-level Static and Dynamic Visualisation of Software Architectures", in
Proceedings of IEEE Symposium on Visual Languages, Seattle, Washington, September, 10-14.
[Gutwin'98] Gutwin, C. and Greenberg, S., (1998), "Design for individuals, design for groups: tradeoffs between power and workspace awareness", in Proceedings of ACM CSCW'98 Conference on Computer Supported Cooperative Work, pp. 207-216.
[Hubona'97] Hubona, G. S., Shirah, G. W., and Fout, D. G., (1997), "3D Object Recognition with Motion", in Proceedings of CHI'97, pp. 345-346.
[Knight'99] Knight, C. and Munro, M., (1999), "Comprehension with[in] Virtual Environment Visualisations", in Proceedings of Seventh International Workshop on Program Comprehension, Pittsburgh, PA, 5-7 May, pp. 4-11.
[Knight'00] Knight, C. and Munro, M., (2000), "Virtual but Visible Software", in Proceedings of International Conference on Information Visualisation (IV00), London, England, July 19-21.
[Koike'93] Koike, H., (1993), "The Role of Another Spatial Dimension in Software Visualization", ACM Tran. on Info. Systems, vol. 11, no. 3, pp. 266-286.
[Larkin'87] Larkin, J. and Simon, H. A., (1987), "Why a Diagram is (Sometimes) Worth Ten Thousand Words", Cognitive Science, vol. 11, no. 1, pp. 65-99.
[Lascara'99] Lascara, C., Wheless, G., Cox, D., Patterson, R., Levy, S., Johnson, A. E., and Leigh, J., (1999), "TeleImmersive Virtual Environments for Collaborative Knowledge Discovery", in Proceedings of Advanced Simulation Technologies Conference '99, San Diego, CA, April 11-15.
[Leigh'96] Leigh, J., Johnson, A. E., Vasilakis, C., and DeFanti, T., (1996), "Multi-perspective Collaborative Design in Persistent Networked Virtual Environments", in Proceedings of IEEE Virtual Reality Annual International Symposium '96, Santa Clara, California, Mar. 20 - Apr. 3, pp. 253-260, 271-272.
[Leigh'99] Leigh, J., Johnson, A. E., Brown, M., Sandin, D., and Defanti, T. A., (1999), "Visualization in Teleimmersive Environments", IEEE Computer,, vol. 32, no. 12, December, pp. 66-73.
[Mackinlay'86] Mackinlay, J., (1986), "Automating the design of graphical presentation of relational information", ACM Transaction on Graphics, vol. 5, no. 2, April, pp. 110-141.
[Park'00] Park, K., Kapoor, A., and Leigh, J., (2000), "Lessons Learned from Employing Multiple Perspectives In a Collaborative Virtual Environment for Visualizing Scientific Data", in Proceedings of ACM CVE 2000, San Francisco, CA, pp. 73-82. [Salzman'98] Salzman, M., Dede, C., Loftin, B., and Ash, K., (1998), "VR's frames of reference: A visualization technique for
mastering abstract information spaces", in Proceedings of 3rd International Conference on Learning Sciences, pp. 249-255. [Shneiderman'96] Shneiderman, B., (1996), "The Eyes Have It: A Task by Data Type Taxonomy for Information Visualizations", in
Proceedings of IEEE Visual Languages, pp. 336-343.
[Stasko'98] Stasko, J., Dominque, J., Brown, M., and Price, B., (1998), Software Visualization, MIT Press.
[Storey'97] Storey, M.-A. D., Fracchia, F. D., and Mueller, H. A., (1997), "Cognitive Design Elements to Support the Construction of a Mental Model during Software Visualization", in Proceedings of 5th International Workshop on Program Comprehension. [Storey'97] Storey, M.-A. D., Wong, K., and Muller, H. A., (1997), "On Integrating Visualization Techniques for Effective Software
Exploration", in Proceedings of IEEE Symposium on Information Visualization, Phoenix, AR.
[van Dam'00] van Dam, A., Forsberg, A. S., Laidlaw, D. H., LaViola, J. J. J., and Simpson, R. M., (2000), "Immersive VR for Scientific Visualization: A Progress Report", IEEE Computer Graphics & Applications, vol. 20, no. 6, November/December. [Ware'93] Ware, C., Hui, D., and Franck, G., (1993), "Visualizing Object Oriented Software in Three Dimensions", in Proceedings of
CASCON'93, Toronto, Ontario, Canada, October, pp. 612-620.
[Ware'94] Ware, C. and Franck, G., (1994), "Viewing a Graph in a Virtual Reality Display is Three Times as Good as a 2D Diagram", in Proceedings of IEEE Visual Languages, pp. 182-183.
[Ware'94] Ware, C. and Franck, G., (1994), "Representing Nodes and Arcs in 3D Networks", in Proc. of IEEE Conf. on Visual Languages, pp. 189-190.
[Ware'96] Ware, C. and Franck, G., (1996), "Evaluating stereo and motion cues for visualizing information nets in three dimensions", ACM Transaction on Graphics, vol. 15, no. 2, April, pp. 121-140.
[Wiss'98] Wiss, U., Carr, D., and Jonsson, H., (1998), "Evaluating Three-Dimensional Information Visualization Designs A Case Study of Three Designs", in Proceedings of International Conference on Information Visualisation, London, England, July 29-31. [Young'98] Young, P. and Munro, M., (1998), "Visualising Software in Virtual Reality", in Proceedings of 6th IWPC, pp. 17-24.