Effectiveness of Loss Labeling in Improving TCP Performance in
Wired/Wireless Networks
∗Dhiman Barman
Ibrahim Matta
Computer Science Department
Boston University
Boston, MA 02215, USA
{
dhiman, matta
}
@cs.bu.edu
Abstract
The current congestion-oriented design of TCP hin-ders its ability to perform well in hybrid wireless/wired networks. We propose a new improvement on TCP NewReno (NewReno-FF) using a new loss labeling technique to discriminate wireless from congestion losses. The proposed technique is based on the es-timation of average and variance of the round trip time using a filter, called Flip Flop filter, that is aug-mented with history information. We show the com-parative performance of TCP NewReno, NewReno-FF, and TCP Westwood through extensive simula-tions. We study the fundamental gains and limits us-ing TCP NewReno with varyus-ing Loss Labelus-ing accu-racy (NewReno-LL) as a benchmark. Lastly our inves-tigation opens up important research directions. First, there is a need for a finer grained classification of losses (even within congestion and wireless losses) for TCP in heterogeneous networks. Second, it is essential to de-velop an appropriate control strategy for recovery after the correct classification of a packet loss.
1. Introduction
The Transmission Control Protocol (TCP) has been the dominant transport mechanism for reliable data transfer over the Internet. While the Internet is grow-ing in size and becomgrow-ing increasgrow-ingly heterogeneous, network designers are faced with the challenging ques-tion of how to empower TCP so it works well in such hybrid wired/wireless environment [19], where packets can be lost because of various reasons. Many studies have shown that TCP throughput can be improved if the cause of a packet loss is identified. TCP was orig-inally designed for a wired environment where pack-ets are lost mainly due to congestion (i.e. buffer
over-∗This work was supported in part by NSF grants ANI-0095988
and EIA-0202067, and grants from Sprint and Motorola Labs.
flow), and the congestion control algorithms imbedded therein act accordingly. When a TCP connection ex-tends over wireless links, packet losses over such links occur primarily due to channel errors or during hand-off. By attributing a packet loss to wireless transmis-sion errors, the TCP source can refrain from taking unnecessary “congestion” control measures. One set of solutions (e.g. Snoop [1], WTCP [16]) require sup-port from the base station located at the interface be-tween the wired infrastructure and the wireless access infrastructure. These solutions incur the cost of im-plementation at the base station and some violate the end-to-end semantics of TCP.
In this paper, we are primarily interested in end-to-end solutions, i.e. those which do not require any support from the network. Proposed end-to-end solu-tions differ in the measure(s) they use to infer the cause of a packet loss. These measures may be estimated at the sender without any support from the receiver (e.g. round-trip delay), or may require support from the re-ceiver (e.g. one-way delay or delay variance) [15, 4].
Loss classification can be implicitin the congestion control of a protocol. TCP Westwood [12] is such a sender-side modification of TCP Reno which estimates the rate that a connection is getting based on the rate at which the sender receives the ACKs. TCP West-wood uses the estimated bandwidth in setting the con-gestion window and slow start threshold (ssthresh) pa-rameters. This is in contrast to regular TCP implemen-tations where the window size is arbitrarily cut in half whenever a loss is detected [6]. This explicit bandwidth estimation scheme is shown to have a positive impact on the performance of TCP Westwood sources, espe-cially in the presence of random, sporadic losses typical of wireless links or over paths with high bandwidth-delay product.
Many proposals tried to classify the losses explic-itlythrough different estimation techniques. For exam-ple, Samaraweera [17] presents a method, called
Non-Congestion Packet Loss Detection (NCPLD), to cate-gorize the nature of the error. It uses the concept of the knee pointof the throughput-load graph at which the network operates at optimum power. If the cur-rent (measured) round trip delay is less than the de-lay threshold at the knee point then the packet loss is assumed to be a wireless loss else it is assumed that congestion (buffer overflow) caused the error.
In [4], Kim et al. present an algorithm called Linear Increase/Multiplicative Decrease with History (LIMD/H). It uses explicit support from the receiver to send the loss rate back to the TCP source. Based on this loss rate, the sender estimates the goodput. If the current goodput is below a certain band around the mean, then the cause of a packet loss is assumed to be congestion, otherwise the cause of loss is attributed to wireless errors. LIMD/H backs off its transmission window less conservatively to wireless losses than to congestion-induced losses.
Our Contribution:
In this paper, we study the fundamental gains and limits of explicit loss labeling techniques. Explicit loss labeling may be advantageous as it provides a clean separation between the process of inferring the cause of a packet loss and the control (recovery) process that may make use of it. To this end, we consider a generic loss labeling technique for which we can vary its accuracy in correctly attributing a packet loss to either congestion or wireless error. We refer to this generic technique asNewReno-LLsince we empower the TCP NewReno version with loss labeling. We have only chosen NewReno as recent measurements show that the majority of TCP implementations are NewReno [14]. NewReno-LLis thus used to cover the spectrum of explicit loss labeling techniques described above. Note that each explicit loss labeling technique arrives in a different way at a particular loss labeling accuracy.We also propose a new explicit loss labeling tech-nique that would result in a certain loss labeling accu-racy under a particular configuration. The motivation behind our proposal is that we assume the variation in round trip times (RTT) and the nature of loss are corre-lated [11]. Therefore, a good estimation of RTT or ob-served delay can help TCP identify wireless losses and in turn TCP could react less conservatively to them. In our estimation technique, we make use of a Flip Flop filter [9] in estimating the average RTT. We use the 3-sigma rule [10] to account for the variance. Note that there are many techniques to estimate the mean and variance but we are interested in one that is sim-ple and sufficiently accurate. The effectiveness of the Flip Flop filter in filtering out transients and capturing persistent conditions was shown in [9]. In this paper,
we re-instantiate the filter to measure RTT and aug-ment it with history information so as to distinguish between congestion and wireless losses, specifically to empower TCP NewReno in wired/wireless networks. We henceforth refer to our loss labeling technique as
NewReno-FF.
The rest of the paper is organized as follows. In Section 2, we propose a loss prediction algorithm (NewReno-FF) to predict the cause of a packet loss. We also describe other schemes against which we com-pare NewReno-FF. In Section 3, we discuss the perfor-mance metrics used to evaluate the various loss pre-dictors. Section 4 presents an analytical model of our generalized loss labeling technique, NewReno-LL. Section 5 argues for convergence to fairness and effi-ciency when a NewReno flow and a NewReno equipped with loss labeling compete in the presence of both congestion-induced and random wireless drops. Sec-tion 6 evaluates the performance of loss predictors us-ing thens-2 network simulator [18]. Section 7 discusses directions for future research and concludes the paper.
2. Evaluated Schemes
2.1. TCP NewReno-LL
TCP NewReno inherently has no loss prediction ability; it considers all losses to be congestion losses. We denote byP[C|C] (P[W|W]), the probability that a loss predictor classifies a packet loss as congestion (wireless) loss given that it is indeed caused by con-gestion (wireless) error [2]. Thus for TCP NewReno,
P[C|C] = 1 andP[W|W] = 0. Ideally we want to have a protocol with P[C|C] ≈ 1 but also high P[W|W] so as to react appropriately based on the type of loss.
P[C|C]≈1 is highly desirable so as not to congest the network. High P[W|W] enables the protocol to avoid taking unnecessary congestion control steps.
To evaluate the limits of TCP NewReno we evaluate it against TCP NewReno equipped with varying loss classification accuracies (LL). In NewReno-LL, on a loss event, the sender reduces its congestion window with probabilityP[C|C] if the loss is a conges-tion one andignoresthe window adjustment with prob-ability P[W|W] if it is a wireless loss. In the perfect loss labeling version, denoted by NewReno-PL, we have
P[C|C] = 1 andP[W|W] = 1. We note that, although we assume fixed values for P[C|C] and P[W|W], in general these values depend on the parameters of the network as well as the loss classification algorithm. Furthermore, ignoring window adjustments in the case of wireless losses is not necessarily optimal. We only consider this control action for simplicity and so as to
gain insight into the fundamental issues. We can imag-ine window adjustments that match particular levels of error.
2.2. TCP NewReno-FF
We propose a new loss labeling scheme for distin-guishing wireless losses from congestion losses. In this scheme, using an adaptive Flip Flop filter [9], a par-allel estimation of RTT is done on every new ACK received in NewReno. TCP usually uses one exponen-tially weighted moving average (EWMA) filter which is static. The Flip Flop filter uses two EWMA filters, one is stable and another is agile. An agile filter is one which gives more weight to recently observed samples unlike a stable filter. The underlying principle is to em-ploy an agile filter whenever possible but switch to the stable one when the RTT samples vary drastically and become noisy. According to statistical quality control, control limits are defined around the current sample mean and when the samples exceed the control limits, the process is said to be out of control. To estimate the deviation, the filter uses a moving range which it estimates from the samples within the control limits. The control limits are defined as:
x±3M R
d2
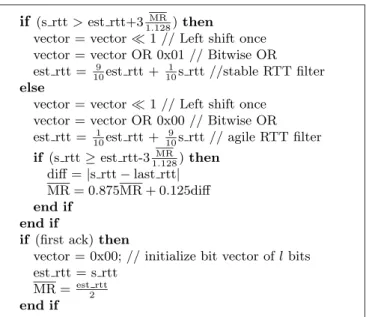
(1) wherexis the sample mean,M Ris the Moving Range which is the average of the differences between adjacent RTT samples,|xi−xi−1|,andd2estimates the standard deviation of a sample given its range. When the range is from a sample of two, as it is forM R,d2≈1.128 [10]. The basic tenet of our approach is that if the pack-ets are suffering congestion losses, the observed RTTs will vary but if packets are suffering random losses, the observed RTTs will not vary much. Using the Flip Flop filter, we define an upper control limit on RTT using (1). We then consider the much delayed pack-ets, whose RTT exceeds the control limit, as “outliers.” More than η outliers in the lastl samples are used as congestion indication. η andlare tunable parameters. The pseudo code of the loss labeling is given in Fig-ure 1.
Modified Recovery Strategy: When NewReno-FF detects a packet loss based on duplicate ACKs1, it checks if the sender has received more thanη outlier samples in the last l samples. If the number of out-liers is more thanη, it continues with usual congestion
1TCP detects loss either due to timeout or three consecutive
duplicate acknowledgments.
if (s rtt>est rtt+3MR 1.128)then
vector = vector¿1 // Left shift once vector = vector OR 0x01 // Bitwise OR est rtt = 9
10est rtt + 1
10s rtt //stable RTT filter else
vector = vector¿1 // Left shift once vector = vector OR 0x00 // Bitwise OR est rtt = 1 10est rtt + 9 10s rtt // agile RTT filter if (s rtt≥est rtt-3 MR 1.128)then diff =|s rtt−last rtt| MR = 0.875MR + 0.125diff end if end if
if (first ack)then
vector = 0x00; // initialize bit vector oflbits est rtt = s rtt
MR = est rtt 2 end if
Figure 1. Flip Flop-based loss labeling control steps otherwise it ignores it assuming a wireless loss. The pseudo code of the modified recovery part of TCP NewReno is given in Figure 2.
if (error detected based on dup acks)then if (#bits set in vector≤η)then
no change in congestion window and ssthresh
// classified as wireless loss
else
do normal congestion window andssthresh ad-justment // classified as congestion loss
end if end if
Figure 2. Modi£ed recovery strategy We are still assuming thatalltimeouts indicate con-gestion, i.e. we do not attempt to classify timeout-detected losses as congestion versus wireless. It is known that timeouts caused by wireless losses can de-grade the performance of regular TCP implementa-tions, which may back off very conservatively [19]. We account for these effects through our TCP NewReno variant with perfect loss labeling.
2.3. TCP Westwood
We have also compared the performance of TCP Westwood which doesn’t have any explicit loss labeling mechanism. However, it is claimed that the bandwidth estimation of TCP Westwood accounts for the wireless losses [12].
3. Performance Metrics
We have compared the schemes described in Sec-tion 2 based on the following metrics:
• Goodput: The rate of delivery of useful data. We measure the goodput at the receiver.
• Overhead: 1-ThroughputGoodput . We measure through-put as the rate at which the receiver is receiving data. Note that this measure reflects the overhead of re-transmissions.
• P[W|W]: This metric indicates the accuracy in wireless loss classification. It defines the probabil-ity of identifying a loss as a wireless loss given that the loss is indeed a wireless loss.
• P[C|C]: This metric indicates the accuracy of con-gestion loss classification. It defines the probabil-ity of identifying a loss as a congestion loss given that the loss is indeed a congestion loss.
• Fairness: Reflects the fair share distribution across
N various connections. It is given by:
Fairness Index = ( N P i=1 Ti)2 N N P i=0 T2 i
where Ti is the throughput of the ith connec-tion [7].
• TCP-compatibility: This metric measures how fair a loss prediction-capable protocol is when it com-petes with regular TCP NewReno. It is defined as
Gh
Go, whereGh is the average goodput attained by nNewReno flows competing withnother flows of the protocol, and Go is the average goodput ofn NewReno flows competing withnother NewReno flows under the same conditions. Thus a value close to 1 indicates compatibility in a heteroge-neous setting. On the other hand, a value less than 1 indicates that the loss prediction-capable protocol is unfairly grabbing more bandwidth.
4. Stochastic Model of NewReno-LL
In this section, we derive a simple fluid model for NewReno-LL to illustrate the effect of P[C|C] and
P[W|W] on throughput. We follow the same lines of analysis as in [5]. For simplicity, we do not consider timeouts. We assume that the transmission window is reduced by half only if the packet loss is identified as congestion-induced.
For a window size of W (packets), the window in-creases by W1 on every ACK reception. This is the
additive increase of TCP. We assume packet loss hap-pens with a probabilityp= 1−(1−pc)(1−pw), where
pc andpw are the congestion and wireless drop rates, respectively. The window decreases by W
2 with proba-bilitypcP[C|C] + (1−pc)pwP[C|W], i.e. whenever the packet loss is classified (or misclassified) as congestion-induced. To make the notation more readable, we de-noteP[C|C] bypc/c andP[C|W] bypc/w.
The expected change in the window is given by:
E[∆W] = (1−pc)(1−pw)
W
−W
2 (pcpc/c+ (1−pc)pwpc/w) (2) Since W is updated at approximately every RT T
W ,
using Equation (2), the expected change in the sending rate (throughput)r per unit time is approximately:2
dr(t) dt = (1−pc)(1−pw) RT T2 − r2(t)(p cpc/c+ (1−pc)pwpc/w) 2 (3)
By rearranging and integrating we have:3
r(t) = n 1+Ce−2at 1−Ce−2at o RT T s 2(1−pc)(1−pw) pcpc/c+ (1−pc)pw(1−pw/w) (4) whereais given by q (1−pc)(1−pw)(pcpc/c+(1−pc)pw(1−pw/w)) 2RT T2 andC depends on initial conditions.
The steady state throughput of NewReno-LL is thus given by: r = lim t→∞r(t) = 1 RT T s 2(1−pc)(1−pw) pcpc/c+ (1−pc)pw(1−pw/w) (5) From Equation (5), we can observe the significance of pc/c and pw/w on the throughput of a connection. A higher value of accurate congestion loss classifica-tion, pc/c, reduces throughput. On the other hand, a higher value of accurate wireless loss classification,
pw/w, increases throughput. Note, however, that we are assuming fixed drop rates and classification proba-bilities. In reality, these loss and classification prob-abilities would depend on the number of competing
2Note thatr(t) =W(t)/RT T. 3Note thatp
connections, network conditions and the behavior of the protocol. In particular, pc, assumed fixed in tra-ditional analytical studies [13], depends onpc/c,pw/w and r. The throughput r in turn depends on pc, pc/c and pw/w. In general, it is very difficult to solve ana-lytically for closed-form expressions for throughput and other performance measures. In Section 6, we resort to simulations to evaluate the effectiveness of loss labeling techniques.
5. TCP-compatibility and Convergence
In this section, we argue that two competing flows, one regular TCP (NewReno) and another TCP equipped with loss prediction (e.g. NewReno-FF), would still converge to fairness and efficiency in the presence of both congestion-induced and random wire-less drops, given that the loss classification is accurate. Assuming ideal synchronized feedback, we use the technique of Chiu and Jain to represent the two-source case as a “phase plot” [3]. The axes correspond to the window sizes of each source. As the system evolves over time, each source adjusts its transmission window based on the network state and the control algorithm leading to a trajectory in the phase space. According to the linear controls of Additive Increase Multiplica-tive Decrease (AIMD), the trajectory moves parallel to the 45o-line during additive increase. During multi-plicative decrease, the trajectory moves along the line joining the current state to the origin. Fairness, defined as the ratio of the windows, improves during additive increase, and remains unchanged during the decrease phase. NewReno-FF NewReno Fairness Line Efficiency Line a b c d e f g h iFigure 3. Convergence of NewReno vs. NewReno-FF
Referring to Figure 3, without loss of generality, suppose NewReno and NewReno-FF start at point a. Both sources linearly increase their windows and both experience congestion drops at point b when the win-dows overshoot the efficiency (maximum capacity) line.
Both the sources then reduce their windows evolving to the under-utilized region but closer to fairness at point c. Subsequently, assume the sources experience wireless drops at points dand f, NewReno-FF avoids unnecessary backoff while NewReno backs off. It is easy to see that, in cases of random wireless drops, NewReno-FF grabs more resources evolving the sys-tem away from the fairness line. However, congestion losses and accurate classification drive the system back toward the fairness line (transition fromhtoi).
The argument can be extended to multiple sources by considering the sources pairwise. Our simulation results in Section 6 substantiate this convergence be-havior.
6. Simulation Model and Methodology
We use the network simulator ns-2 (version 2.1b8a) [18]. The network topology used in the sim-ulation is shown in Figure 4.TCP sources r1 r2 TCP Sinks Cross Traffic
Pareto Traffic Sources Pareto Traffic Sinks Figure 4. Wireless Last Hop Topology We have a number of TCP traffic source-destination pairs. The link from r2 to each TCP traffic sink has been assigned 2Mbps bandwidth and 0.01ms propaga-tion delay. These links represent wireless links with transmission errors. The loss rate on each wireless link is set at 5% to represent low to medium range wireless errors. All other links are error free with 10Mbps band-width and 1ms propagation delay except the shared (bottleneck) wired link r1 → r2 whose bandwidth is 10Mbps and propagation delay is 50ms. The buffer size at r1 → r2 is set to an integer multiple of the bandwidth-delay product (127×n packets for n≥ 1). All other buffer sizes are set to a default value of 50 packets. All the TCP sources and the cross traffic on-off sources are started randomly at time t ∈ [0,3] sec and the simulations are stopped at time 150 sec. For each UDP-based cross traffic source, the duration of the on and off periods are Pareto distributed and varied for each configuration. We calculate the performance measures within 95% confidence intervals.
6.1. Simulation Results
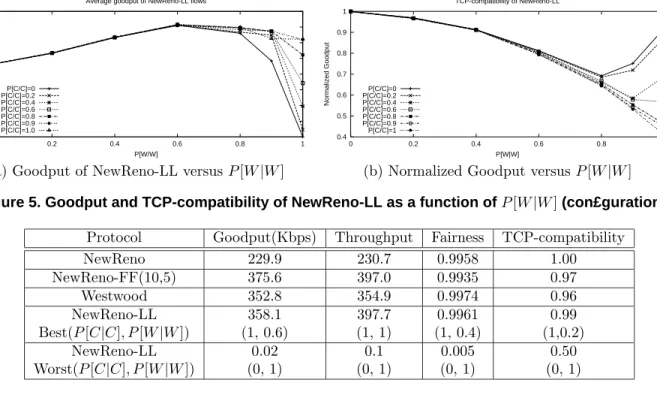
Configuration 1: The on and off periods of each of the 10 background cross traffic sources follow a Pareto distribution with shape parameter 1.5 and av-erage duration of 45ms and 10ms, respectively. The sending rate of each cross traffic source is 0.2 Mbps while it is on, so as to have negligible congestion loss atr1→r2 when all 20 competing long-lived TCP flows are NewReno. The buffer size atr1→r2 is set to four times the bandwidth-delay product. For our loss la-beling technique, the values for l and η are 10 and 5, respectively.4
Figure 5(a) shows the goodput of NewReno-LL against varying P[W|W]. Figure 5(b) shows TCP-compatibility (normalized goodput) when 10 NewReno flows compete with 10 NewReno-LL flows. Table 1 summarizes the performance of different schemes in terms of other metrics (defined in Section 3) when all 20 TCP flows are homogeneous. Recall that NewReno-PL, the perfect loss labeling version, is a special case of NewReno-LL withP[C|C] =P[W|W] = 1.
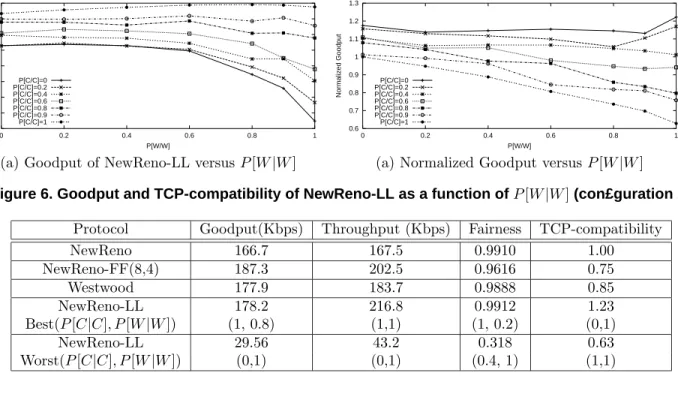
Configuration 2: The on and off periods of each of the 30 background cross traffic sources follow a Pareto distribution with shape parameter 2.5 and average du-ration of 100ms each. The sending rate of each cross traffic source is 0.6 Mbps while it is on, so as to have around 1% congestion loss atr1→r2 when all 10 com-peting long-lived TCP flows are NewReno. The buffer size atr1→r2 is set to the bandwidth-delay product. For our loss labeling technique, the values forl andη
are 8 and 4, respectively.
Figure 6(a) shows the goodput of NewReno-LL against varying P[W|W]. Figure 6(b) shows TCP-compatibility (normalized goodput) when 5 NewReno flows compete with 5 NewReno-LL flows. Table 2 sum-marizes the performance of different schemes in terms of other metrics (defined in Section 3) when all 10 TCP flows are homogeneous.
6.2. Observations and Discussion
• For both configurations, NewReno-FF achieves a goodput higher than that of NewReno, Westwood, and NewReno-LL for all values of P[C|C] and
P[W|W]. Recall that NewReno corresponds to
P[C|C] = 1 and P[W|W] = 0. NewReno-FF
4Recall thatlandη are tunable parameters in our FF-based
loss classification technique. A short history is found to gener-ally improve goodput and TCP-compatibility; see Figure 7. In general,landη depend on the network configuration and may be adjusted dynamically. We leave this as future work.
achieves higher goodput without losing much in terms of fairness index. However, NewReno-FF has higher overhead than NewReno, which has the least overhead.
• Although NewReno-FF adapts its P[C|C] and
P[W|W] values according to the network condi-tions, the average values ofP[C|C] andP[W|W] in both configurations are observed to be lower than one would expect. In configuration 1, the average values of P[C|C] and P[W|W] for NewReno-FF are found to be 0.0 and 0.84, respectively, when all TCP sources are FF. When NewReno-FF flows compete with NewReno flows, the values are 0.0 and 0.61, respectively. Note that in config-uration 1, we intended to have negligible conges-tion. Therefore,P[C|C] indeed shows accurate la-beling bynotclassifying rare (non-persistent) con-gestion events as concon-gestion.
Similarly, for configuration 2, we observe the the average values of P[C|C] and P[W|W] for NewReno-FF to be 0.32 and 0.65, respectively, when all TCP sources are NewReno-FF. When NewReno-FF flows compete with NewReno flows, the values are 0.42 and 0.63, respectively. This means thatP[W|C]≈0.68 and 0.58, respectively. This high value of congestion misclassification probability makes NewReno-FF more aggressive and consequently has the highest goodput. Note that the loss misclassification in NewReno-FF can sometimes be viewed as finer classification—for example, misclassifying short-term congestion as wireless and thus avoiding unnecessary window backoff may be beneficial.
• To justify the lower values ofP[C|C] andP[W|W] for NewReno-FF, we need to reconsider the defi-nitions of the two metrics. The values of P[C|C] andP[W|W] much depend on the agility and sta-bility of the filter. In our experiments, the Flip Flop filter is stable enough to filter out low fre-quency transient changes. The random wireless losses and even short-term congestion losses fall into this category. Therefore, the Flip Flop fil-ter classifies many short-fil-term congestion losses as wireless losses, thus the transmission window is not reduced. Although this “misclassification” lowersP[C|C], this may in fact be a more appriate control strategy. The loss classification pro-cess for a TCP flow is illustrated in Figure 8 for configuration 2. We don’t have timeout cases over the shown time interval.5 We have plotted the
in-5Recall that in this paper, timeouts do not contribute to our
0 50 100 150 200 250 300 350 400 0 0.2 0.4 0.6 0.8 1 Goodput (Kbps) P[W/W] Average goodput of NewReno-LL flows
P[C/C]=0 P[C/C]=0.2 P[C/C]=0.4 P[C/C]=0.6 P[C/C]=0.8 P[C/C]=0.9 P[C/C]=1.0
(a) Goodput of NewReno-LL versusP[W|W]
0.4 0.5 0.6 0.7 0.8 0.9 1 0 0.2 0.4 0.6 0.8 1 Normalized Goodput P[W|W] TCP-compatibility of NewReno-LL P[C/C]=0 P[C/C]=0.2 P[C/C]=0.4 P[C/C]=0.6 P[C/C]=0.8 P[C/C]=0.9 P[C/C]=1
(b) Normalized Goodput versus P[W|W]
Figure 5. Goodput and TCP-compatibility of NewReno-LL as a function ofP[W|W](con£guration 1)
Protocol Goodput(Kbps) Throughput Fairness TCP-compatibility
NewReno 229.9 230.7 0.9958 1.00 NewReno-FF(10,5) 375.6 397.0 0.9935 0.97 Westwood 352.8 354.9 0.9974 0.96 NewReno-LL 358.1 397.7 0.9961 0.99 Best(P[C|C], P[W|W]) (1, 0.6) (1, 1) (1, 0.4) (1,0.2) NewReno-LL 0.02 0.1 0.005 0.50 Worst(P[C|C], P[W|W]) (0, 1) (0, 1) (0, 1) (0, 1)
Table 1. Comparison of performance metrics for different schemes (con£guration 1) stantaneous queue length of the shared wired link,
the instances of queue (congestion) drops, wireless drops, and duplicate ACKs.
20 40 60 80 100 120 140 160 180 145.5 146 146.5 147 147.5 148 Scaled Metric Time(sec) C1 C2 C3 W1 W2 W3 D1 D2 D3 queue length queue drop Wireless Drop Dupack Timeout Sample RTT
Upper Control Limit
Figure 8. TCP dynamics (con£guration 2). Ac-tual RTT values (in secs) are 1/900 times what is shown on the y-axis
When the queue dropC1 happens at 145.706 sec, the last l samples are below the threshold η of our loss labeling technique, therefore window ad-justment is not done on the duplicate ACK, D1 at 146.001 sec. Observe that this action seems
appropriate as the queue length drops indicating that congestion has subsided. In effect, the filter classifies this to be a case of “transient” congestion loss whereas NewReno would have simply reduced
the ssthresh and congestion window. The error
detection event based on duplicate ACKs, D2 at 146.43 is caused by a wireless drop,W1 but since the history of not enough outliers is there, this wireless loss will be correctly classified as a wire-less loss and the congestion window is not reduced in this case.
As congestion builds up, many samples may be detected as outliers and if the congestion is persis-tent, the number of samples arriving at the sender will reduce. Therefore, outliers appearing in the growing phase of the bottleneck queue will retain the bad history for long if the values oflandηare chosen properly. On the other hand, if the con-gestion is transient, more samples will arrive sub-sequently and the bad history can soon be shaken off. The queue drop,C2 in Figure 8, is preceded by more than η outlier samples, therefore, the fil-ter classifies the loss as congestion atD3, thus the transmission window is reduced. From the buffer occupancy, we can see that it is appropriate to be conservative onD3.
20 40 60 80 100 120 140 160 180 0 0.2 0.4 0.6 0.8 1 Goodput (Kbps) P[W/W] Average goodput of NewReno-LL flows
P[C/C]=0 P[C/C]=0.2 P[C/C]=0.4 P[C/C]=0.6 P[C/C]=0.8 P[C/C]=0.9 P[C/C]=1
(a) Goodput of NewReno-LL versusP[W|W]
0.6 0.7 0.8 0.9 1 1.1 1.2 1.3 0 0.2 0.4 0.6 0.8 1 Normalized Goodput P[W/W] TCP-compatibility of NewReno-LL P[C/C]=0 P[C/C]=0.2 P[C/C]=0.4 P[C/C]=0.6 P[C/C]=0.8 P[C/C]=0.9 P[C/C]=1
(a) Normalized Goodput versusP[W|W]
Figure 6. Goodput and TCP-compatibility of NewReno-LL as a function ofP[W|W](con£guration 2)
Protocol Goodput(Kbps) Throughput (Kbps) Fairness TCP-compatibility
NewReno 166.7 167.5 0.9910 1.00 NewReno-FF(8,4) 187.3 202.5 0.9616 0.75 Westwood 177.9 183.7 0.9888 0.85 NewReno-LL 178.2 216.8 0.9912 1.23 Best(P[C|C], P[W|W]) (1, 0.8) (1,1) (1, 0.2) (0,1) NewReno-LL 29.56 43.2 0.318 0.63 Worst(P[C|C], P[W|W]) (0,1) (0,1) (0.4, 1) (1,1)
Table 2. Comparison of performance metrics for different schemes (con£guration 2)
• NewReno with Perfect Labeling (NewReno-PL) is not necessarily optimal in terms of goodput. Al-though it seems reasonable to take a control ac-tion (such as ignoring window adjustment in wire-less loss cases) based on the exact nature of a
pastloss (as in NewReno-PL), such control action may not always be correct or may not yield better performance globally. This is because of the de-layed feedback. By the time the feedback reaches the senders, the actual network state might have changed.
In NewReno-LL, on a loss event, the senders re-duce their transmission window with probability
P[C|C] if the loss is a congestion one, and ignore window adjustments with probability P[W|W] if it is wireless loss. Such randomization of the con-trol actions may improve goodput by making the system more robust—for example, if the conges-tion loss was transient, then having some sources misclassifying it as wireless and thus not backing off their transmission rate may be beneficial. • NewReno-LL can achieve highest goodput at
P[C|C] = 1 and high P[W|W]. However, NewReno-LL performs poorly for lowP[C|C] and
P[W|W] = 1. Unlike NewReno-FF, P[C|C] and
P[W|W] for NewReno-LL are artificially static and do not depend on network conditions. This causes NewReno-LL to be overly aggressive, thus overloading the network and degrading its own performance. This is apparent from the degra-dation in goodput as P[W|W] exceeds a value of around 0.8 in configuration 1 and 0.6 in con-figuration 2. We also observe from the TCP-compatibility measure that beyond thoseP[W|W] values, a low P[C|C] causes NewReno-LL to ex-perience excessive losses, losing its self-clocking of new packets, hence giving up more bandwidth to competing regular NewReno flows.
• Table 2 also shows increased aggressiveness in the behavior of NewReno-FF evidenced by low TCP-compatibility when it competes with regular NewReno. Unlike regular NewReno, a NewReno-FF flow does not back off its transmission win-dow if it classifies a loss as wireless. Otherwise, NewReno-FF cuts its window in half according to regular AIMD rules. For any AIMD scheme to be TCP-compatible, the window increase and decrease parameters, α and β, must satisfy the necessary condition of TCP-friendliness given by
α= 23−ββ (without considering the timeout effects) [8].
176 176.5 177 177.5 178 178.5 179 179.5 0 2 4 6 8 10 12 14 16 18 20 Goodput(Kbps) η
Effect of history on goodput of NewReno-FF
l=10 l=14 l=18 l=22 l=26 l=30 l=34 l=38
(a) Goodput as a function of landη
0.8 0.81 0.82 0.83 0.84 0.85 0.86 0 2 4 6 8 10 12 14 16 18 20 Normalized Goodput η
Effect of history on TCP-compatibility of NewReno-FF
l=10 l=14 l=18 l=22 l=26 l=30 l=34 l=38
(a) TCP-compatibility as a function ofl andη
Figure 7. Effect of history on goodput and compatibility of NewReno-FF (con£guration 2) If loss labeling is not perfectly accurate, the
effec-tive value ofβ, denoted byβe, is given by:
βe= 12(P[C|C]+P[C|W])+0(P[W|W]+P[W|C]). For a perfect labeling case, we have P[C|C] = 1 and P[C|W] = 0, which implies βe = 1/2 and
α= 1 as in regular TCP. However, in our configu-rations, NewReno-FF shows a lowerβeand hence a lowerαshould be used when the window is lin-early increased.
Figures 9(a) and (b) show the window dynamics of a NewReno flow competing with a NewReno-FF flow. The aggressiveness of NewReno-NewReno-FF is re-duced, hence TCP-compatibility can be improved, for a lower increase parameter,α.
7. Conclusions and Future Work
In this paper, we attempted to improve our un-derstanding of the fundamental gains and limitations of loss classification techniques employed to empower TCP in hybrid wired/wireless networks. To this end, we abstract the general approach of various proposals by controlling the loss labeling accuracies,P[C|C] and
P[W|W]. These two measures quantify the probability that an event is identified correctly. In all proposals, this event is only one of two possibilites: congestion-induced loss or wireless loss. Such loss classification can be used to empower the recovery strategy of TCP. For example, the usual congestion control measure of backing off the transmission rate is taken if the packet loss is attributed to congestion. However, if the packet loss is attributed to wireless, a different control action is taken— in this paper, we assume an aggressive strat-egy whereby the transmission rate is kept unchanged.
We also introduced a new loss labeling technique that uses a Flip Flop filter to estimate RTT and use it to differentiate between congestion and wireless loss.
Our technique uses history to examine the number of “outlier” RTT samples, i.e. those samples that exceed a control limit beyond which delay values are considered high. A packet loss is classified as congestion-induced if enough outliers are observed.
Through extensive simulations, we show that our loss labeling-based technique outperforms regular TCP and TCP Westwood in terms of goodput while main-taining competitive fairness. We also observe the low values of P[C|C] and P[W|W] under our Flip Flop based technique. This does not mean that our FF-based classification is inaccurate. Rather, the low value of P[C|C] implies a higher value of P[W|C].This is the case when short-term congestion losses are treated as random wireless losses or more generally, transient
losses. This is indeed an appropriate (in effect, finer grained) loss classification. Based on these observa-tions, we believe that there is a need for such fine grained classification that goes beyond a binary clas-sification of congestion versus wireless. Furthermore, this opens up the important research question of what kind of recovery actions should a protocol like TCP im-plement given the correct classification of packet losses. We are currently analyzing our FF-based loss clas-sification technique mathematically. We are also gen-eralizing this analysis to any technique as a function of
P[C|C] andP[W|W], or finer classification accuracies. We again note that the values ofP[C|C] andP[W|W] depend on the parameters of the network as well as the loss classification algorithm. The ultimate goal is to de-velop a fine grained loss classification technique with an associated adaptive recovery strategy which enhances goodput and fairness while maintaining low overhead and high compatibility over hybrid wireless/wired net-works. An ideal recovery strategy would match the level and density of error to appropriate transmission window adjustments. Lowering overhead is especially important for battery-operated devices.
0 2 4 6 8 10 12 14 16 18 20 22 35 36 37 38 39 40 41 42 43 44 Congestion Window (pkts) time (sec)
Convergence behavior of NewReno-FF and NewReno cwnd1 cwnd2 D1 D2 W1 W2 C1 C2
(a) NewReno-FF (α= 1.0) competing with NewReno 0 2 4 6 8 10 12 14 16 18 20 22 167 168 169 170 171 172 173 174 175 176 Congestion Window (pkts) time (sec)
Convergence behavior of NewReno-FF and NewReno
cwnd1 cwnd2 D1 D2 W1 W2 C1 C2
(b) NewReno-FF (α= 0.8) competing with NewReno Figure 9. Convergence of NewReno-FF (solid line) and NewReno (dashed) for con£guration 2. Rate of each cross traf£c source changed to 0.6Mbps and loss rate on each wireless link 2%.
cwnd1, D1, W1, C1(cwnd2, D2, W2, C2) indicate the window and instances of dup acks, wireless and congestion drops of NewReno-FF (NewReno)
References
[1] H. Balakrishnan, S. Seshan, and R. Katz. “Improving Reliable Transport and Handoff Performance in Cel-lular Wireless Networks”. IEEE/ACM Wireless Net-works, 1(4), December 1995.
[2] S. Biaz and N. Vaidya. Distinguishing Congestion Losses from Wireless Transmission Losses: A Negative Result. In IC3N: Seventh International Conference on Computer Communications and Networks, New Or-leans, October 1998.
[3] D. Chiu and R. Jain. “Analysis of the In-crease/Decrease Algorithms for Congestion Avoidance in Computer Networks ”. Journal of Computer Net-works and ISDN, 17(1):1–14, June 1989.
[4] T. eun Kim, S. Lu, and V. Bharghavan. “Improving Congestion Control Performance Through Loss Differ-entiation”. InICCCN 1999: Eighth International Con-ference on Computer Communications and Networks, Boston, MA, October 1999.
[5] L. A. Grieco and S. Mascolo. “TCP Westwood and Easy RED to Improve Fairness in High-Speed Net-works”. In Seventh International Workshop on Pro-tocols For High-Speed Networks (PfHSN’2002), Berlin, Germany, April 2002.
[6] V. Jacobson. Congestion Avoidance and Control. In
ACM SIGCOMM Conference, Stanford, CA, August 1988.
[7] R. Jain, D.-M. Chiu, and W. Hawe. A Quantitative Measure of Fairness and Discrimination for Resource Allocation in Shared Computer Systems. Technical re-port, DEC Research Report TR-301, September 1984. [8] S. Jin, L. Guo, I. Matta, and A. Bestavros. TCP friendly SIMD Congestion Control and Its Conver-gence Behavior. In Proceedings of ICNP’2001: The 9th IEEE International Conference on Network Pro-tocols, Riverside, CA, November 2001.
[9] M. Kim and B. Noble. “Mobile Network Estima-tion”. InMobicom 2001: The Seventh Annual Interna-tional Conference on Mobile Computing and Network-ing, Rome, Italy, July 2001.
[10] D. C. Montgomery.“Introduction to Statistical Quality Control”. John Wiley & Sons, New York, 1985. (1st edition, 1985, 2nd edition, 1991).
[11] S. B. Moon.Measurement and Analysis of End-to-End Delay and Loss in the Internet. PhD thesis, University of Massachussets at Amherst, February 2000.
[12] S. Morris and C. Casetti. “TCP Westwood: Band-width Estimation for Enhanced Transport over Wire-less Links”. In MobiCom 2001: The Seventh Annual International Conference on Mobile Computing and Networking, Rome, Italy, July 2001.
[13] J. Padhye, V. Firoiu, D. Towsley, and J. Kurose. Mod-eling TCP Throughput: A Simple Model and its Em-pirical Validation. In ACM SIGCOMM Conference, Vancouver, British Columbia, September 1998. [14] J. Padhye and S. Floyd. “On Inferring TCP
Behav-ior”. InACM SIGCOMM Conference, San Diego, CA, August 2001.
[15] C. Parsa and J. Garcia-Luna-Aceves. “Differentiating Congestion vs. Random Loss: A Method for Improv-ing TCP Performance over Wireless Links”. InWCNC 2000: IEEE Wireless Communications and Network-ing Conference, pages 23–28, Chicago, IL, September 2000.
[16] K. Ratnam and I. Matta. “WTCP: An Efficient Mech-anism for Improving TCP Performance over Wire-less Links”. InISCC 1998: Proceedings of the Third IEEE Symposium on Computers and Communications, Athens, Greece, July 1998.
[17] N. Samaraweera. “Non-congestion Packet Loss Detec-tion for TCP Error Recovery using Wireless Links”. InIEE Proceedings Communications, volume 146 (4), pages 222–230, August 1999.
[18] The Network Simulator – ns-2. http://www.isi.edu/nsnam/ns.
[19] V. Tsaoussidis and I. Matta. Open Issues on TCP for Mobile Computing. Journal of Wireless Communica-tions and Mobile Computing – Special Issue on Reli-able Transport Protocols for Mobile Computing, 2(1), February 2002.