1
Evaluation of Multi-Touch Tabletop Collaborative Application Interfaces
by
Mohanad Hafiz Suliman Elhag 12247
Dissertation submitted in partial fulfilment of the requirements for the
Bachelor of Technology (Hons)
(Information and Communication Technology)
SEPTEMBER 2014
Universiti Teknologi PETRONAS
Bandar Seri Iskandar
31750 Tronoh
CERTIFICATION OF APPROVAL
EVALUATION OF MULTI-TOUCH TABLETOP COLLABORATIVE APPLICATION INTERFACES
by
Mohanad Hafiz Suliman Elhag
A project dissertation submitted to the
Information and Communication Technology Program Universiti Teknologi PETRONAS
In partial fulfilment of the requirement for the BACHELOR OF TECHNOLOGY (Hons) (Information and Communication Technology)
Approved by,
(Dr. Suziah Bt Sulaiman)
UNIVERSITI TEKNOLOGI PETRONAS TRONOH, PERAK
CERTIFICATION OF ORIGINALITY
This is to certify that I am responsible for the work submitted in this project, that the original work is my own except as specified in the references and acknowledgments, and that the original work contained herein have not been undertaken nor done unspecified sources or persons.
ABSTRACT
Involving potential users in application interfaces design allows us to identify key issues that can be addressed in the interfaces design. This work tends to evaluate Tabletop application interfaces. It aims to figure out how involving users can enhance and optimize collaboration applications interface design. In this work, the test methodology was explained by undertaken pilot study, followed with user testing.
The objectives of this report are to choose tabletop application interfaces that could support collaborative work, to conduct user testing on the interfaces chosen, and finally to propose design recommendations based on the these findings.
Expected findings will be collected using users’ testing methods which include preparing test plan, creating users’ tasks, recruiting users which they are required to complete several list of tasks having them interact with selected applications and record their interaction, analyze test findings. A list of recommendations will be drafted and the more usable smart device will be established.
The overall process was timed in order to measure the task completion speed and effectiveness of the task list completion obtained by the participants. The sample size is thirty participants where each user test may take up to fifteen minutes. All feedback given by the users will be recorded and analyzed to achieve the research objectives. Initial findings indicate that evaluating tabletop application interfaces is a complex process which requires deep analysis of the users’ behaviors toward these applications.
There will be no software development at the end of this project thus; this project will be heavy investment into the process of testing and analyzing the findings. There will also be a quantitative set of guidelines to improved interfaces design. The test will be user-centered, giving the user more influence in the outcome of the research.
ACKNOWLEDGEMENT
First and foremost, I pray to God the Almighty for his love and blessings, giving me all the strength to complete the final year project.
I am indebted to many individuals who had directly or indirectly involved in helping me for this project. Hence, I would like to express my greatest gratitude to my respected supervisor Dr. Suziah Bt Sulaiman. Without her guidance and patience, I would not succeed to complete the project.
Last but not least, I would like to thank my parents, my friends and my colleagues for their guidance, advices and support I had from them all.
Contents
ABSTRACT ... 4 ACKNOWLEDGEMENT... 5 CHAPTER 1INTRODUCTION ... 9 1.1 Background of Study ... 9 1.2 Problem Statement ... 111.3 Objectives and Scope of Study ... 12
1.4 The Relevancy of the Project ... 12
1.5 Feasibility of the Project within the Scope and Time Frame ... 11
CHAPTER 2 LITERATURE REVIEW ... 13
2.1 Collaborative Work ... 13
2.2 Objectives and Scope of Study Multi-touch Displays ... 11
2.3 Existing Multi-touch Tabletop Collaborative Applications ... 17
2.4 Human Compter Interaction Evaluation Methods ... 11
CHAPTER 3 METHODOLOGY ... 26
3.1 Research Methodology ... 20
3.2 Quantitative Analysis ... 21
3.3 Qualitative Analysis ... 22
3.4 Experimental Phase ... 22
3.5 Analyze the Findings ... 22
3.6 Project Timeline (Gantt Chart) ... 23
CHAPTER 4 RESULTS & DISCUSSION ... 26
4.1 Results ... ………24
4.2 Single User Interaction ... 24
4.3 Multi – Users (Pair) Interaction ... 37
4.4 Discussion ... 44
CHAPTER 5CONCLUSION & FURTHER RESEARCH ... 45
5.2 Further Research ... 45
5.3 Suggested Improvements ... 46
References…..………… ..………...……47
Appendix I……… …..……… ……….………...……49
List of Figures
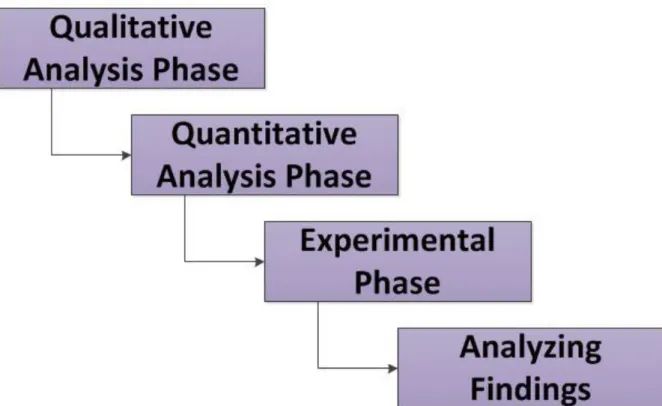
Figure 3.1 Research Methodologies 22
Figure 4.1 Distribution of participants based on gender 28
Figure 4.2 Distribution of participants based on age 28
Figure 4.3 Distribution of participants based on educational level and program 29
Figure 4.4 Distribution of participants based on duration of using computer 30
Figure 4.5 Distribution of participants based on the experience of using Operating Systems 30
Figure 4.6 Summary of total time spent by single users in each application 31
Figure 4.7 Summary of task success rate per User in Scatter Puzzle application 35
Figure 4.8 Summary of task success rate per user in Photo Paint application 38
Figure 4.9 Summary of task success rate per user in Bing “Image” application 41
Figure 4.10 Summary of total time spent by multi-user in each application 42
Figure 4.11 Summary of task success rate par pair of users in Scatter Puzzle application 44 Figure 4.12 Summary of task success rate per pair of users in Photo Paint application 46 Figure 4.13 Summary of task success rate par pair of users in Bing “Image” application 48 List of tables Table 2.1 Examples of Multi-Touch Tabletop Displays 17
Table 2.2 Examples of Tabletop applications 18
Table 3.1 Description of the chosen applications 23
Table 3.2 Main task those are required to be performed by users 24
Table 3.3 Project timeline 26
Table 4.1 Total time spent of user testing 32
Table 4.2 User success rate in completing required task in Scatter Puzzle application. 33 Table 4.3 Comparison of the user average spent time to complete required task 34
Table 4.4 Detailed summary of the success rate in completing task Photo Paint 35
Table 4.5 Comparison of the user average spent time to complete required task 36
Table 4.6 User success rate in completing required task in Bing “Image” 38
Table 4.7 Comparison of the single user average spent time to complete task 40
Table 4.8 Total time spent on Multi user testing 42
Table 4.9 User success rate in completing required tasks in Scatter Puzzle 43
Table 4.10 Comparison of the Multi User average spent time to complete tasks 43
Table 4.11 Users success rate in completing required task in Photo Paint application 44 Table 4.12 Comparison of the Multi User average spent time to complete tasks 45
Table 4.13 Users success rate in completing required tasks in Bing “Image” applications 47
CHAPTER 1
INTRODUCTION
1.1 Background of Study
This dissertation is built on the field of Human-Computer Interaction (HCI), which is concerned with the study of the technology that supports collaborative activities from user’s perspective. Identifying design issues relevant to collaborative interfaces on selected applications by involving actual users to evaluate their interactions with these applications, and present their test outcome. This work will be concluded by proposing designing recommendations and identifying directions for future research on collaborative interaction techniques.
Nowadays, interactive applications are used in all domains and sectors. Therefore, obtaining usable and useful applications became an increasing challenge faced by Human-Computer Interaction (HCI) community. This challenge became more and more important especially when it involves collaborative aspects. Therefore, the HCI community has elaborated numerous works during the last two decades. Such works aim partially to promoting user interface utility and usability tools and approaches for UI design and evaluation. The techniques of evaluation can be classified following different criteria.
With the initiation of tabletop interaction, collaborative activities are better supported than they are on single-user PCs because tabletops provide a shareable physical space, and interaction with digital data is more embodied and socialized. User testing used to evaluate the interaction of the human with the computers for the purpose of identifying aspects of this interaction so that they can be optimized and improved to increase user’s usability. Involving users is a standard practice in the field of Human – Computer Interaction as a way of understanding user’s point of view by assessing their interaction and visualization methods with computerized system.
However, the adoption of user involvement within visualization has taken some time because it has some unique challenges. Part of the reason is that Software Engineering community in the past 30 years has taken quick steps towards changing our lives both in both of our professional and private life. Technology is developed to be used by the masses and much of the developed technology is not as easy to use as it should be.
The test situation consists of a voluntary participants thinking out loud while performing tasks using the selected applications. An evaluator analyzes the user’s interaction with these applications and detects usability problems; evaluator arranges the usability test and manages technical aspects of the study as well as communication with the user. When usability test sessions have been completed, findings will be analyzed and recommendations based on these findings will be proposed to improve the interfaces design.
1.2 Problem Statement
1.2.1 Problem Identification
Tabletop applications are designed to give their users a new experience of combining real-world work surfaces with computational interaction, allowing them to collaborate over multi-touch displays while they are still maintaining a co-located face-to-face working style. These applications have several advantages in defining new ways of collaborative interaction between multiple users simultaneously. However, users get frustrated when interacting with tabletop applications because these applications are not meeting their expectations due to the focusing of software developers on software functionality development with less emphasis on the importance of interface.
1.2.2 Significant of the Project
This project focuses on identifying usability problems that users my encounter when using tabletop applications. 30 voluntary participants will be tasted on three collaborative applications on Microsoft Pixel Sense tabletop. The findings obtained from the users shall be analyzed and proper designing recommendation will be included to enhance users’ performance.
1.3 Objectives and Scope of Study
1.3.1 Objectives
To choose tabletop application interfaces that could support collaborative work.
To conduct user testing on the interface chosen.
To propose design recommendations based on the findings of the users testing.
1.3.2 Scope of Study
The concern of this project is to enhance the performance of user experience on selected applications. Microsoft Pixel Sense is the domain of the project. The systems that will be evaluated have different tasks which required the user to perform in order achieve the required tasks.
1.3.2.1 Tools
Microsoft Pixel Sense allows a display to recognize fingers, hands, and objects placed on the screen, enabling vision-based interaction without the use of cameras. The individual pixels in the display see what's touching the screen and that information is immediately processed and interpreted.
1.3.2.2 Participants
The participants are ideally recruited from the target end user groups. Thus, 30 UTP students from diverse educational background will be participated in the Usability Evaluation Methods.
1.4 The Relevancy of the Project
Currently, most user interfaces in Tabletop are evaluated through techniques that require UI expertise. In heuristic evaluation, UI specialists study the interface in depth and look for properties that they know, from experience, will lead to usability problems. In addition, they may carry out usability testing, in which the interface is studied under real-world or controlled conditions, with gathering data on problems that arise during its use. These tests can offer excellent opportunities for observing how well the situated interface supports collaborative environment for users.
1.5 Feasibility of the Project within the Scope and Time Frame
This project includes literature review; background of the project is studied, evaluating the selected application interfaces with 30 participants to enhance the user experience based on the result of the evaluation. Writing of the Final report, the project can be easily done during this time border.
Thus, the development of this project is technically feasible; all the resources needed to conduct this project are available. Thus, this project can be easily done during the time border.
CHAPTER 2
LITERATURE REVIEW
2.1 Collaborative Work
With growing complexity of computerization in most recent era, interaction between humans and computerized systems has shifted from humans using computerized tools to humans and computerized systems “collaborating” with each other. [1]
L.G Terveeen [2] stated that collaboration is a process in which two or more agents work together to achieve shared goals. Moreover, Collaboration is involving at least one human and one computational agent.
Unlike S. Puntambekar [3] who defined collaboration as a process, in which two or more participants of one organization or different organizations will communicate and interact dynamically, self-adaptively and interdependently for a common aim or task. In collaborative interaction activity, each individual brings his own divergent information, knowledge and understanding into a collaborative environment, and this information, knowledge and understanding will be shared with the other participants via collaborative interaction.
The most important goal of collaborative interaction is to transfer collaboration to cooperation. Group of users often have shared information needs for example, business colleagues need to conduct research relating to joint projects and students must work together on group homework assignments.
Analysis of collaboration tends to focus on verbal and physical behaviors that people use to mediate collaborative activity [4]. The amount and type of explicit communication can indicate the degree of collaboration [5]. A study [6] suggests various types of talk patterns are important in collaborative activities around
tabletops. Jamil et al. [7] discuss how different tabletop designs lead to different talk patterns during collaborative activity. Similarly, Harris et al. [8] present results from a comparative study of multiple-touch on a tabletop activity. Physical interaction is also important in collaboration analysis. In a study presented by Hornecker et al. [9], they demonstrated that large tabletop provided users with opportunities to organize objects physically in space in order to support collaborative activity. The size of the surface also allowed each member to be visually aware of other members’ activities.
The ability to collaborate has long been a key to the successful completion of tasks. With the availability of current networking and computing power, the creation of Collaborative Working Environments has allowed for this process to open up new possibilities to solve problems.
2.1 Multi-touch Displays
There is much motivating work reflecting the role of multi-touch in enhancing collaborative interaction. However, for the purposes of this project, the use of multi-touch tables to enhance collaborative interaction is considered.
The possibility of multi-touch technology is to enable collaboration interactions, which allow small groups to interact simultaneously. This possibility might be a result of the ability of multi-touch tables to provide equal opportunities for collaboration in group work [9].
Multi-touch displays are suitable for information visualization when a group of people collaboratively use the information to work together and achieve a single goal. The group interactions that result from using multi-touch display can be highly valuable. Tabletop interfaces can provide a large shared display while concurrently accommodating natural and direct interaction from multiple users through touch detection [10].
M. R. Morris [1] conducted a research study to investigate the effectiveness of utilizing multi-touch tabletops to enhance collaboration during group interaction. The finding was that multi-touch tabletops were particularly useful in enhancing
group awareness. As a result multi-touch tabletops enhance knowledge and experience sharing among group members.
Harris et al [11] observed in another study the variation in group task performance between single and multi-touch tabletops. Multi-touch tabletops enhance task performance, unlike single-touch tabletops. For example, people can achieve more results together than they could do working alone, yet, people can develop social and communication skills working with others. Awareness was distinguished as one core dimension of collaboration and it was defined as an ability of individuals working together to gain some level of understanding about each other's activities and context. Individuals are being informed through awareness about specific aspects of group members, such as where group members are, what they are doing, what they are interested in, and so on
2.1.1Benefits of using multi-touch technology
Many studies have shown the benefits of using Multi-touch technology to enhance collaborative interaction. It is a promising technology that can facilitate collaborative work. They offer new possibilities for interaction between human and computers. Researches from different educational backgrounds are exploring this and they indicated that multi-touch environments can be successful due to the intuitively and neutrality of the human interaction through touch. [12]
It has the future to replace traditional input devices with an “invisible” interface that enables new opportunities of interacting between multi-touch technology and humans. Being able to “thumb through” a stack of digital papers provides compelling experience that ensembles interaction with physical objects, while at the same time providing users with the functionality of digital tools. Moreover, large displays interface allow multiple users to interact with the same device simultaneously. [13].
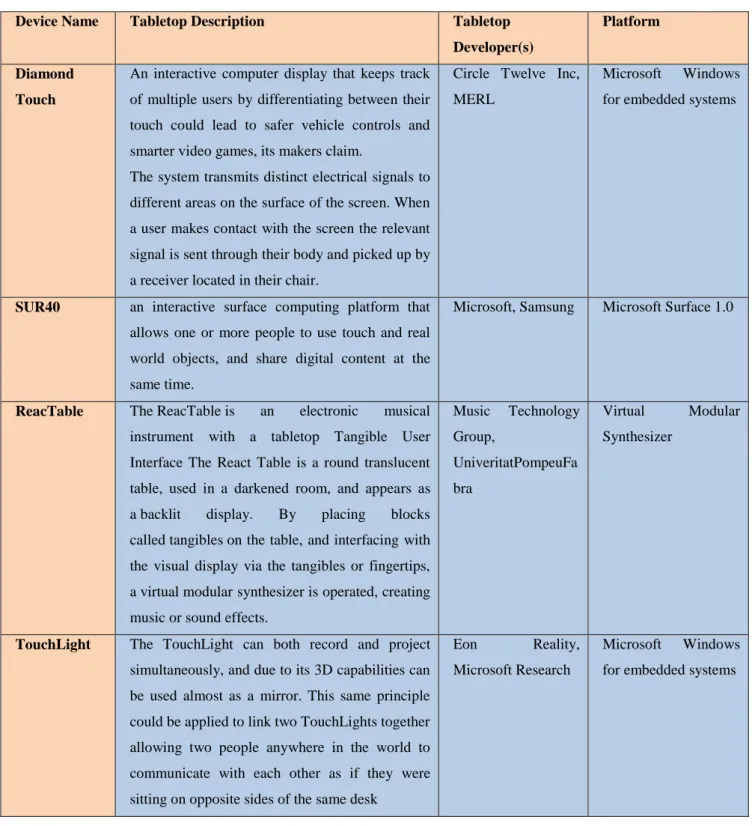
Table 2.1: Example of Multi-Touch tabletop Display Device Name Tabletop Description Tabletop
Developer(s)
Platform
Diamond Touch
An interactive computer display that keeps track of multiple users by differentiating between their touch could lead to safer vehicle controls and smarter video games, its makers claim.
The system transmits distinct electrical signals to different areas on the surface of the screen. When a user makes contact with the screen the relevant signal is sent through their body and picked up by a receiver located in their chair.
Circle Twelve Inc, MERL
Microsoft Windows for embedded systems
SUR40 an interactive surface computing platform that allows one or more people to use touch and real world objects, and share digital content at the same time.
Microsoft, Samsung Microsoft Surface 1.0
ReacTable The ReacTable is an electronic musical instrument with a tabletop Tangible User Interface The React Table is a round translucent table, used in a darkened room, and appears as a backlit display. By placing blocks called tangibles on the table, and interfacing with the visual display via the tangibles or fingertips, a virtual modular synthesizer is operated, creating music or sound effects.
Music Technology Group, UniveritatPompeuFa bra Virtual Modular Synthesizer
TouchLight The TouchLight can both record and project simultaneously, and due to its 3D capabilities can be used almost as a mirror. This same principle could be applied to link two TouchLights together allowing two people anywhere in the world to communicate with each other as if they were sitting on opposite sides of the same desk
Eon Reality, Microsoft Research
Microsoft Windows for embedded systems
2.3 Existing Multi-touch Tabletop Collaborative Applications
Tabletop displays for collaborative workspaces introduce a new set of challenges. Applications for desktop computing are traditionally designed for a single user, while tabletop displays are ideally suited to support multiple users on one site working shoulder to shoulder.
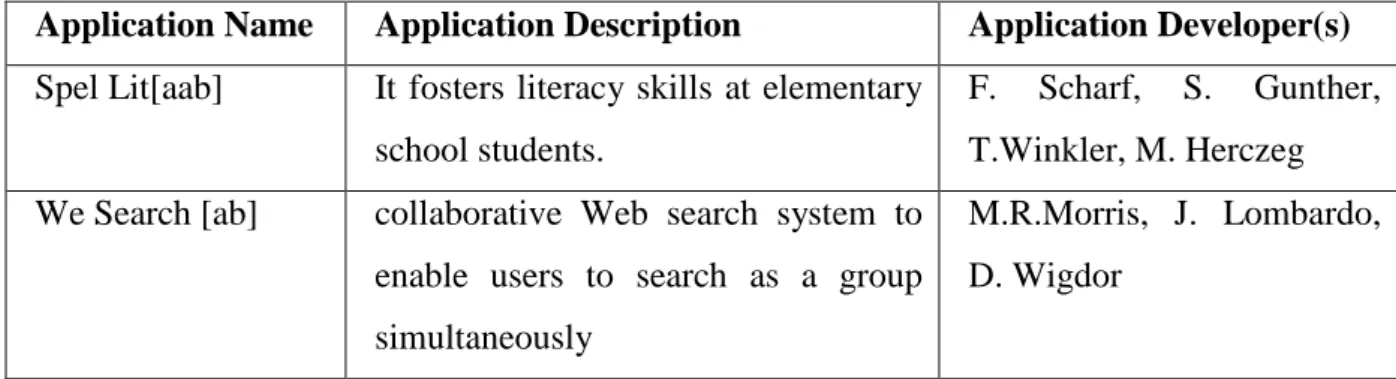
Table 2.2: Example of Tabletop applications
Application Name Application Description Application Developer(s) Spel Lit[aab] It fosters literacy skills at elementary
school students.
F. Scharf, S. Gunther, T.Winkler, M. Herczeg We Search [ab] collaborative Web search system to
enable users to search as a group simultaneously
M.R.Morris, J. Lombardo, D. Wigdor
2.4 Human Computer Interaction Evaluation Methods
Human-computer interaction is the study of people, computer technology and ways these guide each other. Human-computer interaction governs how we can get the most of this technology. This required us an understanding of at least three things: the computer technology, the people who interact with it and what is meant by more usable. We need to assess our designs and test our systems to ensure that they actually behave as we expect and meet the requirements of the user. This is the role of evaluation
The HCI of one person using one computer is the mental computing, but the collaborative interaction is the social computing. So, to “collaborative interaction”, the “interaction” is a process which is form data awareness in physical space to information awareness in information space and arriving to the cognitive space of human. The “collaborative” is an activity that multiple implement the interaction process in social space. Collaborative interaction link the collaboration in social layer to the common HCI involved with physical layer, information layer and
cognitive layer. The four-layer hierarchy model is shown in organization composed of multiple. The participants in the organization will interact with the computers together, but as different roles. Computers afford the needs in collaborative activity to the participants through the groupware, which can achieve the share of awareness, understanding and knowledge.
From a computer science perspective, the focus is on interaction and specifically on interaction between one or more humans and one or more computational machines. The classical situation that comes to mind is a person using an interactive graphics program on a workstation. But it is clear that varying what is meant by interaction, human, and machine leads to a rich space of possible topics, some of which, while we might not wish to exclude them as part of human-computer interaction, we would, nevertheless, wish to identify as peripheral to its focus. Other topics we would wish to identify as more central.
WeixiangXu and Xumin Liu suggest [14] that evaluation should not be considered as a single phase in the development life cycle. In an ideal world, evaluation should occur throughout the entire system development life cycle especially in the maintenance phase, with the results of the evaluation feeding back into modifications to the design. Generally, evaluation has three goals: to assess the extent of the system’s functionality, to evaluate the effect of the interface on the user, and to detect any specific, defects in the system.
[15] Explains the concern of Human – Computer Interaction originates in the need to exploit scientific–technical innovations for the human tool-using activities. It aims at improving the appropriateness of the technological solutions.
The interaction between user and computer has drawn researchers’ attention for some time. It is assumed that strong participation of potential users in the design of system development and maintenance would lead to successful outcomes in terms of usage, greater user acceptance, and increased user satisfaction.
2.4.1 Analytical Approach
Evaluators use the resources provided by Heuristic Evaluation to identify weak elements of a design from users’ point of view.
2.4.1.1 Heuristic evaluation
Heuristic evaluation is a method to evaluate any user interface (UI) by using a list of heuristics or guidelines. Ideally, two or three people independently evaluate the UI using the heuristics so that the usability issues that each person finds can be compared.
Aesthetic and minimalist design: Dialogues should not contain information which is irrelevant or rarely needed. Every extra unit of information in a dialogue competes with the relevant units of information and diminishes their relative visibility.
2.4.1.2 Walkthrough
Walkthrough involves one or more evaluators exploring an interface by going through a pre-determined set of tasks and assessing the understandability and ease of learning for each task. During the walkthrough of a task, the evaluator (s) attempts to address problems users encounter during the process while examining each action required.
2.4.2 Empirical Approach
It focuses on evidence of good or poor usability. Empirical approach is observation-based investigation seeking to discover and interpret facts, theories or laws that are related to human interacting with computers. It uses project-specific resources such as test tasks, users, and also measuring instruments to expose usability problems that can arise in use.
2.4.2.1 Pilot Study
Before proceeding with testing the participants, background questionnaires forms along with task list forms, nondisclosure and confidentiality agreements form and documentation prepared and checked.
Prior to the first test session, Pilot test was conduct to avoid any last minute technical issues or changing in the scenarios or any other related adjustments. The pilot test consists of:
Testing the equipment
Making sure the questions and scenarios are clear to the participant
last minute adjustments
Pilot study will be conduct as a self-assessment of the selected application as well as reviewing related work that have been done on similar field. Heuristics evaluation will be adopted in conducting this research, with slightly modification on its concepts to fit on the requirements of this work.
2.4.2.2 User Testing
User testing is a research method for evaluating effectiveness, efficiency and satisfaction of selected application interfaces from user perspective. The applications interfaces being tested will be tested to address the problems that users will have during the course of the experiment .The foundation of user testing is to ask users to perform the tasks while you watch and take notes about their interactions with these applications.
CHAPTER 3
METHODOLOGY
3.1 Research Methodology
The figure is an illustration of the work flow of the research as well as key milestone work that will be followed in carrying out this project.
3.2 Qualitative Analysis
The purpose of this phase is to determine the project title, problem statement and project objectives as they are have been mentioned in deep detail manner in the introduction chapter of this report. Planning involves the details planning of the working progress timeline and types of technique will be taken next.
Table 3.1 Description of the chosen applications
No. Application Name
Description of the Application Snapshot of the Application Interface
#1 Scatter Puzzle It shows an implementation of the Scatter View and Surface List Box controls to create a simple puzzle game allow the users to adjust the
level of difficulty.
#2 Photo Paint
It enables users to demonstrate some of the scenarios made possible by
using the application’s controls. Some of these controls include finger
to write, draw, erase, and paint over photos and videos. This application allows multiple users to interact with
these controls simultaneously.
#3 Bing
“Image”
Bing is a search engine that identifies images that correspond to keywords
specified by the users. It enables multiple users to interact with search
3.3Quantitative Analysis
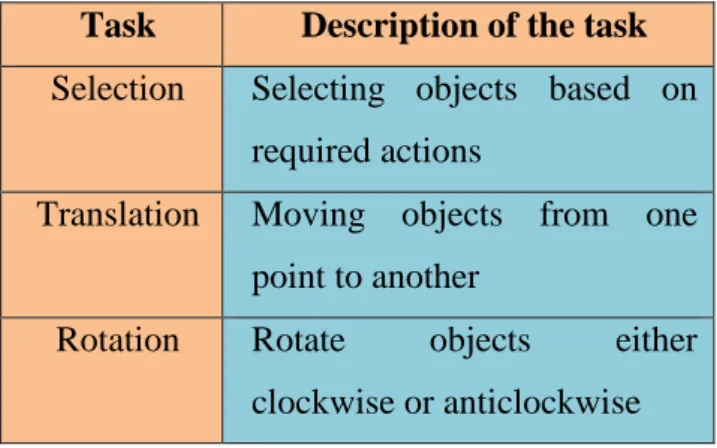
The purpose of this phase is to review the related works been done on the field of user testing methods. Below are the main tasks that are required to be performed by users on each application.
Table 3.2: Main task those are required to be performed by users
Task Description of the task Selection Selecting objects based on
required actions
Translation Moving objects from one point to another
Rotation Rotate objects either clockwise or anticlockwise
3.4Experimental Phase
The experimental situation consists of a voluntary participants thinking out loud while performing tasks using the applications being tested. An evaluator analyzes the user’s work and describes usability problems; evaluator arranges the usability test and manages technical aspects of the study as well as communication with the user. When usability test sessions have been completed, findings will be analyzed and recommendations based on these findings will be proposed to improve the
3.5Analyze the findings
After expected findings are collected, they will be analyzed in a deep manner. Time and task completion rate will be the metrics to measure to users test speed and their effectiveness completing tasks. The process will be very simple and will be iterated if necessary. All feedback given by the users will be recorded and analyzed in an effort to achieve the research objectives.
After that, design recommendation will be proposed based on analysis of the findings that are obtained by users. These recommendations will serve as guidelines to improve User Interface Design of the selected application as well as it will help future studies that tend to focus on Human-Computer Interaction field that are concern with Tabletop application interfaces design.
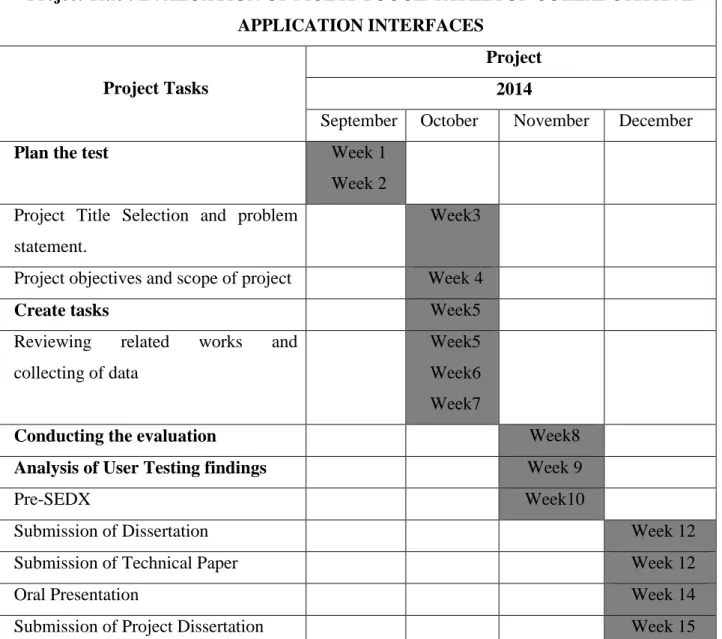
3.6 Project Timeline (Gantt chart)
Table 3.3: Project Timeline
Project Title : EVALUATION OF MULTI-TOUCH TABLETOP COLLABORATIVE APPLICATION INTERFACES
Project Tasks
Project 2014
September October November December
Plan the test Week 1
Week 2 Project Title Selection and problem
statement.
Week3
Project objectives and scope of project Week 4
Create tasks Week5
Reviewing related works and collecting of data
Week5 Week6 Week7
Conducting the evaluation Week8
Analysis of User Testing findings Week 9
Pre-SEDX Week10
Submission of Dissertation Week 12
Submission of Technical Paper Week 12
Oral Presentation Week 14
Submission of Project Dissertation Week 15
Milestone:
The important key milestones of this project are submission of progress report, Poster presentation and Pre-EDX and preparation of the final dissertation. The most important step is getting the results from the software and to compare the different conditions used and further the project activities.
CHAPTER 4
RESULTS & DISCUSSION
4.1 Results
In this chapter the findings of the user testing will be presented. Graphs Bars and charts will be used to support the illustration of the findings. These findings will be presented in two sections which are Single User Interaction, Multi – User Interaction and followed by the discussion toward the end of this chapter. The contents of this chapter will serve as qualitative and quantitative overview of data collected during the user testing. With keeping in mind the primary aim of this research which is to test the usability of the selected application interfaces on Microsoft Pixel Sense platform. Participants were divided into two groups based on whether they are going to use the applications as single users or multi-users.
The analysis of user test will be broken down to three sections as followed: 4.2Single User Interaction
4.2.1 Participants Background
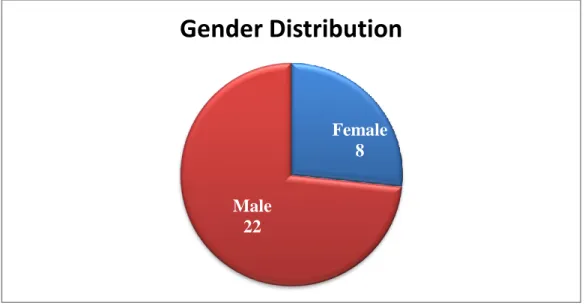
20 random students were recruited for UTP campus to participant as single users. The age range of each participant is between 18 and 27 years from both genders. It worth mentioning, none of the participants had a prior experience any collaborative environments before the test as well. Figures below are the summary of the participants’ background.
Figure 4.1: Distribution of participants based on gender.
Figure 4.2: Distribution of participants based on age.
Gender Distribution
Male 22 Female 8 0 2 4 6 8 10 12 14 18 - 22 23-27Participants General
Information
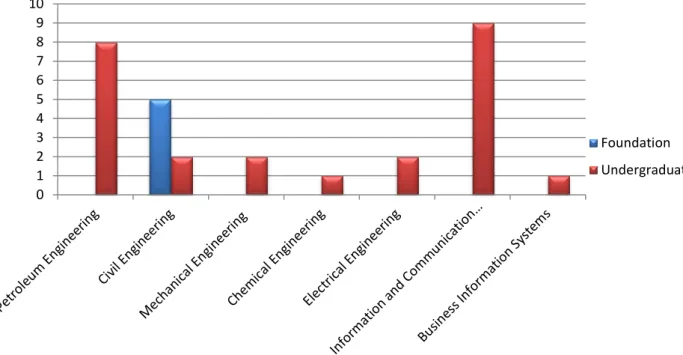
Male FemaleFigure 4.3: Distribution of participants based on educational level and program. 0 1 2 3 4 5 6 7 8 9 10 Foundation Undergraduate
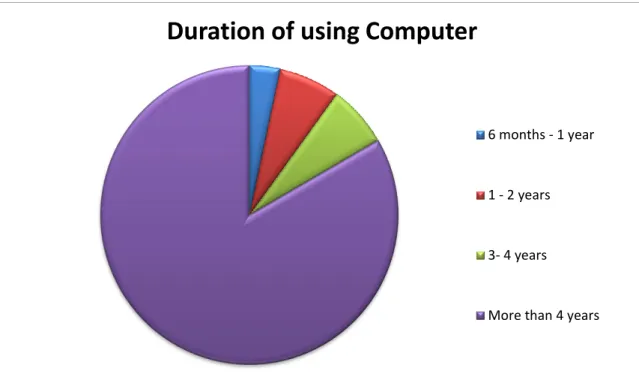
Figure 4.4: Distribution of participants based on duration of using computer.
Figure 4.5: Distribution of participants based on the experience of use Operating Systems.
Duration of using Computer
6 months - 1 year
1 - 2 years
3- 4 years
More than 4 years
Operating Systems
Linux Mac OS Windows
4.2.2 Time Analysis
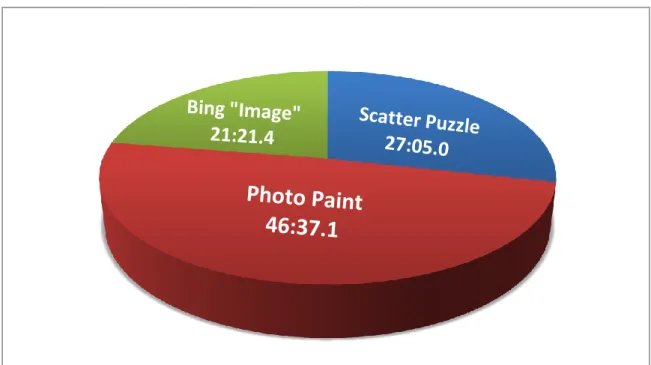
The overall length of time spent on the single user test phase was 1 hour, 35 minutes, 4 seconds [Figure 4-6]. It is also worth mentioning that this time does not account for periods when the video recording equipment was turned off if the user felt uncomfortable, wanted to ask a question, when the users where being briefed, when they were giving their User Interface Satisfaction Questionnaire forms or when they were reading on Nondisclosure and Confidentiality Agreement form. On average, an extra 5 minutes off the video recording was spent on each user test .If the extra time were included, the total time will be nearly 2 hours and 6 seconds. The pie chart below [Figure 4-6] shows the breakdown of where time was spent during the user tests on each application.
Figure 4.6: Summary of total time spent by single users in each application
The primary indicator of efficiency is the task completion time compared with average time to measure efficiency and the same approach was adapted for the purpose of this project. The total time spent for completing all tasks on Scatter Puzzle is 27 minutes and 5 seconds, 46 minutes and 37 seconds on Photo Paint, and 21 minutes and 21 seconds with Bing “Image”. [Table 6]
Table 4.1: Total time spent of user testing
User Total Time: Average Time:
Scatter Puzzle 27:05.9 01:21.3
Photo Paint 46:37.1 02:19.9
Bing “Image” 21:21.4 01:04.1
Total: 01:35:04:0
4.2.3 Participants’ performance analysis based on application.
4.2.3.1 Application: Scatter Puzzle
Scatter Puzzle is the first of three application chosen for comparison in this project. There were 3 main tasks in this application .The task list consists of all the basic action that can be performed by the user in typical scenario. The task list for Scatter Puzzle consists of:
a) Selection which enables the user to adjust the level of difficulty as well as selecting objects for the puzzle.
b) Translation which enables the users to move the puzzle pieces from one location to another location.
c) Rotation which enables the users to rotate the puzzle pieces to his or her best view.
Below is a detailed analysis of success rate in completing the required tasks by each user [Table 7]. The table shows that all participants have 84.99% as an average rate to complete all required tasks in Scatter Puzzle Application.
Table 4.2: Users success rate in completing required tasks in Scatter Puzzle application User Success rate User Success rate 1 66.6% 11 66.6% 2 100% 12 100% 3 100% 13 100% 4 100% 14 66.6% 5 33.3% 15 100% 6 100% 16 100% 7 100% 17 100% 8 100% 18 66.6% 9 100% 19 100% 10 100% 20 100% Avg rate 84.99% 1. Time Analysis
[Table8] compares the time spent by each single user to complete tasks on Scatter Puzzle application. It shows that 8 participants spent more time than average time and 12 participants spent less on than the average time.
Table 4.3: Comparison of the user average spent time to complete tasks. Scatter Puzzle Use r Time Compariso n result
User Time Comparison Result 1 01:11.0 Less 11 00:48.0 Less 2 01:23.0 Less 12 01:10.7 Less 3 01:17.6 Less 13 01:13.2 Less 4 02:10.0 More 14 01:28.3 more 5 02:01.4 More 15 01:13.8 Less 6 01:30.9 More 16 01:23.9 More 7 00:48.9 Less 17 01:43.5 More 8 01:55.2 More 18 01:19.8 Less 9 00:59.3 Less 19 00:55.6 Less 10 01:29.4 More 20 01:02.4 Less More = 8 Less = 12
1. Summary of task success rate by each user
Figure 4-7: Summary of task success rate per User in Scatter Puzzle application. 30.00% 40.00% 50.00% 60.00% 70.00% 80.00% 90.00% 100.00% 1 2 3 4 5 6 7 8 9 10 11 12 13 14 15 16 17 18 19 20
Suc
ces
s
%
Task success rate per user
4.2.3.2Application: Photo Paint
Photo Paint is the second of the three applications chosen. The Photo Paint task list had 9 tasks with 18 activates. Selecting, translation and rotation are the required tasks that must performed by the user for this application. The photo paint application has three different windows, they are:
a) Video Window enables user to play video and paint on it at the same time. b) Paint Window enables user to select color, paint and erase.
c) Picture Window enables users to draw on preinstalled pictures.
Below are in-depth analyses of rate of success in completing tasks as well as the time spent by each user to complete the tasks.
Table 4.4: Users success rate in completing required tasks in Photo Paint application User Success rate User Success rate 1 86.00% 11 50.00% 2 86.11% 12 33.33% 3 94.44% 13 94.44% 4 00.00% 14 66.67% 5 47.22% 15 91.67% 6 86.11% 16 91.67% 7 86.11% 17 43.33% 8 93.33% 18 61.11% 9 41.67% 19 73.89% 10 100.0% 20 58.33% Avg rate 71.36%
1. Time Analysis
[Table10] shows overall participant data of the average and actual task completion time for each user com shows.
Table 4.5: Comparison of the user average spent time to complete tasks. Photo Paint Use r Time Compari son result Use r Time Compariso n Result 1 04:02.0 More 11 01:37.6 Less 2 02:44.8 More 12 01:07.6 Less 3 01:06.5 Less 13 02:21.3 More 4 01:50.0 Less 14 02:26.6 More 5 01:54.1 Less 15 01:59.6 Less 6 02:04.4 Less 16 02:16.9 Less 7 03:58.6 More 17 02:18.2 Less 8 03:08.0 More 18 02:20.6 More 9 01:33.1 Less 19 03:59.4 More 10 01:41.7 Less 20 02:06.1 less More = 8 Less = 12
2. Summary of task success rate by each user.
Figure 4.8: Summary of task success rate per User in Photo Paint application. 0.00% 10.00% 20.00% 30.00% 40.00% 50.00% 60.00% 70.00% 80.00% 90.00% 100.00% 1 2 3 4 5 6 7 8 9 10 11 12 13 14 15 16 17 18 19 20
Suc
ces
s
%
Task Success Rate Per User
4.2.3.3Application: Bing “Image”
Bing “Image” is the third of the three applications chosen. The Bing “Image” is search engine powered by Microsoft. The application has task list had 3 tasks with 5 activates. Selecting, translation and rotation are the required tasks that must performed by the user in this application. Below are in-depth analyses of rate of success in completing tasks as well as the time spent by each user to complete the tasks.
Table 4.6: Users success rate in completing required tasks in Bing “Image “application User Success rate User Success rate 1 75.00% 11 75.00% 2 100.0% 12 75.00% 3 100.0% 13 100.0% 4 100.0% 14 50.00% 5 75.00% 15 100.0% 6 75.00% 16 100.0% 7 100.0% 17 100.0% 8 50.00% 18 75.00% 9 100.0% 19 100.0% 10 100.0% 20 100.0% Avg rate 87.50%
1. Time analysis
[Table 12] shows overall participant data of the average and actual task completion time for each user com shows.
Table 4.7: Comparison of the Single User average spent time to complete tasks.
Bing “Image” Use r Time Compari son result Use r Time Compariso n Result 1 01:30.0 more 11 01:25.8 More 2 01:48.8 More 12 01:13.8 More 3 00:31.8 Less 13 00:54.4 Less 4 00:46.6 Less 14 01:12.7 More 5 00:49.1 Less 15 00:53.8 Less 6 00:31.9 less 16 00:45.1 Less 7 01:09.5 More 17 01:14.5 More 8 01:09.2 More 18 01:55.3 more 9 00:45.2 Less 19 00:56.2 Less 10 01:12.2 More 20 00:35.5 Less More = 10 Less = 10
2. Summary of task success rate by each user
Figure 4.9: Summary of task success rate per User in Bing “Image” application.
4.3Multi – Users (Pair) Interaction
4.3.1Participants Background
10 random students were recruited to perform the experiment as paired for UTP campus to participant as Multi - users. The age range of each participant is between 18 and years from both genders.
The sane process that was adapted on the Single User phase will be implemented on Multi-User phase as well as the participants background study that have been previously mentioned on the single users interaction test
The overall length of time spent on the user testing phase was 54 minutes, [Table 13]. The pie chart below [Figure 4-10] shows the breakdown of where time was spent during the user tests on each application.
0.00% 10.00% 20.00% 30.00% 40.00% 50.00% 60.00% 70.00% 80.00% 90.00% 100.00% 1 2 3 4 5 6 7 8 9 10 11 12 13 14 15 16 17 18 19 20
Suc
ces
s
%
Task Success Rate Per User
4.3.2 Time
Figure 4.10: Summary of total time spent by multi - users in each application Table 4.8: illustration of the overall time spent on Multi-user testing. The average time complete all the required tasks application is also included.
User Total Time: Average Time:
Scatter Puzzle 14:01.3 02:48.3
Photo Paint 24:13.8 04:50.8
Bing “Image” 15:45.5 03:09.1
Total: 00:54:00:6
4.3.3 Participants’ performance analysis based on application.
4.3.3.1 Application: Scatter Puzzle
Photo Paint
24:01.8
Below is a detailed analysis of success rate in completing the required tasks by each user [Table]. The table shows that all participants have 84.99% as an average rate to complete all required tasks in Scatter Puzzle Application.
Table 4.9: Users success rate in completing required tasks in Scatter Puzzle application User Success rate Pair 1 100.0% Pair 2 83.30% Pair 3 100.0% Pair 4 83.30% Pair 5 83.30% Avg rate 89.98% 1. Time analysis
[Table 15] shows overall participant data of the average and actual task completion time for each user com shows.
Table 4.10: Comparison of the Multi User average spent time to complete tasks. Scatter Puzzle
User Time Comparison result
Pair 1 02:01.4 Less Pair2 02:31.4 Less Pair3 03:07.9 More Pair4 03:54.1 More Pair5 02:26.5 Less More = 2 Less = 3
2. Summary of task success rate by each user
Figure 4.11: Summary of task success rate per Pair of users in Scatter Puzzle application.
4.3.3.2Application: Photo Paint
Below are in-depth analyses of rate of success in completing tasks as well as the time spent by each user to complete the tasks.
Table 4.11: Users success rate in completing required tasks in Photo Paint application User Success rate Pair 1 45.83% Pair 2 83.61% Pair 3 66.11% Pair 4 65.00% Pair 5 80.00% Avg rate 71.36% 30.00% 40.00% 50.00% 60.00% 70.00% 80.00% 90.00% 100.00%
Pair 1 Pair 2 Pair 3 Pair 4 Pair 5
Suc
ces
s
%
Task success rate per user
1. Time analysis
[Table] shows overall participant data of the average and actual task completion time for each user com shows.
Table 4.12: Comparison of the Multi User average spent time to complete tasks. Scatter Puzzle
User Time Comparison result
Pair 1 03:43.9 Less Pair2 05:40.0 More Pair3 05:03.9 More Pair4 04:33.0 Less Pair5 05:13.0 More More = 3 Less = 2
1. Summary of task success rate by each user
Figure 4-1: Summary of task success rate per Pair of users in Photo Paint application.
4.3.3.3 Application: Bing “Image”
Below are in-depth analyses of rate of success in completing tasks as well as the time spent by each user to complete the tasks.
0.00% 10.00% 20.00% 30.00% 40.00% 50.00% 60.00% 70.00% 80.00% 90.00% 100.00%
Pair 1 Pair 2 Pair 3 Pair 4 Pair 5
Su
cc
es
s
%
Task Success Rate Per User
Table 4.13: Users success rate in completing required tasks in Bing “Image “application User Success rate Pair 1 100.0% Pair 2 100.0% Pair 3 87.50% Pair 4 62.50% Pair 5 100.0% Avg rate 90.00% 1. Time analysis
[Table 19] shows overall participant data of the average and actual task completion time for each user com shows.
Table 19: Summary of task success rate per Pair of users in Bing “Image” application
Scatter Puzzle
User Time Comparison result
Pair 1 01:56.2 Less Pair2 04:27.8 More Pair3 02:03.6 Less Pair4 02:57.5 Less Pair5 04:20.4 More More = 2 Less = 3
2. Summary of task success rate by each pair.
Figure 4-15: Summary of task success rate per Pair of users in Bing “Image” application. 0.00% 10.00% 20.00% 30.00% 40.00% 50.00% 60.00% 70.00% 80.00% 90.00% 100.00%
Pair 1 Pair 2 Pair 3 Pair 4 Pair 5
Su
cc
es
s
%
Task Success Rate Per User
4.4 Discussion
The primary aim of this research is to evaluate the usability of the selected application interfaces on Microsoft Pixel Sense platform. Usability is about effectiveness, satisfaction and efficiency, bearing in mind these measurements, the findings outlined in this section will be applicable for evaluating the usability of the chosen applications interfaces. Effectiveness is measured by success rate of each task.
The findings indicated that on average, every participant found the tasks were less difficult in observation, this suggests satisfaction with task completion. When a task is being completed, in the beginning frustration or tension of that task will be renewed in participants’ awareness. Thinking about it later when frustration and tension have gone after completing tasks, they will appear easier as soon as they run through the participants’ mind, thus the satisfaction felt in completion of a task controls the thought of it being difficult. This is why the User Interface Satisfaction Questionnaire has been considered for this study.
Single user applications expect only a single stream of input coming from a single person. In a multi-user setting, these applications cannot disambiguate what commands come from what person, nor can they make sense of overlapping commands and/or command fragments that arise from simultaneous user activities. In shared window systems, confusion arising from simultaneous user input across workstations is often regulated through a turn taking wrapper interposed between the multiple workstation input streams and the single user application
CHAPTER 5 CONCLUSION
5.1 Summary of Findings
From the work carried out herein it was observed that Scatter Puzzle is the most usable application among the other two. Over course of conducting the experiment, on average participants took longer time completing tasks list Photo Paint application than both of Scatter Puzzle application and Bing “Image”.
In term of task difficulties in single user phase, on average participants score 84.99% rate of success in Scatter Puzzle, 71.36% rate of success in Photo Paint and 87.50% rate of success in Bing “Image” which shows Photo Paint is the hardest application comparing to the other two applications.
In term of task difficulties in multi user phase, on average participants score 89.98% rate of success in Scatter Puzzle, 68.11% rate of success in Photo Paint and 90.00% rate of success in Bing “Image” which shows Photo Paint is the hardest application comparing to the other two applications as well.
The outcomes of this experiment are showing that the Scatter Puzzle and Bing “Image” application are quite satisfying, in terms if interface and their interaction to participants commands. On the other hand, the Photo Paint application is quite vague, instructions are not properly given to the user, and its response to the process of human commands is leggy.
5.2 Further Research
Due to time constraints only three applications were included in the research. A significant amount of further research could be conducted; this would include a much larger sample size, as fifteen users, more usability evaluation techniques for comparative work. A revision of the Research Design would be necessary for further study however further research would serve as a continuation of the work outlined in the report.
5.3 Suggested Improvements
In this part of the report, the recommendation will be proposed for the application interfaces based on the findings of the study. The suggestion as follow:
1. Icons should be added to all applications to indicate flow of operation which would be useful to help ease of interaction between application interfaces and users. 2. Interactively can be improved.
3. Descriptions should be added to each one of the buttons for easier interacting.
4. The paint photo needs some elaboration on it functionality before using. 5. Processing time for Photo Paint application has to be optimized.
6. Photo Paint application user interface has to be improved to be more user-friendly.
7. All applications must have a help button for users to see a guide or an instruction on how to use the application; the guide can be in picture or video form.
References:
[1] M. R. Morris, J. Lombardo, and D. Wigdor, "WeSearch: supporting collaborative search and sensemaking on a tabletop display," in Proceedings of the 2010 ACM conference on Computer supported cooperative work Savannah, Georgia, USA: ACM, 2010, pp. 401-410.
[2] Terveen, L. G., “An overview of human-computer collaboration”, Knowledge-Based Systems, 8(2-3), 67-81, 1995.
[3] K. C. Dohse, T. Dohse, J. D. Still, and D. J. Parkhurst, "Enhancing Multiuser Interaction with Multi-touch Tabletop Displays Using Hand Tracking," in Advances in Computer-Human Interaction, 2008 First International Conference on, 2008, pp. 297-302.
[4]Rogers, Y., Lim, Y., Hazlewood, W., Marshall, P. (2009). Equal Opportunities: Do Shareable Interfaces Promote More Group Participation Than Single User Displays? Human Computer Interaction 24(1/2). 79–116.
[5] Gutwin, C., & Greenberg, S. (2000). The Mechanics of Collaboration: Developing Low Cost Usability Evaluation Methods for Shared Workspaces. In IEEE Workshop on Enabling Technologies: Infrastructure for Collaborative Enterprises (WETICE 2000). Proceedings.IEEE 9th International workshops on.98-103.
[6] Antle, A. N. Tanenbaum, J., Bevans, A., Seaborn, K., and Wang, S. (2011). Balancing Art: Enabling public engagement with sustainability issues through a multi-touch tabletop collaborative game. In P. Campos, N. Graham, J. Jorge, N. Nunes, P. Palanque, M. Winckler (Eds.) INTERACT 2011- Lecture Notes in Computer Science, vol 6947, Springer Berlin/Heidelberg. 194-211.
[7] Jamil I., O’Hara, K., Perry, M., Karnik, A., & Subramanian, S. (2011). The Effects of Interaction Techniques on Talk Patterns in Collaborative Peer Learning around Interactive Tables.In Proceedings of CHI’11, ACM. 3043-3052.
[8] Harris, A., Rick, J., Bonnett, V., Yuill, N., Fleck, R, Marshall, P, & Rogers, Y. (2009). Around the table: Are multiple-touch surfaces better than single-touch for children’s collaborative interactions? In Proceedings of the 9th
conference on Computer Supported Collaborative Learning (CSCL)-vol 1. International Society of the Learning Sciences.335-344.
[9] Hornecker, E., Buur, J. (2006). Getting a grip on tangible interaction: A framework on physical space and social interactions.In Proceedings of CHI’06, ACM.437–446.
[10] Y. Rogers, Y. Lim, W. R. Hazlewood, and P. Marshall, "Equal Opportunities: Do Shareable Interfaces Promote More Group Participation Than Single User Displays?," Human Computer Interaction, vol. 24, pp. 79-116, 2009.
[11] S.A. Bly, and S.L. “Minneman, Commune: A Shared Drawing Surface.” In SIGOIS Bulletin, Massachusetts, 1990, pp.184-192.
[12] A. Harris, J. Rick, V. Bonnett, N. Yuill, R. Fleck, P. Marshall, and Y. Rogers, "Around the table: are multiple-touch surfaces better than single-touch for children's collaborative interactions?," in Proceedings of the 9th international conference on Computer supported collaborative learning. vol. 1 Rhodes, Greece: International Society of the Learning Sciences, 2009, pp. 335-344.
[13] M.Beshaeri, Liz Burs, NilufarBagae, and P. Marshall, "Collaborative Software Design Using Multi-touch tables" International Congress on Engineer Education. 79-116, 2012.
[14] Thomas E. Hansen and Juan Pablo Hourcade, "Comparing Multi-Touch Tabletops and Multi-Mouse Single-Display Group Setups” Department of Computer Science University of Iowa
[15] WeixiangXu, XuminLue ‘A new evaluation model for human interaction’,2004
[16] ACM SIGC “Human-Computer Interaction”, Wen Site-Avaliable at http://old.sigchi.org/cdg/cdg2.html
[17] Preece, J., Rogers, Y. & Sharp, H. (2002). Interaction Design: Beyond Human-Computer Interaction. New York: John Wiley & Sons.
[18] Microsoft PxelSense Technology http://www.microsoft.com/en-us/pixelsense/pixelsense.aspx
[19] P. Isenberg and D. Fisher, "Collaborative Brushing and Linking for Colocated Visual Analytics of Document Collections," Computer Graphics Forum, vol. 28, pp. 1031-1038, 20
Appendix I: Single User Test Results
User # Scatter Puzzle Photo Paint Bing
“Image” Total time Spent by each user Video window Paint windo w Picture window Total Time Rate of Success Time Rate of Success Rate of Succes s Rate of Success Rate of Success Time 1 66.6% 01:11.0 75.00% 83.33% 100% 04:02.0 75.00% 01:30.0 01:17.2 2 100% 01:23.0 75.00% 83.33% 100 % 02:44.8 100.0% 01:48.8 01:58.9 3 100% 01:17.6 100.0% 83.33% 100 % 01:06.5 100.0% 00:31.8 00:58.0 4 100% 02:10.0 0.000% 0.000% 0% 01:50.0 100.0% 00:46.6 01:35.5 5 33.3% 02:01.4 75.00% 66.67% 0% 01:54.1 75.00% 00:49.1 01:34.9 6 100% 01:30.9 75.00% 83.33% 100 % 02:04.4 75.00% 00:31.9 01:22.4 7 100% 00:48.9 75.00% 83.33% 100 % 03:58.6 100.0% 01:09.5 01:59.0 8 100% 01:55.2 100.0% 100.0% 80% 03:08.0 50.00% 01:09.2 02:21.1 9 100% 00:59.3 75.00% 50.00% 0% 01:33.1 100.0% 00:45.2 01:05.9 10 100% 01:29.4 100.0% 100.0% 100 % 01:41.7 100.0% 01:12.2 01:27.8 11 66.6% 00:48.0 100.0% 50.00% 0% 01:37.6 75.00% 01:25.8 01:17.1 12 100% 01:10.7 100.0% 0.000% 0% 01:07.6 75.00% 01:13.8 01:10.7 13 100% 01:13.2 100.0% 83.33% 100 % 02:21.3 100.0% 00:54.4 01:29.6 14 66.6% 01:28.3 100.0% 0.000% 100 % 02:26.6 50.00% 01:12.7 01:42.5 15 100% 01:13.8 75.00% 100.0% 100 % 01:59.6 100.0% 00:53.8 01:22.4 16 100% 01:23.9 75.00% 100.0% 100 % 02:16.9 100.0% 00:45.1 01:28.6 17 100% 01:43.5 0.000% 50.00% 80% 02:18.2 100.0% 01:14.5 01:45.4 18 66.6% 01:19.8 100.0% 83.33% 0% 02:20.6 75.00% 01:55.3 01:51.9 19 100% 00:55.6 75.00% 66.67% 80% 03:59.4 100.0% 00:56.2 01:57.1 20 100% 01:02.4 75.00% 100.0% 0% 02:06.1 100.0% 00:35.5 01:14.7
Appendix II: Multi User Test Results
User # Scatter Puzzle Photo Paint Bing
“Image” Video window Paint window Picture window Total Time Rate of Success Time Rate of Success Rate of Success Rate of Success Rate of Success Time
Pair 1
100.0% 02:01.4 62.50% 25.00% 50.00% 45.83% 03:43.9 100.0% 01:56.2Pair 2
83.30% 02:31.4 87.50% 83.34% 80.00% 83.61% 05:40.0 100.0% 04:27.8Pair 3
100.0% 03:07.9 75.00% 83.34% 40.00% 66.11% 05:03.9 87.50% 02:03.6Pair 4
83.30% 03:54.1 100.0% 75.00% 20.00% 65.00% 04:33.0 62.50% 02:57.5Pair 5
83.30% 02:26.5 75.00% 75.00% 90.00% 80.00% 05:13.0 100.0% 04:20.4