Decision support for ranking Pareto optimal process
designs under uncertain market conditions.
Laurence Tocka,⇤, Fran¸cois Mar´echala
aIndustrial Process and Energy Systems Engineering, Ecole Polytechnique F´ed´erale de Lausanne, Station 9, CH-1015 Lausanne, Switzerland
Abstract
Considering the uncertainty of economic conditions, multi-objective optimi-sation can be favoured to single-objective optimioptimi-sation for process design. However, from the Pareto sets generated by multi-objective optimisation it is not obvious to identify the best one, given that each solution is optimal with regard to the selected objectives. A method taking into account the economic parameters uncertainty to support decision making based on the Pareto-optimal solutions is proposed. It uses a Monte-Carlo simulation to define the probability of each of the Pareto optimal configuration to be in the list of the best configurations from the economical point of view. For a given economic context defined the most probable best configurations are identified.
The proposed method is applied to two cases: the CO2 capture in power plants
and synthetic natural gas production from biomass resources. The results al-low to identify the most attractive system designs and give recommendations for the process engineers.
Keywords: Decision making, Economic conditions, Multi-objective
⇤Phone: +41 21 693 3528 Fax: +41 21 693 3502
Email addresses: [email protected](Laurence Tock), [email protected](Fran¸cois Mar´echal)
optimization, Process design, CO2 capture, SNG production
Nomenclature Abbreviations
ATR Autothermal Reforming BM Biomass
CC Carbon Capture
CCS Carbon Capture and Storage CFB Circulating Fluidised Bed
CFBO2 Circulating Fluidised Bed directly heated with O2 CGCL Cold Gas Cleaning
CPI Current Policy Initiatives DH District Heating
ETS Emission Trading System
FICFB Fast Internally Circulating Fluidised Bed
pFICFB Pressurised Fast Internally Circulating Fluidised Bed GWP Global Warming Potential
HGCL Hot Gas Cleaning
IPCC International Panel on Climate Change LCA Life Cycle Assessment
MEA Monoethanolamine NG Natural Gas
NGCC Natural Gas Combined Cycle PSA Pressure Swing Adsorption SNG Synthetic Natural Gas
WGS Water Gas Shift
Greek letters
ho Lower heating value, kJ/kg
✏ Energy efficiency, %
Roman letters
COE Electricity production cost, $/GJe
˙
E Mechanical/electrical power, kWe
˙
m Mass flowrate, kg/s ˙
n Molar flowrate, kmol/s ˙
Q Heat Flow, kW
1. Introduction
To meet the CO2 reduction targets and to ensure a reliable energy supply, the development and wide scale deployment of cost-competitive innovative low-carbon energy technologies is necessary. Carbon capture and storage (CCS) in power plants and the use of renewable resources for the poly-generation of biofuels, heat and power are considered as promising measures. The thermodynamic performance of di↵erent process designs depends on the process configuration (i.e. technological options and operating conditions) while the market competitiveness depends in addition on the economic con-ditions, especially on the resource price. Therefore, it is important to evaluate and optimise the process designs with regard to multiple competing objec-tives such as efficiency, investment cost and environmental impacts. Since there is a trade-o↵between the objectives and that the economic performance is highly influenced by the market conditions, it is difficult to identify the
best process design from multi-objective optimisation results by taking into account the economic parameters uncertainty.
The influence of the economic conditions is frequently investigated in lit-erature based on extreme scenarios, as in [1] for the European market and
in [2] for the global market, or on sensitivity analysis. A method to support
decision making based on multi-criteria decision analysis taking into account uncertainties is developed by [3]. In [4] a method for decision support in chemical process design based on the navigation on Pareto sets is proposed.
The innovative slider concept [5] used to navigate on the Pareto frontiers supports decision making by choosing the best compromise between
conflict-ing objectives. This method does not account for parameters uncertainties.
Multiple decision making methods have been developed for management ac-tivities. However, the applications for process system designs are limited. To assist the multi-objective decision analysis an incentive model for primary en-ergy savings and carbon dioxide emission reduction is presented in [6] to eval-uate the Pareto operation decisions derived from a stochastic model including uncertainties. In [7] decision making and robustness strategies are combined with multi-objective optimization to optimize polymer extrusion processes.
So far systematic approaches taking into account the economic condi-tions fluctuation for the decision making based on the optimisation results are rarely applied and process integration aspects and life cycle assessment are not systematically assessed. Based on the systematic optimisation ap-proach previously presented [8] and [9], a method, taking into account the economic parameter sensitivity, to support decision making based on the Pareto-optimal solutions is proposed here. The influence of the economic
scenario on the decision-making is studied by taking into account the sen-sitivity of the economic performance to the carbon tax, the resource prices, the operating time, the investment and the interest rate.
1.1. Uncertain market conditions
The analysis of the fossil fuel market over the last years, reveals diverse patterns over time and with regard to the geographic location (i.e. Europe, the United States and Japan). This is revealed by the the energy statistics [10] and the oil and gas market data reported by the IEA [11], as well as the publications of the European Comission reporting trends [12], raw data [13] and future scenarios [14]. The large fluctuations result from multiple factors a↵ecting the trading. In the past, the natural gas price evolution went in pair with the oil price. However, with the exploitation of shale gas this pattern
changes. The coal price which is less a↵ected by the oil price and is predicted
to stabilise around 5$/GJcoal in 2030 [14]. Consequently, the gas to coal price
ratio is projected to increase steadily and will together with the carbon price influence investment decisions in the power sector. European gas prices are about twice as high as US gas prices and are projected to be 10$/GJN G in
2020, 12$/GJN Gin 2030 and 16$/GJN Gin 2050 for theEU ’Reference’ energy
scenario [14]. In a similar way, the carbon tax price is influenced by multiple factors. The emission trading system (ETS) directive has been established in the European Union to promote greenhouse gas emissions reductions in a cost e↵ective and economically efficient manner [15]. The carbon price drop from around 25e/tCO2 in 2008 to below 10e/tCO2 in the second half of 2011 because of the surplus of allowances and international credits and the financial crisis. According to the predictions from the Energy Roadmap
2050 [14], carbon tax prices will rise moderately until 2030 and then signif-icantly to provide support to low carbon technologies and energy efficiency. For the current policy initiatives (CPI) scenario, taking into account the lat-est policies on energy efficiency, taxation and infrastructure, the carbon tax is predicted to increase to 15e/tCO2 in 2020, to 32e/tCO2 in 2030 and to 51e/tCO2 in 2050. Comparing the costs projections for di↵erent energy and policy scenarios a large variation of the predictions is found. This highlights the large uncertainty of costs projections and the need to account for di↵ er-ent economic scenarios when evaluating the competitiveness of processes to support investment decisions.
2. Methodology
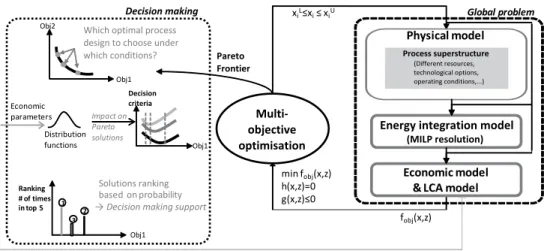
The applied thermo-environomic modelling and optimisation approach illustrated in Figure 1 combines flowsheeting and energy integration tech-niques with economic evaluation and life cycle assessment (LCA) [8] in a multi-objective optimisation framework previously presented in [16] and [9].
The main steps are summarized as following:
1. Establishment of the process superstructure and development of the
pro-cess models.
2. Computation of the energy integration.
3. Assessment of the performance indicators.
4. Multi-objective optimisation.
5. Decision making.
After the assessment of candidate process technologies in a superstruc-ture, energy-flow models are established with conventional flowsheeting
soft-ware computing the chemical and physical transformations and the associ-ated heat transfer requirements of each process option. The heat recovery and the combined heat and power production is optimised in the energy integra-tion model by using the heat cascade constraints and a linear programming model minimising the operating cost [17]. The process needs are satisfied by di↵erent utilities including waste and process gas combustion, Rankine cycle, gas turbine and cogeneration. To evaluate the economic performance, the equipments are first sized and the costs are then evaluated by applying the approach and correlations reported in [18] and [19]. A multi-objective optimisation based on an evolutionary algorithm [20] is finally performed to assess the trade-o↵s between competing objectives and identify optimal pro-cess designs and operating conditions. Evolutionary algorithms working with populations instead of a single data point, generate multiple promising solu-tions in the form of a Pareto-optimal frontier. The Pareto-optimal solusolu-tions correspond to the configurations for which it is not possible to improve one objective without simultaneously downgrading one of the other objectives. It is a priori not obvious which configuration has to be chosen from the Pareto results.
Therefore, the aim is here to propose an approach which allows to identify the optimal process design from the Pareto-optimal solutions taking into account the economic conditions sensitivity.
2.1. Decision support approach
In this approach (Figure 1), the economic conditions fluctuation is first described by probability distribution functions (Section 2.1.1). By applying the distribution functions a series of 1000 economic scenarios is randomly
Global problem Multi‐ objective optimisation min fobj(x,z) h(x,z)=0 g(x,z)≤0 xiL≤xi≤ xiU fobj(x,z) Pareto Frontier Physical model
Energy integration model
(MILP resolution)
Economic model & LCA model
Decision making
Process superstructure
Which optimal process design to choose under which conditions?
Obj1 Obj2
Solutions ranking based on probability
→ Decision making support Distribution functions Impact on Pareto solutions Obj1 Decision criteria Economic parameters Ranking # of times in top 5 Obj1 3 2 1 (Different resources, technological options, operating conditions,...)
Figure 1: Thermo-environomic optimisation strategy to support decision-making. generated. For every single economic scenario and for each configuration (i.e. process design) of the Pareto frontiers resulting from the multi-objective optimisation, the decision criterion/criteria is/are then recomputed. From the Pareto-optimal solutions the designs that yield the best performance (best, top 5 and top 10) with regard to the decision criteria are then identified for each economic scenario. After having identified the most economically competitive designs in the wide range of economic scenarios, it can be found out if some configurations are dominating or if some are never part of the best performing ones. To evaluate this quantitatively, the probability to be part of the best performing designs is assessed for each point of the Pareto front. The di↵erent process designs can then be ranked based on this probability. This allows finally to identify the most economically competitive process design in a wide range of economic scenarios.
The following steps summarise the decision support approach that allows to rank the di↵erent process designs and to identify the best process design
taking into account the economic parameters sensitivity.
1. Generation of the Pareto frontiers by multi-objective optimisation. When several technology options can be considered, one Pareto frontier is gen-erated per process option.
2. Definition of probability distribution functions for each uncertain eco-nomic parameter (i.e. resource price, carbon tax, interest rate,...). 3. Generation of a set of 1000 di↵erent economic scenarios based on the
probability distribution functions. 4. For each economic scenario:
• Recalculation of the decision criteria (i.e. lowest production costs, highest profit, ...) for each Pareto optimal solution.
• Ranking of the process designs with regard to the decision crite-rion.
• Identification of the best and top 5 process designs. 5. Repeat step 3 for each economic scenario.
6. Assessment of the probability to perform the best. For each Pareto
optimal solution the probability to be the best and the probability to be part of the 5 best process configurations are calculated. The best performance is evaluated based on one or several decision criteria/on, being a chosen performance indicator (i.e operating cost, profitability, ...).
2.1.1. Distribution functions - Uncertain parameters
The economic conditions fluctuation is described by probability distribu-tion funcdistribu-tions. Characteristic distribudistribu-tion funcdistribu-tions that are applied here are the normal, uniform and beta distributions. Di↵erent approaches are discussed in [21]. The normal or Gaussian distribution is a continuous prob-ability distribution that has a bell-shape probprob-ability density function given by Eq.1. The parameter µ is the mean and 2 is the variance and the standard deviation. The continuous uniform distribution is characterised by the lower a and upper b endpoint defining the distribution support. Each point in this interval is equally probable. The probability density function for x2 [a, b] is given by Eq.2. The beta distribution is a continuous proba-bility distribution that is defined in the interval [0,1] and is parameterised by two positive shape parameters a and b. This distribution characterised by the probability density function Eq.3 is frequently applied to model the behaviour of random variables limited to a finite interval.
f(x;µ, 2) = p1 2⇧e 1 2( x µ )2 (1) f(x) = 1 a b (2) f(x;a, b) = c·xa 1·(1 x)b 1 (3)
Based on available literature data about economic scenarios projections from IEA and the European Comission [10, 11, 14, 12, 13, 1], the lower and upper boundary values are defined for each economic parameter. The appro-priate distribution function is then selected and the characteristic parameters are identified in such a way that boundary values are part of the distribution.
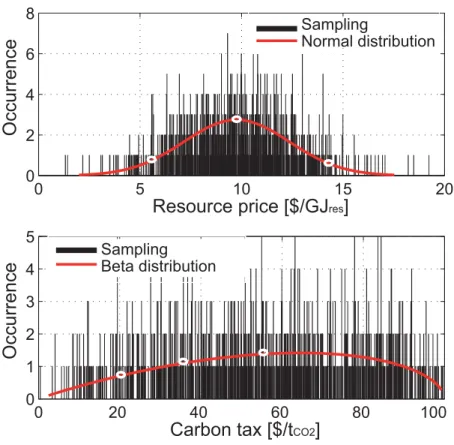
The distributions for the natural gas price and the carbon tax are represented in Figure 2 and the parameters of the probability density functions are re-ported in Table 1. The variation of the natural gas price is represented by a normal distribution. The carbon tax price which is assumed to increase most probably in the future is described by a beta distribution function.
Table 1: Definition of the parameters of the distribution functions for the natural gas price and carbon tax. The boundary values are based on [10, 11, 14, 12, 13, 1]
Scenario Distribution functions parameters
Base Low High Distribution Param. A Param. B Param. C
Natural gas price [$/GJN G] 9.7 5.5 14.2 Normal µ=9.7 =2.5
-Carbon tax [$/tCO2] 35 20 55 Beta a=2 b=1.5 c=100
3. Applications
The previously described methodology is applied to identify under un-certain market conditions the best process designs from the multi-objective optimisation results of two di↵erent systems: a) CO2 capture in power plants and b) Synthethic natural gas (SNG), heat and power poly-generation from lignocellulosic biomass.
3.1. CO2 capture in power plants
For CO2 capture in power plants three major concepts are suitable: post-, pre- and oxyfuel-combustion. The thermo-economic competitiveness of these CO2 capture options depends on the power plant layout, the resources type, the capture technology and the economic conditions. The penalty of CO2
0 5 10 15 20 0 2 4 6 8
Resource price [$/GJres]
Occurrence Sampling Normal distribution 0 20 40 60 80 100 0 1 2 3 4 5
Carbon tax [$/tCO2]
Occurrence
Sampling Beta distribution
Figure 2: Distribution function (in red) of the natural gas price (top) and of the carbon tax (bottom). The white dots correspond the values reported in Table 1. The black bars represent the random sample of 1000 values.
Technology Platform [1], the International Panel on Climate Change [22] and the International Energy Agency [2]. Diverse layouts have been compared by
[23] and [24]. Di↵erent process configurations based on fossil and renewable
resources have been evaluated based on process modelling and simulation in [25–27] and [28] without including detailed process integration and economic
considerations. An extensive life cycle assessment (LCA) of CO2 capture
options is performed in [29], while economic and environmental aspects are combined in [30]. Nevertheless, none of these studies combines extensive
flow-sheeting with thermodynamic, economic and environmental considerations simultaneously to make a comprehensive comparison of CO2 capture options in power plants applications. All these studies reveal that the competitive-ness of CO2 capture processes on the future energy market is determined by the economic conditions, especially the resource price and the introduction of a carbon tax. The influence of the economic conditions is frequently inves-tigated based on extreme scenarios or sensitivity analysis [1, 31], however no systematic approach taking into account the economic conditions fluctuation for the decision making based on the optimisation results is applied.
The decision support approach is applied here to identify the best CO2 capture process design under uncertain market conditions.
3.1.1. CO2 capture process description
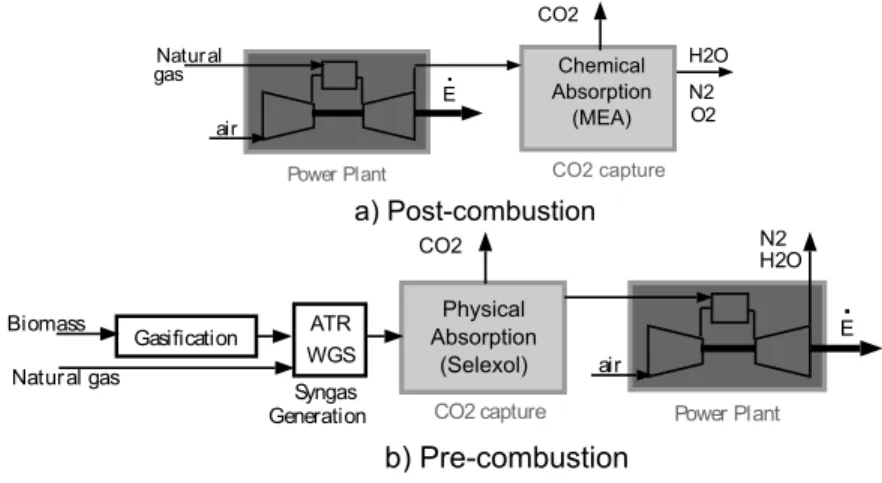
Three representative CO2 capture options, illustrated in Figure 3, are investigated: 1) Post-combustion CO2 capture by chemical absorption with monoethanolamine (MEA) applied to a natural gas combined cycle (NGCC) plant (582 MWth,N G). This option, abbreviated hereafter as NG post-, is
the same as the one described in [32]. 2) Pre-combustion CO2 capture by physical absorption with Selexol in a natural gas fueled power plant (725 MWth,N G) based on autothermal reforming. This option, referred to hereafter
as NG pre-,has been described and analysed previously in [33] and [34] for
H2 production applications. 3) Pre-combustion CO2 capture by physical absorption with Selexol in a biomass fired power plant (380 MWth,BM) based
on fast internally circulating fluidised bed gasification. The biomass resource is wood characterised by a weight composition of 51.09%C, 5.75%H, 42.97%O and 0.19% N, and a humidity of 50%wt. This option, labeled hereafter as
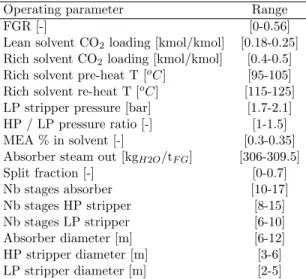
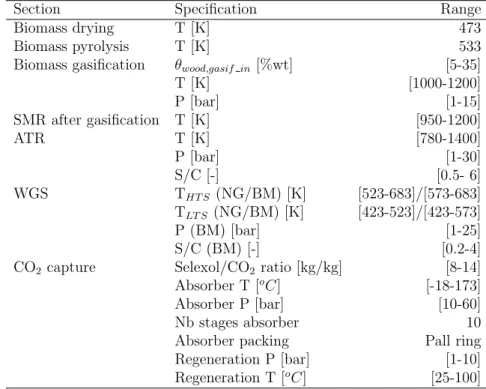
BM pre-, has been described and analysed previously in [35]. For all the cases CO2 compression to 110 bar for subsequent transport and storage is included to evaluate the thermo-environomic performance. The key operating parameters of the investigated pre- and post-combustion processes are reported
in Tables 2 and 3. Power Plant air E Natural CO2 capture CO2 N2 H2O O2 gas a) Post-combustion Chemical Absorption (MEA) .
Gasi cation ATR WGS
CO2 capture Power Plant
Syngas Generation
CO2
Biomass
Natural gas air
N2 H2O E b) Pre-combustion Physical Absorption (Selexol)
.
Figure 3: Investigated CO2 capture processes for electricity production.
A multi-objective optimisation is performed with the objective of max-imising the energy efficiency (Eq.4) and the CO2 capture rate (Eq.5) with regard to the process operating parameters (i.e. reforming, gasification and water gas shift temperature and pressure, steam to carbon ratio, capture unit design, absorption and desorption operating conditions, cogeneration system configuration,... (Tables 2 and 3).
The energy efficiency✏totis defined by the ratio between the net electricity
output ( E = ˙E E˙+) and the resources energy input, expressed on the basis of the lower heating value ( h0), according to Eq.4.
✏tot =
E h0
N G,in·m˙N G,in
Table 2: Decision variables for the post-combustion CO2 capture process using chemical
absorption process with monoethanolamine.
Operating parameter Range
FGR [-] [0-0.56]
Lean solvent CO2loading [kmol/kmol] [0.18-0.25] Rich solvent CO2loading [kmol/kmol] [0.4-0.5] Rich solvent pre-heat T [oC] [95-105]
Rich solvent re-heat T [oC] [115-125]
LP stripper pressure [bar] [1.7-2.1] HP / LP pressure ratio [-] [1-1.5] MEA % in solvent [-] [0.3-0.35] Absorber steam out [kgH2O/tF G] [306-309.5]
Split fraction [-] [0-0.7] Nb stages absorber [10-17] Nb stages HP stripper [8-15] Nb stages LP stripper [6-10] Absorber diameter [m] [6-12] HP stripper diameter [m] [3-6] LP stripper diameter [m] [2-5] ⌘CO2 = ˙ nCcaptured ˙ nCin ·100 (5)
To evaluate the economic performance the electricity production costs, including the annual capital investment and the operation and maintenance costs, are computed.The capital investment of each equipment assessed based on cost correlations reported in [18] and [19] is update to year 2014 with the Marshall and Swift cost index accounting for inflation. The total cap-ital investment is annualised taking into account the interest rate and the plant lifetime. The maintenance costs are assumed to be 5% of the initial annual investment. The operating costs mainly consist of the purchase of the resources, which are here the natural gas and biomass feedstock.
The competitiveness of the CO2 capture options is compared with a con-ventional NGCC plant (559MWth,N G) without CO2 capture characterized by an efficiency of 58.7%, specific CO2 emissions of 105kgCO2/GJe, COE of
Table 3: Decision variables for the pre-combustion CO2capture (physical absorption with
Selexol solvent) processes using natural gas or biomass as a feedstock.
Section Specification Range
Biomass drying T [K] 473
Biomass pyrolysis T [K] 533
Biomass gasification ✓wood,gasif in[%wt] [5-35]
T [K] [1000-1200] P [bar] [1-15] SMR after gasification T [K] [950-1200] ATR T [K] [780-1400] P [bar] [1-30] S/C [-] [0.5- 6] WGS THT S (NG/BM) [K] [523-683]/[573-683] TLT S (NG/BM) [K] [423-523]/[423-573] P (BM) [bar] [1-25] S/C (BM) [-] [0.2-4]
CO2 capture Selexol/CO2 ratio [kg/kg] [8-14]
Absorber T [oC] [-18-173]
Absorber P [bar] [10-60]
Nb stages absorber 10
Absorber packing Pall ring
Regeneration P [bar] [1-10]
Regeneration T [oC] [25-100]
18.3$/GJe without carbon tax.
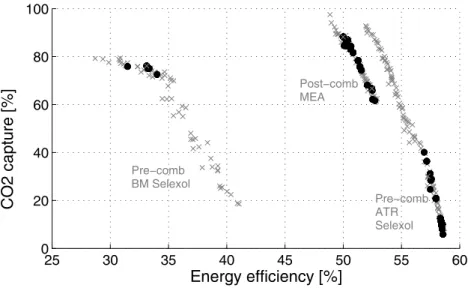
The multi-objective optimisation results illustrated in Figure 4 reveal the trade-o↵ between the energy efficiency and the CO2 capture rate. An in-crease of the CO2 capture rate leads to a decrease of the energy efficiency due to the energy consumption for CO2 capture and compression to 110 bar. Considering only these two performance indicators no evident decision in favor of one specific process configuration can be made. To evaluate the process market competitiveness, the economic dimension has to be included. CO2 capture induces additional investment costs for the capture equipment (i.e. absorber and desorber) and the CO2 compressor. Together with the
25 30 35 40 45 50 55 60 0 20 40 60 80 100 Energy efficiency [%] CO2 capture [%] Pre−comb BM Selexol Pre−comb ATR Selexol Post−comb MEA
Figure 4: Power plants performance with CO2 capture: Decision-making based on the
Pareto front (black points).
reduced electricity production, this increase of the investment leads to an increase of the electricity production costs. When a carbon tax is intro-duced the cost penalty of CO2 capture is reduced by the benefit from the tax compared to a plant without CO2 capture inducing larger emissions. Con-sequently, there are break even economic conditions for which CO2 capture becomes beneficial. To take into account the economic conditions uncertainty
for the decision making, the fluctuation of the di↵erent economic parameters
is described by the distribution functions following the approach described in Section 2.1.1. The distribution functions are summarized in Table 4. The boundary values used to set up the distribution functions of the resource price and the carbon tax are based on [10, 11, 14, 12, 13, 1]. The yearly operation is characterised by a beta distribution as the as target of the plant is to oper-ate closely to its design value which was here 8600 h/y. Most plants tending
to operate for more than 10 years and operating likelihood between 20 and 30 years, a beta distribution is used to reflect the variation of the economic
lifetime. The interest rate being a↵ected by the market and the trading a
normal distribution around the usual rate of 6% is used. For the investment
cost estimation a presicion of ± 30% is reported in [18], which is reflected
by the uniform distribution. For ranking the di↵erent solutions the chosen
decision criteria is the electricity production costs (COE) including a carbon tax.
Table 4: Definition of the economic scenarios and parameters of the distribution functions for the economic assumptions.The distribution functions are set up based on values from [10, 11, 14, 12, 13, 1]
Distribution functions parameters Distribution Param. A Param. B Param. C
Resource price [$/GJN G] Normal µ=9.7 =2.5
-Carbon tax [$/tCO2] Beta a=2 b=1.5 c=100
Yearly operation [h/y] Beta a=3.9 b=1.2 c=8600
Economic lifetime [y] Beta a=5.8 b=4 c=40
Interest rate [%] Normal µ=0.06 =0.01
-Investment cost [%] Uniform a=-0.3 b=0.3
-3.1.2. Decision making based on the Pareto-optimal solutions
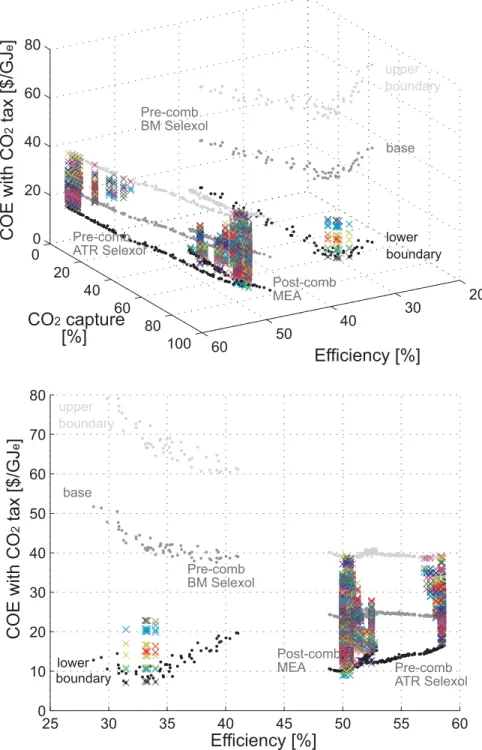
The variation of the economic performance of the Pareto optimal solutions with the economic conditions is illustrated in Figure 5.
The configurations yielding the best economic performance are identified in Figures 5&4. Figure 4 illustrates by the black dots how the decision-making along the Pareto-optimal frontier changes. Figure 5 reports the variation of the COE of the most economically competitive configurations identified from the Pareto-optimal solutions between the upper and lower
borderline. The economic conditions corresponding to the lower and upper boundary are respectively: 5042/7260h/y operation, 7.29/62.3$/GJres
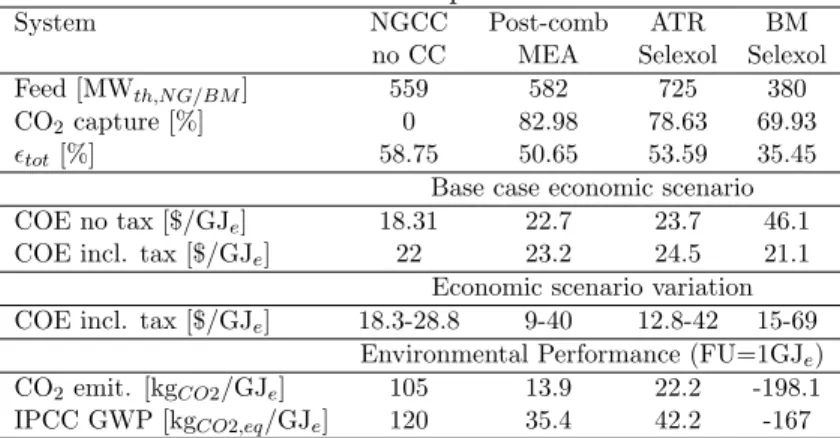
re-source price, 89/55.8$/tCO2 carbon tax, 6.3/4.1% interest rate, 25.5/20y life-time and -23/+25% investment costs estimation. For the base case economic scenario biomass fed processes are not competitive and post-combustion CO2 capture performs best for capture rates around 70-85%. When gas prices in-crease, the natural gas based processes become uncompetitive compared to the base case biomass configurations. These results point out the compe-tition between the processes and the influence of the economic scenario on the decision-making. This competition is highlighted in Figure 6 evaluat-ing the overall competitiveness of each Pareto-optimal solution compared to the most-economically competitive solution. The post-combustion process configuration capturing 83% of the CO2 emissions yields a relative compet-itiveness of 1 since this solution is the most economically competitive one in the large range of economic conditions. These results clearly show the close competition between post- and pre-combustion and underline that the CO2 capture rate is a key factor defining the economic performance. Pre-combustion CO2 capture configurations, being slightly more expensive for similar capture rates, yield however slightly better efficiencies. Depending on the production scope, this could a↵ect decision-making for the more ex-pensive solution. For some marginal economic scenarios CO2 capture in biomass fed power plants becomes a competitive alternative. In fact, the benefit from the carbon tax overweights the efficiency penalty for capture rates around 70%. The performance results of the most economically com-petitive process configurations are compared with the conventional NGCC
plant without CO2 capture and summarised in Table 5. These results show how the most economically competitive process configurations can be iden-tified from the Pareto-optimal solutions by applying the selection approach taking into account the economic conditions fluctuation.
Table 5: Process performance.
System NGCC Post-comb ATR BM
no CC MEA Selexol Selexol
Feed [MWth,N G/BM] 559 582 725 380
CO2capture [%] 0 82.98 78.63 69.93
✏tot[%] 58.75 50.65 53.59 35.45
Base case economic scenario COE no tax [$/GJe] 18.31 22.7 23.7 46.1
COE incl. tax [$/GJe] 22 23.2 24.5 21.1
Economic scenario variation COE incl. tax [$/GJe] 18.3-28.8 9-40 12.8-42 15-69
Environmental Performance (FU=1GJe)
CO2emit. [kgCO2/GJe] 105 13.9 22.2 -198.1
20 30 40 50 60 0 20 40 60 80 100 0 20 40 60 80 Efficiency [%] CO2 capture [%] COE with CO 2 tax [$/GJ e ] upper boundary lower boundary base Pre-comb BM Selexol Pre-comb ATR Selexol Post-comb MEA 25 30 35 40 45 50 55 60 0 10 20 30 40 50 60 70 80 Efficiency [%] COE with CO 2 tax [$/GJ e ] base upper boundary Pre-comb BM Selexol Pre-comb ATR Selexol Post-comb MEA boundarylower
Figure 5: Power plants performance with CO2capture: Influence of the economic scenario
on the decision-making based on the top 5 configurations yielding the best economic perfor-mance. The crosses (x) represent for each economic scenario the 5 selected configurations.
Energy Efficiency [%] Relative competitiveness 20 30 40 50 60 0 0.2 0.4 0.6 0.8 1 10 20 30 40 50 60 70 80 90 100 CO2 capture [%] Pre−comb. BM Selexol Post−comb. MEA Pre−comb. ATR Selexol
3.2. SNG production from biomass
The production of synthetic natural gas (SNG) from lignocellulosic biomass was investigated by Gassner et al. [16], based on the same thermo-enivironomic optimization methodology [8]. The proposed superstructure of the SNG pro-cess includes several propro-cess options for biomass drying, gasification, clean-ing, CO2 removal and SNG upgrading. In [36] a database of Pareto-optimal flowsheets for all the potential combinations of candidate technologies has been generated by combining the superstructure process model with multi-objective optimisation techniques. The database consists of 118 Pareto
fron-tiers that di↵er mainly by the following technology choices (illustrated in
Fig-ure 7):
• Wood drying technology: drying with hot air or steam
• Gasification technology: fast internally circulating fluidised bed (FICFB)
gasifier at atmospheric pressure or pressurized (pFICFB) and
circulat-ing fluidised bed (CFB) gasification directly heated with O2 (CFBO2).
• Gas cleaning technology: hot gas cleaning (HCL) or cold gas cleaning
(CCL)
• Methane upgrading technology (i.e. CO2 capture): pressure swing
ad-sorption (PSA), Selexol abad-sorption and membrane processes. The up-grading can be performed upstream or downstream the methanation
The di↵erent Pareto frontiers are described in detail and listed in Appendix.
The influence of the economic conditions and of the plant scale were briefly discussed in [36] and the most economically plants have been identi-fied based on the maximum biomass break even cost for di↵erent conditions.
Wood Air drying
Steam drying
Torrefaction
Pyrolysis
Drying Thermochemical pretreatment
Indirectly heated, steam-blown gasification Directly heated, steam/oxygen-blown gasification Gasification
Cold gas cleaning (cyclone, filter, scrubber, guard bed)
Hot gas cleaning (cyclone, filter, catalytic treatment) Gas cleaning Synthesis preparation Physical absorption (Selexol wash) Pressure swing absorption
Stepwise fixed bed methanation Internally cooled fluidised bed methanation Methane synthesis Water-gas shift Stoichiometry adjustment CO2-removal Physical absorption (Selexol wash) Pressure swing absorption Polymeric membranes SNG-upgrading volatiles Compression Compression SNG treatment CO2treatment Electrolysis CO2 SNG H2O(v) Q+ Q+ H2O(v)
residuals and condensates CO2 and condensates
H2O(v) Q -condensates Q+ H2 O2 H2O(l) O2-import or cryogenic production on-site combustion Q
Utility and heat recovery system Boiler,
steam network and turbines
Q- Q- Q+
Figure 7: Process superstructure of the SNG production (Figure reproduced from [36]).
Since the di↵erent process designs di↵er in terms of the amount of electricity and heat that is consumed, respectively produced, the economic competi-tiveness is highly dependent on the market parameters such as the SNG, heat and electricity selling price and the biomass and electricity purchase price. To assess systematically the influence of the economic conditions and to rank the di↵erent process designs based on the probability to be part of the top performing ones the decision support approach previously described is applied here.
The analysis is performed for a plant scale of 100MWth. It is considered
that the produced SNG is used as an automotive fuel. The produced elec-tricity is sold as ’green’ elecelec-tricity. The economic conditions uncertainty is assessed through the distributions functions reported in Table 6 which have been defined based based on data from [37–39]. The considered decision criteria are the SNG production costs, the resources profitability (obtained profit), and the overall ranking with regard to the 2 decision criteria (prod. cost and profitability).
Table 6: Definition of the economic scenarios and parameters of the distribution functions for the economic assumptions.
Distribution functions parameters Distribution Param. A Param. B Param. C
Biomass price [$/MWhBM] Normal µ=28.6 =3.5
-˙
E price [$/MWhe] Normal µ=145 =15
-˙
E price (green) [$/MWhe] Normal µ=165 =20
-Distributed heat price [$/MWh] Beta a=5.3 b=1.37 c=92
SNG price (automotive fuel) [$/MWhSN G] Normal µ=110 =20
-Biodiesel price [$/MWhF AM E] Normal µ=105 =20
-Yearly operation [-] Normal µ=0.9 =0.1
-Interest rate [%] Normal µ=0.06 =0.01
-Investment cost [%] Uniform a=-0.3 b=0.3
-3.2.1. Identification of best SNG process designs
For each decision criterion, the probability to be the best process design with regard to this criterion and the probability to be part of the 5 best per-forming process designs (top 5) is assessed over the whole range of economic scenarios.
The results illustrated in Figure 8 clearly reveal the influence of the deci-sion criterion on the best process design. In Figure 8 all the Parteo frontiers resulting from the multi-objective optimisation maximising the SNG equiv-alent efficiency and minimising the specific investment cost are illustrated. The circles represent the probability of this process design to be part of the best performing ones. The diameter of the circle is scaled in accordance with the probability. The results show that several Pareto frontiers do never en-close the best performing process designs. Di↵erent solutions emerge with the decision criteria production costs and resource profitability. The best performing process designs and the corresponding probability to be the best
one are reported in Table 7 for the di↵erent decision criteria. In terms of production costs, the process designs the lead to the lowest cost in the large range of economic scenarios belong predominately to the same Pareto cor-responding to SNG production by CFB gasification with membrane cascade downstream of methanation (nb 22 - CFBO2 31 hcl). With regard to the resource profitability the best configurations are the one based on CFB gasi-fication with Selexol absorption downstream of methanation (nb 14 - CFBO2 21 hcl), followed by the one with CFB gasification and membrane cascade downstream of methanation (nb 22 - CFBO2 31 hcl). This reveals the com-petition between the di↵erent CH4 upgrading technologies and the decision criterion. The process designs with an high SNG equivalent are the ones that yield also the best economic performance even if the specific investment costs are larger than for designs with lower efficiencies, due to the profit of selling the products.
Instead of assessing the best process design only on the probability to be the best performing one with regard to a given decision criteria, the best design is now identified by the probability to be part of the top 5 performing ones (T5). In this case the selected solutions are increased as illustrated in Figure 8 and Table 8. It appears that the most economic competitive pro-cess designs for SNG production are based on CFB gasification and hot gas cleaning, and co-produce heat for district heating purposes. The di↵erent technologies for the SNG purification after methanation are in competition. When identifying the best process design with regard to the lowest produc-tion, designs with air drying (nb 10 - CFBO2 20 hcl, nb 18 - CFBO2 30 hcl) and steam drying compete (nb 14 - CFBO2 21 hcl, nb 22 - CFBO2 31 hcl)
60 65 70 75 80 85 90 600 800 1000 1200 1400 1600 1800 CFB pFICFBgt FICFB pFICFB Best Profit. Best Ranking T5 Prod. Cost T5 Profit T5 Ranking Best Prod. Cost
SNG equivalent efficiency [%] Sp ec ific in ve st m en t c os t [ $/ kW ]
Figure 8: Pareto frontiers resulting from multi-objective optimisation of SNG processes [36] and identification of best process designs based on di↵erent decision criteria. The circles are proportional to the probability to be part of the best process designs.
with each other.
As the two di↵erent decision criteria can lead to the selection of di↵erent process designs, an overall ranking can also be established by combining the ranking of each process design with regard to the decision criteria. This allows to identify the most reliable process designs in a large range of economic scenarios. In this case, some SNG production processes based on FICFB gasification (no 101) become interesting as illustrated in Figure 8.
Taking into account the economic conditions uncertainty, the same ap-proach can also be applied to identify the best process designs from one single Pareto or from a reduced number of technology scenarios from the SNG pro-cesses database (for example, only those with district heating, or only CFB
Table 7: Identification of the 5 best process designs in terms of production costs and resource profitability and corresponding probability to be the best performing one. The designs are characterised by XX YY where XX is the number of the Pareto (Appendix) and YY is the number of the design in this Pareto.
Prod. Cost
Design Proba. ✏SN G Invest.
No Gasifier CO
2 capture Drying % % $/kW
22 27 CFB O2 Membrane Steam 63 85.4 818
22 30 CFB O2 Membrane Steam 18.3 85.2 801
22 06 CFB O2 Membrane Steam 16.1 84.2 768.7
74 38 pFICFB PSA Air 0.8 81.3 1418.7
74 31 pFICFB PSA Air 0.6 81.9 1611
Profitability
Design Proba. ✏SN G Invest.
No Gasifier CO 2 capture Drying % % $/kW 14 51 CFB O2 Selexol Steam 20.7 85.6 721 14 32 CFB O2 Selexol Steam 15.7 85.8 731 22 30 CFB O2 Membrane Steam 15.3 85.2 801 22 27 CFB O2 Membrane 12.9 Steam 85.4 818 14 69 CFB O2 Selexol Steam 12.0 85.8 735
with steam drying,...).
4. Conclusions
This paper presents a decision support approach that takes into account the variability of the economic conditions to identify the most economically competitive process designs from a multi-objective optimisation Pareto set. The approach is applied to systematically assess CO2 capture options in power production processes and SNG-fuel production processes. The compe-tition between the di↵erent process designs and the decision criteria is pointed out and the influence of the economic conditions on the decision-making is highlighted.
in-Table 8: Identification of the 10 best process designs in terms of production costs and resource profitability and corresponding probability to be part of the 5 best performing process designs. The designs are characterised by XX YY where XX is the number of the Pareto (Appendix) and YY is the number of the design in this Pareto.
Prod. Cost
Design Proba. ✏SN G Invest.
No Gasifier CO 2 capture Drying % % $/kW 18 62 CFB O2 Membrane Air 18.4 81.1 879 10 60 CFB O2 Selexol Air 15.5 81.1 755 21 37 CFB O2 Membrane Steam (CGCL) 14.1 80.4 787 22 27 CFB O2 Membrane Steam 12.9 85.4 818 14 69 CFB O2 Selexol Steam 8.6 85.9 736 14 51 CFB O2 Selexol Steam 6.0 85.6 721 22 30 CFB O2 Membrane Steam 3.7 85.2 801 14 15 CFB O2 Selexol Steam 3.7 84.6 708 22 06 CFB O2 Membrane Steam 3.2 84.2 769 21 63 CFB O2 Membrane Steam (CGCL) 2.9 79.2 751 Profitability
Design Proba. ✏SN G Invest.
No Gasifier CO 2 capture Drying % % $/kW 22 30 CFB O2 Membrane Steam 11.7 85.2 801 10 60 CFB O2 Selexol Air 11.2 81.1 755 6 50 CFB O2 PSA Steam 9.8 85.1 860 14 51 CFB O2 Selexol Steam 7.8 85.6 721 14 69 CFB O2 Selexol Steam 5.2 85.9 736 22 27 CFB O2 Membrane Steam 4.3 85.4 818 18 62 CFB O2 Membrane Air 4.3 81.1 879 31 51 CFB O2 Membrane Steam (CGCL) 4.2 81.7 698 14 32 CFB O2 Selexol Steam 3.2 85.8 732 22 06 CFB O2 Membrane Steam 3.0 84.2 769
fluenced by the resource price and the introduction of a carbon tax. It is determined by the production scope and the priorities given to the di↵erent thermo-environomic criteria. By including the economic conditions sensi-tivity in the decision-making step, it appears that apart from the economic market conditions, the CO2capture rate is a key factor defining the economic competitiveness. Post-combustion CO2 capture reveals to be economically
competitive for capture rates between 70 and 80% when a carbon tax is introduced. This contradicts the rates up to 95% CO2 capture that are
typ-ically recommended . It is shown that for specific economic conditions (i.e.
introduction of a carbon tax) CCS can become an energy, cost and environ-mental efficient alternative on the future energy market when compared to a conventional NGCC plant.
For the polygeneration of SNG, heat and power from biomass, it is re-vealed that the most economically competitive process design is highly in-fluenced by the gasifier and the methane upgrading technology. In figure 8 one can see that, considering the uncertainty analysis, the most probable best solutions lies in the right of the Pareto curve. This part of the Pareto
cor-responds to high efficiency (one of the objective function that is optimized)
and as well high investment. This shows that for the selected economic
solu-tions, it is important to promote the development of efficient processes even
if those are more expensive. This can be explained by the benefit of selling the coproduced heat and power that adds to the produced SNG-fuel and that compensate the increase of the investment.
The use of the uncertainty analysis method is a powerful tool to help in the identification of the best process designs by highlighting the designs that have the highest probability of being the best considering the variability of the economic conditions. Such a tool is therefore an important tool to generate a limited list of configurations to be compared.
References
[1] ZEP . The costs of CO2 capture, transport and stor-age - Post-demonstration CCS in the EU. Report; Euro-pean Technology Platform; Brussels, Belgium; 2011. URL
http://www.zeroemissionsplatform.eu/library.html.
[2] Finkenrath M. Cost and performance of carbon dioxide capture from power generation. Report; International Energy Agency; Paris, France; 2011.
[3] Basson L, Petrie J. A critical systems approach to decision support for process engineering. Computers & Chemical Engineering 2007;31(8):876 –88.
[4] Bortz M, Burger J, Asprion N, Blagov S, Bttcher R, Nowak U, et al. Multi-criteria optimization in chemical process design and decision sup-port by navigation on pareto sets. Computers & Chemical Engineering 2014;60(0):354 –63.
[5] Burger J, Asprion N, Blagov S, B¨ottcher R, Nowak U, Bortz M, et al. Multi-objective optimization and decision support in process engineering–implementation and application. Chemie Ingenieur Tech-nik 2014;86(7):1065–72.
[6] Hu M, Cho H. A probability constrained multi-objective optimization model for {CCHP} system operation decision support. Applied Energy 2014;116(0):230 –42.
[7] Gaspar Cunha A, Ferreira J, Covas J, Recio G. Selection of solu-tions in multi-objective optimization: Decision making and robust-ness. In: Computational Intelligence in Multi-Criteria Decision-Making (MCDM), 2014 IEEE Symposium on. 2014,.
[8] Gerber L, Gassner M, Mar´echal F. Systematic integration of LCA in process systems design: Application to combined fuel and electricity production from lignocellulosic biomass. Computers & Chemical Engi-neering 2011;35:1265 –80.
[9] Tock L, Mar´echal F. Platform development for studying integrated en-ergy conversion processes: Application to a power plant process with CO2 capture. Computer-aided Chemical Engineering 2012;31:1015–9. [10] IEA . Key World Energy Statistics. Report; International Energy
Agency; Paris, France; 2012.
[11] IEA . Medium-term Oil & Gas Markets. Report; International Energy Agency; Paris, France; 2011.
[12] European Commission . EU energy trends to 2030 - Update 2009. Re-port; European Commission; 2010.
[13] Eurostat . European Commission.
http://epp.eurostat.ec.europa.eu/portal/page/portal/eurostat/home;
last visited 20/05/2014.
[14] EU . Energy roadmap 2050. Communication from the Commission to the Council, the European Parliament, the European Economic and
Social Committee and the Committee of Regions. SEC(2011) 1565/2; European Commission; Luxembourg; 2011.
[15] European Commission . The state of the european carbon market in 2012. Report from the Commission to the European Parliament and the council COM(2012) 652; European Commission; 2012.
[16] Gassner M, Mar´echal F. Methodology for the optimal thermo-economic, multi-objective design of thermochemical fuel production from biomass. Computers & Chemical Engineering 2009;33:769–81.
[17] Mar´echal F, Kalitventze↵ B. Process integration: Selection of the opti-mal utility system. Computers & Chemical Engineering 1998;22:149–56. [18] Turton R. Analysis, Synthesis, and Design of Chemical Processes. Upper
Saddle River, N.J, United States: Prentice Hall; 3rd ed ed.; 2009. [19] Ulrich G, Vasudevan P. A Guide to Chemical Engineering Process
De-sign and Economics a Practical Guide. Boca Raton, Fla, United States: CRC; 2nd ed ed.; 2003.
[20] Molyneaux A, Leyland G, Favrat D. Environomic multi-objective op-timisation of a district heating network considering centralized and de-centralized heat pumps. Energy 2010;35(2):751–8.
[21] Brown TR, Wright MM. Techno-economic impacts of shale gas on cel-lulosic biofuel pathways. Fuel 2014;117, Part B(0):989 –95.
report on carbon dioxide capture and storage. Report; Cambridge Uni-versity Press; Cambridge, England; 2005.
[23] Meerman J, Hamborg E, van Keulen T, Ram´ırez A, Turkenburg W, Faaij A. Techno-economic assessment of CO2 capture at steam methane re-forming facilities using commercially available technology. International Journal of Greenhouse Gas Control 2012;9(0):160–71.
[24] Kanniche M, Gros-Bonnivard R, Jaud P, Valle-Marcos J, Amann J, Bouallou C. Pre-combustion, post-combustion and oxy-combustion in thermal power plant for CO2 capture. Applied Thermal Engineering 2010;30(1):53–62.
[25] Cormos CC, Padurean A, Agachi PS. Technical evaluations of car-bon capture options for power generation from coal and biomass based on integrated gasification combined cycle scheme. Energy Procedia 2011;4(0):1861–8.
[26] Berstad D, Arasto A, Jordal K, Haugen G. Parametric study and bench-marking of NGCC, coal and biomass power cycles integrated with MEA-based post-combustion CO2 capture. Energy Procedia 2011;4(0):1737– 44.
[27] Romano MC, Chiesa P, Lozza G. Pre-combustion CO2 capture from natural gas power plants, with ATR and MDEA processes. International Journal of Greenhouse Gas Control 2010;4(5):785–97.
[28] Kvamsdal HM, Jordal K, Bolland O. A quantitative comparison of gas turbine cycles with CO2 capture. Energy 2007;32(1):10–24.
[29] Singh B, Strømman AH, Hertwich E. Life cycle assessment of natural gas combined cycle power plant with post-combustion carbon capture, transport and storage. International Journal of Greenhouse Gas Control 2011;5(3):457 –66.
[30] Viebahn P, Nitsch J, Fischedick M, Esken A, Sch¨uwer D, Supersberger N, et al. Comparison of carbon capture and storage with renewable energy technologies regarding structural, economic, and ecological as-pects in Germany. International Journal of Greenhouse Gas Control 2007;1(1):121–33.
[31] Abu-Zahra MR, Niederer JP, Feron PH, Versteeg GF. CO2 capture from power plants: Part II. A parametric study of the economical performance based on mono-ethanolamine. International Journal of Greenhouse Gas Control 2007;1(2):135–42.
[32] Tock L, Mar´echal F. Process design optimization strategy to develop energy and cost correlations of co2 capture processes. Computers & Chemical Engineering 2014;61(0):51 –8.
[33] Tock L, Mar´echal F. H2 processes with CO2 mitigation: Thermo-economic modeling and process integration. International Journal of Hydrogen Energy 2012;37:11785–95.
[34] Tock L, Mar´echal F. CO2 mitigation in thermo-chemical hydrogen pro-cesses: Thermo-environomic comparison and optimization. Energy Pro-cedia 2012;29(0):624 –32.
[35] Tock L, Mar´echal F. Co-production of hydrogen and electricity from lignocellulosic biomass: Process design and thermo-economic optimiza-tion. Energy 2012;45:339–49.
[36] Gassner M, Marechal F. Thermo-economic optimisation of the poly-generation of synthetic natural gas (sng), power and heat from lignocel-lulosic biomass by gasification and methanation. Energy and Environ-mental Science 2012;5:5768–89.
[37] WVS . Swiss forest owners association, Energy wood price statistics.
http://www.wvs.ch/en/home.html ; last visited 20/05/2014.
[38] ElCom . Swiss Federal Electricity Comission ElCom, Electricity price overview. http://www.elcom.admin.ch/?lang=en; last visited 20/05/2014.
[39] NGVA Europe . Natural & bio Gas
Ve-hicle Association, European NGVA statistics.
http://www.ngvaeurope.eu/european-ngv-statistics ; last visited
Appendix
SNG production process options
The database of the Pareto-optimal SNG processes’ flowsheets was gener-ated in [36]. The database consist of 118 Pareto fronts listed here below. The technology scenarios names are labeled according the following abbreviations.
• FICFB: FICFB gasification at atmospheric pressure
• pFICFB: pressurised FICFB gasification
• pFICFBgt: pressurised FICFB gasification with power recovery by ex-panding the flue gases in turbine
• CFBO2: pressurised CFB gasification directly heated with oxygen
• XY: X: CO2-removal technology (X=BN CO2REM; 1/4: PSA
down-stream/upstream of methanation; 2/5: Selexol absorption downdown-stream/upstream of methanation; 3: membrane cascade downstream methanation) Y:
drying technology (Y=BN DRY-1; 0: air drying, 1: steam drying)
• tor: with torrefaction (i.e. BN PYR=4, otherwise BN PYR=0)
• hcl: hot gas cleaning (i.e. BN GCL=2, otherwise cold gas cleaning (BN GCL=1))
• nodh: without district heating (i.e. BN DH=0, otherwise with heat cogeneration into a 110/70oCdistribution grid (BN DH=1))
Numbered list of all the technology scenarios considered for the SNG production:
1. CFBO2 10 2. CFBO2 10 hcl 3. CFBO2 10 hcl nodh 4. CFBO2 10 nodh 5. CFBO2 11 6. CFBO2 11 hcl 7. CFBO2 11 hcl nodh 8. CFBO2 11 nodh 9. CFBO2 20 10. CFBO2 20 hcl 11. CFBO2 20 hcl nodh 12. CFBO2 20 nodh 13. CFBO2 21 14. CFBO2 21 hcl 15. CFBO2 21 hcl nodh 16. CFBO2 21 nodh 17. CFBO2 30 18. CFBO2 30 hcl 19. CFBO2 30 hcl nodh 20. CFBO2 30 nodh 21. CFBO2 31 22. CFBO2 31 hcl 23. CFBO2 31 hcl nodh 24. CFBO2 31 nodh 25. CFBO2 40 26. CFBO2 40 nodh 27. CFBO2 41 28. CFBO2 41 nodh 29. CFBO2 50 30. CFBO2 50 nodh 31. CFBO2 51 32. CFBO2 51 nodh 33. FICFB 10 34. FICFB 10 nodh 35. FICFB 10 tor 36. FICFB 10 tor nodh 37. FICFB 11
38. FICFB 11 nodh 39. FICFB 11 tor 40. FICFB 11 tor nodh
41. FICFB 20 42. FICFB 20 nodh 43. FICFB 20 tor 44. FICFB 20 tor nodh 45. FICFB 21
46. FICFB 21 nodh 47. FICFB 21 tor 48. FICFB 21 tor nodh 49. FICFB 30
50. FICFB 30 nodh 51. FICFB 30 tor 52. FICFB 30 tor nodh 53. FICFB 31
54. FICFB 31 nodh 55. FICFB 31 tor 56. FICFB 31 tor nodh 57. FICFB 40
58. FICFB 40 nodh 59. FICFB 40 tor 60. FICFB 40 tor nodh 61. FICFB 41
62. FICFB 41 nodh 63. FICFB 41 tor 64. FICFB 41 tor nodh 65. FICFB 50
66. FICFB 50 nodh 67. FICFB 50 tor 68. FICFB 50 tor nodh 69. FICFB 51
70. FICFB 51 nodh 71. FICFB 51 tor 72. FICFB 51 tor nodh 73. pFICFB 10 74. pFICFB 10 hcl 75. pFICFB 10 hcl nodh 76. pFICFB 10 nodh 77. pFICFB 11 78. pFICFB 11 hcl 79. pFICFB 11 hcl nodh 80. pFICFB 11 nodh 81. pFICFB 20 82. pFICFB 20 hcl 83. pFICFB 20 hcl nodh 84. pFICFB 20 nodh 85. pFICFB 21 86. pFICFB 21 hcl 87. pFICFB 21 hcl nodh 88. pFICFB 21 nodh 89. pFICFB 30 90. pFICFB 30 hcl 91. pFICFB 30 hcl nodh 92. pFICFB 30 nodh 93. pFICFB 31 94. pFICFB 31 hcl 95. pFICFB 31 hcl nodh 96. pFICFB 31 nodh 97. pFICFBgt 10 98. pFICFBgt 10 hcl nodh 99. pFICFBgt 10 nodh 100. pFICFBgt 11 101. pFICFBgt 11 hcl 102. pFICFBgt 11 hcl nodh 103. pFICFBgt 11 nodh 104. pFICFBgt 20 105. pFICFBgt 20 hcl 106. pFICFBgt 20 hcl nodh 107. pFICFBgt 20 nodh 108. pFICFBgt 21 109. pFICFBgt 21 hcl 110. pFICFBgt 21 hcl nodh 111. pFICFBgt 21 nodh 112. pFICFBgt 30 113. pFICFBgt 30 hcl 114. pFICFBgt 30 hcl nodh 115. pFICFBgt 30 nodh 116. pFICFBgt 31 117. pFICFBgt 31 hcl nodh 118. pFICFBgt 31 nodh

![Table 4: Definition of the economic scenarios and parameters of the distribution functions for the economic assumptions.The distribution functions are set up based on values from [10, 11, 14, 12, 13, 1]](https://thumb-us.123doks.com/thumbv2/123dok_us/806633.2601959/18.918.199.714.524.672/definition-scenarios-parameters-distribution-functions-assumptions-distribution-functions.webp)