Munich Personal RePEc Archive
Economic efficiency analysis of vegetable
production systems during 2011-2014
Ursu, Ana
Research Institute for Agriculture Economy and Rural Development,
Bucharest, Romania
20 November 2014
Online at
https://mpra.ub.uni-muenchen.de/61776/
ECONOMIC EFFICIENCY ANALYSIS OF VEGETABLE PRODUCTION
SYSTEMS DURING 2011-2014
ANA URSU1
Summary: Economic efficiency plays an important role in the foundation and farm level decisions, constituting a basic criterion in assessing the level of economic activity and development prospects. The study aimed to analyze the economic efficiency of crop production systems, measured through indicators that contribute to an overall picture of the actual conditions of economic efficiency for the analyzed period. For this study were quantified following indicators: income from operations, operating costs, labor productivity and rate of return on different types of farms of different sizes. The analysis concluded that indicators production year 2013-2014 has showed a lower level of economic efficiency compared with 2011-2012 production year; comparison of the two production systems that irrigated production system provides a rate of return of about 9-10% higher than non-irrigated system. Comparing labor productivity in terms of value (lei / Man-hour) the types of farms of different sizes that hourly labor productivity increases with economic size of holding and decreases as the number of man-hours to 1000 lei incomes increase.
Keywords:economic efficiency, production systems, labor productivity, profitability
INTRODUCTION
The concepts of efficiency is treated in economic theory and practice various forms of manifestation of the results of economic agents, such as profitability, productivity of factors of production, capital efficiency, reduced costs, etc. Economic efficiency is closely related to the use of resources in the economy and its essential feature is the causal effort / effect. Doing a conceptual treatment summarizing the opinions of economic efficiency can conclude that economic efficiency is a complex economic category expressed in the most comprehensive results are obtained in an activity. The scale is expressed by farm labor productivity, profitability, unit production cost. A high efficiency is obtained with a modern technology that makes the most of raw materials and energy, providing high quality products at low cost.
MATERIAL AND METHOD
The methodology chosen for this study was to design plant production systems adapted plains, in different shapes and sizes of farm, level indicators and sub-indicators.
For economic efficiency analysis were performed technical and economic projections for 2011-2014 holding module 20 hectares (irrigated and non-irrigated), 200 hectares (irrigated and non-irrigated), and 1,000 hectares (irrigated and non-irrigated). These projections are based on technological estimates and budgets of income and expenses for each crop, how to farm and year of production.
The average yields set out to achieve, are in accordance with "study to determine potential areas, geographical areas and unitary standard gross margins" for proictele under Measure 3.1. "Investments in agricultural holdings" of the SAPARD program, developed by the ASAS-ICPA and ICEADR 2004.
Getting set production can be achieved through proper management of inputs, based on scientific rules determnare.
Estimated recovery prices for crops production structures studied:
- For the year 2011-2012: 1.1 lei / kg for wheat, 0.99 euro / kg in corn, 0.875 lei / kg barley 1.95 lei / kg sunflower, 4.0 lei / kg beans, 2.15 lei / kg soybean, 1.8 lei / kg Rape, 0.30 lei / kg of sugar beet
- For the year 2013-2014: 0.77 euro / kg for wheat, 0.98 euro / kg in corn, 0.685 lei / kg barley, 1.9 lei / kg sunflower, 3.5 lei / kg beans, 1.8 lei / kg soybean, 1,750 lei / kg rape, 0.275 lei / kg of sugar beet
1
RESULTS AND DISCUSSION
Economic efficiency analysis modules designed holding
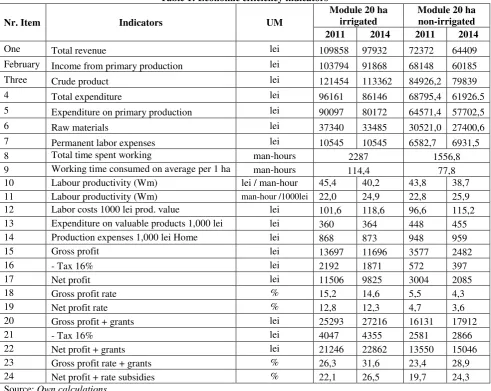
[image:3.595.53.545.241.632.2]Module 20 ha (table 1) is specific households and has been developed in two production: irrigated and non-irrigated system. The irrigation system four production activities are summarized wheat, corn, sunflowers, beans, sugar beet and irrigated also appears barley activity formed in the two ha of the total 20 hectares. Corn is grown on the largest area in this way, and accounts for 30% of the total area. The production value is obtained from corn but only 35.8% of the value obtained at farm level, because lower profitability per hectare recorded in this culture, to an average of 4800 kg / ha. Sugar beet is cultivated although only 10% of farmland has the largest contribution to production value obtained 19.2% of the value obtained in farm irrigated and non-irrigated system by 21%.
Table 1: Economic efficiency indicators
Nr. Item Indicators UM
Module 20 ha irrigated
Module 20 ha non-irrigated
2011 2014 2011 2014
One Total revenue lei 109858 97932 72372 64409
February Income from primary production lei 103794 91868 68148 60185
Three Crude product lei 121454 113362 84926,2 79839
4 Total expenditure lei 96161 86146 68795,4 61926.5
5 Expenditure on primary production lei 90097 80172 64571,4 57702,5
6 Raw materials lei 37340 33485 30521,0 27400,6
7 Permanent labor expenses lei 10545 10545 6582,7 6931,5
8 Total time spent working man-hours 2287 1556,8
9 Working time consumed on average per 1 ha man-hours 114,4 77,8
10 Labour productivity (Wm) lei / man-hour 45,4 40,2 43,8 38,7
11 Labour productivity (Wm) man-hour /1000lei 22,0 24,9 22,8 25,9
12 Labor costs 1000 lei prod. value lei 101,6 118,6 96,6 115,2
13 Expenditure on valuable products 1,000 lei lei 360 364 448 455
14 Production expenses 1,000 lei Home lei 868 873 948 959
15 Gross profit lei 13697 11696 3577 2482
16 - Tax 16% lei 2192 1871 572 397
17 Net profit lei 11506 9825 3004 2085
18 Gross profit rate % 15,2 14,6 5,5 4,3
19 Net profit rate % 12,8 12,3 4,7 3,6
20 Gross profit + grants lei 25293 27216 16131 17912
21 - Tax 16% lei 4047 4355 2581 2866
22 Net profit + grants lei 21246 22862 13550 15046
23 Gross profit rate + grants % 26,3 31,6 23,4 28,9
24 Net profit + rate subsidies % 22,1 26,5 19,7 24,3
Source: Own calculations
Analysis of revenue: the total activity, revenue recorded a decrease of 1.13 times in 2013-2014 compared to 2011-2012. The decrease in revenues was driven by lower selling prices of production. Revenues are irrigated with 1.52 times higher than in non-irrigated system, the decisive contribution in this regard starring increase yields per hectare. The correlation coefficient between the index of income and expenditure index is greater than one, the pace of decline of revenues ranging from 1.05 (irrigated) and 1.15 (irrigated) in 2013-2014 to 1.04 (neirgat) and 1, 14 (irrigated) in 2011-2012. Reducing income reflects directly on the indicator expenses 1,000 lei income.
reduction index inflation of 3.2% (2011-2012) to 2.8% (2013-2014) according to the National Weather Institute.
1000 lei revenue expenditure a slight increase from 868 lei (2011) 873 lei (2014) - irrigated and 948 lei (2011) to 959 lei (2014) - sitem neirgat, which means that the farmer in this module covers all costs Operation and get a small benefit, as evidenced and Rate taxable income
which is between 14.6% and 15.2%, irrigated, compared to only 4.3% and 5.5% in irrigated system.
Labour productivity was calcualată wide activities, total farm modules. Total work time
spent (effort) with production values obtained (effect) reveals the degree of economic efficiency of labor exploitation modules designed. It can be appreciated that in the period 2011-2014, labor productivity based on value of production at farm level and fund time varies as follows: the irrigated labor productivity ranges from 22.8 man-hours to 1000 lei production value (2011) to 25.9 man-hours to 1000 lei production value (2014), and the irrigated labor productivity ranges from 22.0 man-hours to 1000 lei production value (2011) to 24.9 man-hours to 1,000 lei production value. It follows that labor productivity declined as working time consumed to 1000 lei production value in 2014 increased compared to 2011 with 3.1 man-hours to 2.9 hours non-irrigated and irrigated-man which means a reduction in economic efficiency of the labor front of 2011-2012. The results were in line with available created by holding the level of competitiveness in labor productivity related to the corresponding production.
Module 200 ha
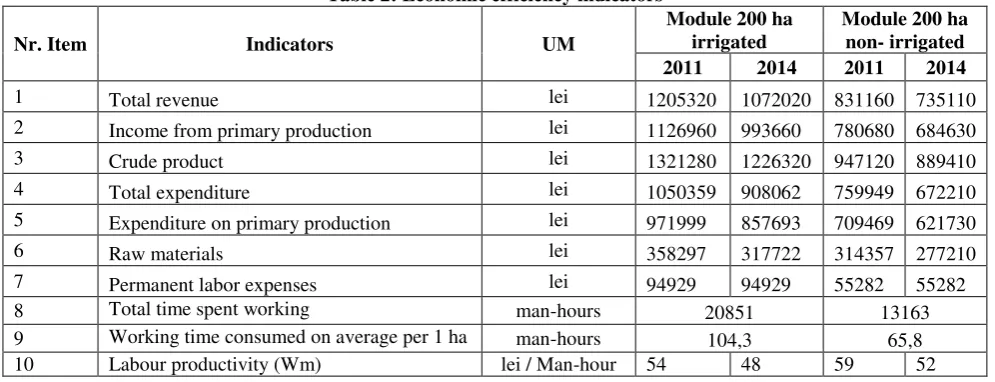
Module 200 ha (table 2) has an economic dimension top and were designed farmers organized into family associations being developed in two productions: irrigated and non-irrigated system. The irrigation system production seven activities are summarized wheat, corn, barley, sunflower, soybean, sugar beet, oilseed rape. Corn is grown on the largest area in this way, and accounts for 33% of the total area of 200 ha. Revenues highest level of activity but how are obtained from sugar beet, which although only 5% of cultivated area, has a 10.3% contribution to total value of production from the farm. Activity barley also provides a good return, 22.7% of taxable income rate, while significant subsidies granted to the sunflower crop this activity lies third place (12%) in terms of income per hectare made the farm. In irrigated system are contained the same activities as irrigated system, but different cultures share in the structure of production. Soy Lowers surface half (5% to 10% as they were in irrigation system) and increase in rapeseed area to 13% (compared to 4% in irrigation system). A lower yield obtained in this production system achieves an output value 33.3% lower than the irrigation system. Activity wheat has the highest share both in size (32% of the total 1000 ha) but the production value obtained (26.5% of total production) is lower than that obtained from corn (30%) in the system.
[image:4.595.50.548.590.781.2]Activity sugar beet is the most effective in the module, rate taxable income (Gross profit) was 21.5% in this culture.
Table 2: Economic efficiency indicators
Nr. Item Indicators UM
Module 200 ha irrigated
Module 200 ha non- irrigated
2011 2014 2011 2014
1 Total revenue lei 1205320 1072020 831160 735110
2 Income from primary production lei 1126960 993660 780680 684630
3 Crude product lei 1321280 1226320 947120 889410
4 Total expenditure lei 1050359 908062 759949 672210
5 Expenditure on primary production lei 971999 857693 709469 621730
6 Raw materials lei 358297 317722 314357 277210
7 Permanent labor expenses lei 94929 94929 55282 55282
8 Total time spent working man-hours 20851 13163
9 Working time consumed on average per 1 ha man-hours 104,3 65,8
11 Labour productivity (Wm) Man-hour /
1000 lei 18.5 21.0 16.9 19.2
12 Labor costs 1000 lei prod. value lei 84.2 95.5 70.8 80.7
13 Expenditure on valuable products 1,000 lei lei 318 320 403 405
14 Expenses 1,000 lei main prod lei 862 863 909 908
15 Gross profit lei 154961 135967 71211 62900
16 - Tax 16% lei 24794 21755 11394 10064
17 Net profit lei 130167 114212 59817 52836
18 Gross profit rate % 15,9 15,9 10,0 10,1
19 Net profit rate % 13,4 13,3 8,4 8,5
20 Gross profit + grants lei 270921 318258 187171 217200
21 - Tax 16% lei 43347 50921 29947 34752
22 Net profit + grants lei 227574 267337 157223 182448
23 Gross profit rate + grants % 25,8 35,0 24,6 32,3
24 Net profit + rate subsidies % 21,7 29,4 20,7 27,1
Source: Own calculations
Analysis of revenue: the total activity, revenue recorded a decrease of 1.14 times in 2013-2014 compared to 2011-2012. The decrease in revenues was driven by lower selling prices of production. Revenues are irrigated with 1.45 times higher than in non-irrigated system, the decisive contribution in this regard starring increase yields per hectare. The correlation coefficient between the index of income and expenditure index is greater than one, the rate of decrease of income over expenditure ranging from 1.10 (irrigated) to 1.16 (irrigated) in 2011-2014.
Expenditure Review: the total activity costs have been reduced by 1.14 times (irrigated system) and 1.13 times (irrigated) in 2013-2014 compared to 2011-2012 this reduction, attesting first reduction index inflation of 3.2% (2011-2012) to 2.8% (2013-2014) according to the National Weather Institute.
1000 lei revenue expenditure no differences between the two production systems, lower costs 1.05 times irrigated (863 lei to 1000 lei income) from non-irrigated (908 lei lei 1000 revenue). Comparing the two modules holding non-irrigated and irrigated system operated at 200 ha irrigated module, work on the farm is less profitable, as evidenced rate and taxable income (10%) to 200 ha irrigated module that has a income rate of 15.9%, but allow the resumption of production and allocation of funds for development profit (recommended 50%) to achiziţeiei of new agricultural machinery and equipment required for the farm. Comparâd two study periods 2013-2014 to
2011-2012, the modules do not show significant diferenţeiri to mark the two periods of production.
Labour productivity was calcualată wide activities, total farm modules. It can be
appreciated that in the period 2011-2014, labor productivity based on value of production at farm level and fund time varies as follows: the irrigated. Labor productivity ranges from 18.5 man-hours to 1,000 lei production value (2011) to 21.0 man-man-hours to 1000 lei production value (2014), and for irrigation, labor productivity ranges from 16.9 man-hours to 1000 lei production value (2011) to 19.2 man-hours to 1,000 lei production value. It follows that labor productivity declined as working time consumed to 1000 lei production value in 2014 increased compared to 2011 with 3.5 man-hours to 2.3 hours non-irrigated and irrigated-man which means a reduction in economic efficiency of the labor front of 2011-2012. The results were in line with available created by holding the level of competitiveness in labor productivity related to the corresponding production.
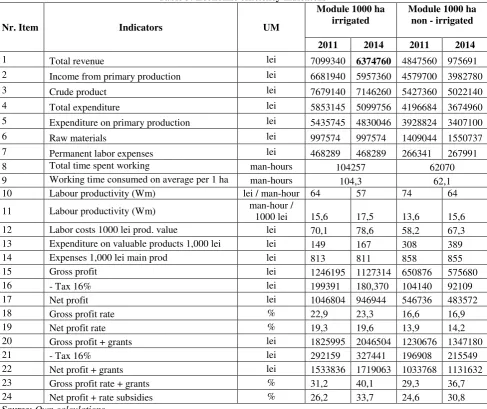
Module 1 000 ha
Table 3: Economic efficiency indicators
Nr. Item Indicators UM
Module 1000 ha irrigated
Module 1000 ha non - irrigated
2011 2014 2011 2014
1 Total revenue lei 7099340 6374760 4847560 975691
2 Income from primary production lei 6681940 5957360 4579700 3982780
3 Crude product lei 7679140 7146260 5427360 5022140
4 Total expenditure lei 5853145 5099756 4196684 3674960
5 Expenditure on primary production lei 5435745 4830046 3928824 3407100
6 Raw materials lei 997574 997574 1409044 1550737
7 Permanent labor expenses lei 468289 468289 266341 267991
8 Total time spent working man-hours 104257 62070
9 Working time consumed on average per 1 ha man-hours 104,3 62,1
10 Labour productivity (Wm) lei / man-hour 64 57 74 64
11 Labour productivity (Wm) man-hour /
1000 lei 15,6 17,5 13,6 15,6
12 Labor costs 1000 lei prod. value lei 70,1 78,6 58,2 67,3
13 Expenditure on valuable products 1,000 lei lei 149 167 308 389
14 Expenses 1,000 lei main prod lei 813 811 858 855
15 Gross profit lei 1246195 1127314 650876 575680
16 - Tax 16% lei 199391 180,370 104140 92109
17 Net profit lei 1046804 946944 546736 483572
18 Gross profit rate % 22,9 23,3 16,6 16,9
19 Net profit rate % 19,3 19,6 13,9 14,2
20 Gross profit + grants lei 1825995 2046504 1230676 1347180
21 - Tax 16% lei 292159 327441 196908 215549
22 Net profit + grants lei 1533836 1719063 1033768 1131632
23 Gross profit rate + grants % 31,2 40,1 29,3 36,7
24 Net profit + rate subsidies % 26,2 33,7 24,6 30,8
Source: Own calculations
Analysis of revenue: the total activity, revenue recorded a decrease of 1.15 times and 1.12 times irrigated irrigated during the 2013-2014 to 2011-2012 production. The decrease in revenues was driven by lower selling prices of agricultural products. Revenues are irrigated with 1.46 to 1.50 times higher than in non-irrigated system, the decisive contribution in this regard starring increase yields per hectare. The correlation coefficient between the index of income and expenditure index is greater than one, the rate of decrease of income over expenditure ranging from 1.17 (irrigated) to 1.23 (irrigated) in 2011-2014.
Expenditure Review: the total activity costs have been reduced by 1.15 times (irrigated system) and 1.13 times (irrigated) in 2013-2014 compared to 2011-2012 this reduction, attesting first reduction index inflation of 3.2% (2011-2012) to 2.8% (2013-2014) according to the National Weather Institute.
1000 lei revenue expenditure no differences between the two production systems, lower costs 1.05 times irrigated (813-811 lei lei 1000 revenues) compared to non-irrigated (858-855 lei lei 1000 revenue). Comparing the two modules holding non-irrigated and irrigated system operated at 1000 ha irrigated module, work on the farm is less profitable, as evidenced rate and taxable income (16.6% - 16.9%) compared to module 1000 ha irrigated which has a 22.9% rate of income - 23%, but allows resumption of production and profit allocation of funds for development (50%
recommended) to achiziţeiei of new agricultural machinery and equipment required for the farm. Comparâd two study periods 2013-2014 to 2011-2012, the modules do not show significant
Labour productivity was calcualată wide activities, total farm modules. It can be appreciated that in the period 2011-2014, labor productivity based on value of production at farm level and fund time varies as follows: the irrigated. Labor productivity ranges from 13.6 man-hours to 1,000 lei production value (2011) to 15.6 man-man-hours to 1000 lei production value (2014), and for irrigation, labor productivity ranges from 15.6 man-hours to 1000 lei production value (2011) to 17.5 man-hours to 1,000 lei production value. It follows that labor productivity declined as working time consumed to 1000 lei production value in 2014 increased compared to 2011 with two man-hours in non-irrigated and irrigated 1.9 man-hours in which which means a reduction in economic efficiency of the labor front of 2011-2012.
CONCLUSIONS
Considering the above, the analysis of economic efficiency of crop production systems in the period 2011-2014, and the following conclusions:
- Comparing the two periods of production, total activity, revenues in 2013-2014 showed a reduction of 1.13 times compared to 2011-2012 due to the volatility of agricultural prices;
- Comparing the two production systems, irrigated and non-irrigated, irrigation system proceeds are greater than those obtained in irrigated systems;
- Determination of variation of income that enables us according to all natural and economic factors affecting production structure to choose crops with the highest stability (lowest coefficient of variation). Income stability is a necessary condition for self-management of farmers who have to cover from own revenues and profits.
- Production flexibility program seeks permanent adaptation of production to local natural and economic conditions to achieve maximum profitability. It removes the risk of losses caused farmer as a result of cyclical changes or perspective that it operates in the production structure based on the advantages that it offers a culture or another.
- Comparing labor productivity in terms of value (lei / Man-hour) the types of farms of different sizes, that labor productivity increases with economic size of holding and decreases as the number of man-hours to 1000 lei incomes increase.
- The economic results of small farms can improve the diversification of agricultural activities (vegetable, livestock) and for large farms, the results can be improved by investing in tractors and related equipment.
- Analyses of economic efficiency achieved by designing modules have a high economic viability in terms of obtaining yields scheduled.
- Variety and factors leading causes of deviations on the size indicators requires equally diverse solutions. Other examples as comprehensive as can not provide general solutions, but suggest methods of interpretation of situations.
- Background economic decisions primarily on efficiency criteria in this context, primarily through cost management are a basic requirement.
REFERENCES
[1] Budică Elias (1998), " Short and long-term profitability"Economic Tribune, Bucharest;
[2] C. Cojocaru Constantin (2000) "Economic and financial analysis of farm and forestry" Second edition, Economic Publishing House, Bucharest
[3] Joseph George (2000) "Economic and financial analysis company in food", Economic Tribune Publishing House, Bucharest
[4] Ana Ursu, Dinu Toma, Mihai Nicolescu (2008) "Guide economic and technical management in the crop production system", University Publishing House, Bucharest