Kristine Beaulieu
Submitted in accordance with the requirements for the degree of Doctor of Philosophy
The University of Leeds School of Psychology
The candidate confirms that the work submitted is her own, except where work which has formed part of jointly-authored publications has been included. The contribution of the candidate and the other authors to this work has been explicitly indicated below. The candidate confirms that appropriate credit has been given within the thesis where reference has been made to the work of others.
Chapter 2 of this thesis was based in part on the jointly-authored publications:
Beaulieu, K., Hopkins, M., Blundell, J., & Finlayson, G. (2015) Does Habitual Physical Activity Increase the Sensitivity of the Appetite Control System? A Systematic Review. J Sports Sci, 33(Supplement 1), s85-s86.
Beaulieu, K., Hopkins, M., Blundell, J. E., & Finlayson, G. (2016). Does Habitual Physical Activity Increase the Sensitivity of the Appetite Control System? A Systematic Review. Sports Med, 46(12), 1897-1919.
Chapter 4 of this thesis was based in part on the jointly-authored publications:
Beaulieu, K., Hopkins, M., Blundell, J., & Finlayson, G. (2016) Appetite responses under conditions of passive overconsumption in physically active compared to inactive individuals. Obes Rev, 17(Supplement 2), 86.
Beaulieu, K., Hopkins, M., Blundell, J. E., & Finlayson, G. (2017). Impact of physical activity level and dietary fat content on passive overconsumption of energy in non-obese adults. Int J Behav Nutr Phys Act, 14(14).
Chapter 5 of this thesis was based in part on the jointly-authored publications:
Beaulieu, K., Long, C.,Hopkins, M., Blundell J. E., Finlayson, G. (2017). Habitual physical activity and satiety: confirmatory evidence for enhanced homeostatic appetite control in physically active individuals. Obes Facts, 10(Suppl 1), 8.
Beaulieu, K., Hopkins, M., Long, C.,Blundell J. E., Finlayson, G. (2017). High
Habitual Physical Activity Improves Acute Energy Compensation in Nonobese Adults. Med Sci Sports Exerc, 49(11), 2268-2275.
Chapters 1 and 8 of this thesis were based in part on the jointly-authored publication:
Beaulieu, K., Hopkins, M., Blundell, J. E., Finlayson, G. (2017). Homeostatic and non-homeostatic appetite control along the spectrum of physical activity levels: An updated perspective. Physiol Behav, doi: 10.1016/j.physbeh.2017.12.032.
The candidate confirms that her contribution was primarily intellectual and she took a primary role in the production of the substance and writing of each of the above. Her co-authors confirm that their contribution to each of the publications was in guiding the research presented and its evaluation as well as editing drafts of the manuscripts.
This copy has been supplied on the understanding that it is copyright material and that no quotation from the thesis may be published without proper acknowledgement.
The right of Kristine Beaulieu to be identified as Author of this work has been asserted by her in accordance with the Copyright, Designs and Patents Act 1988.
Acknowledgements
The research in Chapter 5 of this thesis has been carried out with the SCOPE study team that has included Cecilia Long. My own contributions, fully and explicitly
indicated in the thesis, have been in the design of the project, data collection, physical activity level data analysis and thesis/manuscript write up. Miss Long’s contributions have been part of the project design and data collection. The research in Chapter 7 of this thesis has been carried out by the DIVERSE study team that has included
Professor John Blundell, Dr Graham Finlayson, Dr Phillipa Caudwell, Dr Catherine Gibbons and Dr Mark Hopkins. My own contributions, fully and explicitly indicated in the thesis, have been in the secondary analyses of the archived data and
thesis/manuscript write up. The other members of the team and their contributions have been as follows: Professor John Blundell and Dr Graham Finlayson, project design and overall project supervision; Dr Phillipa Caudwell, Dr Catherine Gibbons and Dr Mark Hopkins, project design and data collection.
This research and thesis could not have been possible without thegreat guidance from my team of supervisors Dr Graham Finlayson, Prof John Blundell and Dr Mark
Hopkins. I have learned so much from all of you over the past three years and am forever grateful for the opportunity to pursue my PhD at Leeds. Thank you for believing in me, challenging me and for your support throughout this journey. I look forward to continuing working together.
To the ACEB girls, Catherine, Cecilia, Anna, Sophie, Nicola and Michelle, I enjoyed all the countless hours in the lab and working with all of you. I hope we can collaborate on many future projects. Denise, Laura and Hannah, thank you for being there for me through it all.
To my family, Maman, Papa, Dominic et Franco, merci de votre support et de m’avoir encouragé à poursuivre cette expérience à l’international remplie de bons moments et de péripéties!
And finally to Adam, this has been an amazing adventure for #TeamTrackie. Thank you for all you’ve done for us, putting up with the stressful moments over these past years and sharing this experience with me.
Abstract
Background: Based on the non-linear relationship between energy intake and physical activity level demonstrated by Mayer et al. (1956), it has been proposed that there is a dysregulation of appetite at lower levels of physical activity leading to
overconsumption, whereas at higher levels of physical activity, appetite control is more sensitive. However, the mechanisms underlying this relationship are not well
understood.
Objective: This thesis aimed to shed light on the impact of habitual physical activity level in lean individuals and exercise training in individuals with overweight and obesity on homeostatic (physiological) and non-homeostatic (hedonic and eating behaviour traits) appetite processes, including those that initiate and terminate feeding (satiation) and suppress inter-meal hunger (satiety), as well as passive overconsumption
(unintentional increase in energy intake with high-energy-density/high-fat foods).
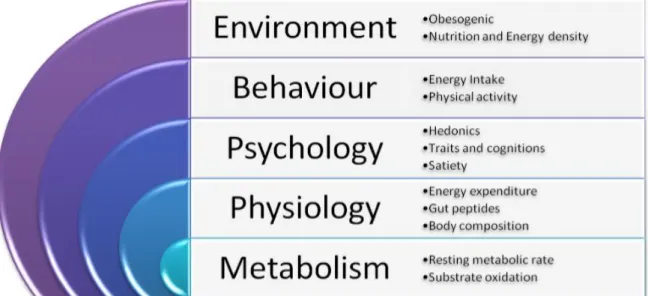
Methods: A systematic review was conducted, followed by four experimental studies. The studies employed a multi-level experimental platform that included biological, behavioural and psychological aspects of energy balance including free-living physical activity, food intake, diet composition, food reward (liking and wanting), body
composition, energy expenditure and fasting appetite-related peptides.
Results: The systematic review revealed a J-shaped relationship betweenphysical activity level and energy intake, corroborating previous findings. Data from the experimental studies indicated that in lean individuals, physical activity did not
influence satiation at meals varying in dietary fat content, but moderate to high active individuals showed enhanced satiety with better ability to adjust intake following preloads varying in energy content. Exercise training (12 weeks) in inactive individuals with overweight and obesity improved both homeostatic and non-homeostatic appetite control, which may be mediated by exercise-induced fat loss. Across all studies, physical activity was associated with lower body fat and greater daily energy expenditure, and energy density was positively associated with energy intake and passive overconsumption.
Conclusions: This thesis provides confirmatory evidence that physical activity impacts appetite control through a dual-process action expressed through an
increased drive to eat from greater energy expenditure, together with enhanced satiety response to food in both lean and overweight/obese individuals. These processes may allow for more accurate matching of energy intake to requirements and a reduction in the risk of overconsumption at higher levels of physical activity.
Table of contents
Acknowledgements ... iv
Abstract ...v
Table of contents ... vii
List of tables ... xiii
List of figures ... xvi
List of abbreviations ... xix
– General introduction and background ...1
1.1 Defining energy balance and appetite control ...1
1.1.1 A note on physical activity, energy expenditure and body composition ...3
1.2 Psychobiological system of appetite control ...4
1.2.1 Satiety Cascade ...4
1.2.2 Gut and appetite-related peptides ...5
1.3 Non-homeostatic factors involved in appetite control ...7
1.4 The influence of body composition and energy expenditure on energy intake ...8
1.5 Energy intake and appetite control along the spectrum of physical activity 9 1.5.1 The impact of physical activity on the mechanisms of appetite control ... 11
1.5.2 Interaction between physical activity and diet composition on energy intake and energy balance ... 14
1.6 Overall thesis aims ... 15
1.6.1 Specific objectives ... 15
Chapter 2 – Does habitual physical activity increase the sensitivity of the appetite control system? A systematic review ... 16
2.1 Introduction ... 16
2.2 Methods ... 17
2.2.1 Search strategy ... 17
2.2.2 Study selection, inclusion, and exclusion... 19
2.2.3 Data extraction and synthesis ... 19
2.2.4 Risk of bias ... 19
2.3 Results ... 20
2.3.2 Exercise-training interventions ... 35
2.4 Discussion ... 48
2.4.1 Appetite control in active and inactive individuals ... 48
2.4.2 Differences in the proposed mechanisms of appetite control ... 50
2.4.3 Methodological considerations ... 51
2.4.4 Review limitations ... 52
2.5 Conclusions ... 53
Chapter 3 – General methods ... 54
3.1 Ethical considerations ... 54
3.1.1 Participant recruitment and screening ... 54
3.2 Scientific approach: Multi-level experimental platform ... 54
3.3 Behavioural measurements ... 55
3.3.1 Energy intake ... 55
3.3.2 Physical activity ... 56
3.4 Psychological measurements ... 58
3.4.1 Hedonics and food reward ... 58
3.4.2 Eating behaviour traits ... 61
3.4.3 Subjective appetite sensations and satiety ... 62
3.5 Physiological measurements ... 63 3.5.1 Energy expenditure ... 63 3.5.2 Appetite-related peptides ... 63 3.5.3 Body composition ... 63 3.5.4 Cardiorespiratory fitness ... 64 3.6 Metabolic measurements ... 64
3.6.1 Resting metabolic rate and substrate oxidation ... 64
3.7 Statistical approach ... 65
Chapter 4 – Impact of physical activity level on the acute satiation response to passive overconsumption ... 66
4.1 Introduction ... 66
4.1.1 Objective & hypotheses ... 67
4.2 Methods ... 67 4.2.1 Participants ... 67 4.2.2 Study design ... 68 4.2.3 Preliminary assessment ... 69 4.2.4 Meal days ... 70 4.2.5 Statistical analysis ... 73
4.3 Results ... 74
4.3.1 Participant characteristics ... 74
4.3.2 Energy intake at breakfast ... 77
4.3.3 Meal size at HFAT and HCHO meals ... 77
4.3.4 Energy intake at HFAT and HCHO meals ... 78
4.3.5 Passive overconsumption ... 78
4.3.6 Subjective appetite ratings ... 79
4.3.7 Satiety quotient ... 83
4.3.8 Palatability ratings ... 84
4.3.9 Food reward ... 85
4.4 Discussion ... 86
4.4.1 Physical activity, body fat and appetite control ... 86
4.4.2 Physical activity and passive overconsumption ... 87
4.4.3 Limitations ... 88
4.4.4 Conclusions ... 89
4.5 Measured MVPA sub-analysis ... 91
4.5.1 Results ... 91
4.5.2 Discussion ... 95
Chapter 5 – Acute effect of objectively-measured physical activity level on satiety, 24-h energy intake and food reward ... 97
5.1 Introduction ... 97 5.1.1 Objective ... 98 5.2 Methods ... 98 5.2.1 Participants ... 98 5.2.2 Study design ... 99 5.2.3 Preliminary assessment ... 100 5.2.4 Meal days ... 100 5.2.5 Statistical analysis ... 106 5.3 Results ... 106 5.3.1 Participant characteristics ... 106
5.3.2 Fixed energy intake: breakfast and preload ... 108
5.3.3 Ad libitum energy intake - NEP ... 109
5.3.4 Ad libitum energy intake - HEP and LEP ... 109
5.3.5 Compensation index ... 111
5.3.6 Subjective appetite ratings – NEP ... 112
5.3.8 Satiety quotient ... 115
5.3.9 Food reward – NEP ... 117
5.3.10 Food reward – HEP and LEP ... 117
5.3.11 Energy expenditure and energy balance ... 120
5.4 Discussion ... 121
5.4.1 Habitual physical activity and energy compensation ... 121
5.4.2 Impact of HEP and LEP on appetite sensations and food reward 123 5.4.3 Impact of physical activity level on daily energy intake and appetite sensations ... 124
5.4.4 Limitations ... 125
5.4.5 Conclusions ... 125
Chapter 6 – Associations among components of physical activity, energy expenditure, energy intake and appetite control ... 127
6.1 Introduction ... 127 6.1.1 Objectives ... 129 6.2 Methods ... 129 6.2.1 Participants ... 129 6.2.2 Study design ... 130 6.2.3 Preliminary assessment ... 130
6.2.4 Free-living energy expenditure and physical activity ... 130
6.2.5 Meal size and 24-h energy intake ... 130
6.2.6 Appetite sensations and satiety quotient ... 131
6.2.7 Food reward ... 131
6.2.8 Statistical analysis ... 131
6.3 Results ... 132
6.3.1 Participant characteristics and inter-correlations ... 132
6.3.2 Associations between physical activity and body composition ... 134
6.3.3 Associations between components of physical activity and energy intake ... 135
6.3.4 Associations between body composition, other components of energy expenditure and energy intake ... 136
6.3.5 The strongest predictor of meal size ... 137
6.3.6 Correlations among the components of physical activity and appetite sensations, SQ, eating behaviour traits, food reward and appetite-related peptides ... 138
6.3.7 Physical activity level analysis ... 141
6.4.1 Physical activity and total daily energy expenditure as drivers of
food intake ... 143
6.4.2 Towards understanding the inter-relationships among physical activity, body composition, energy intake and appetite control in non-obese individuals... 144
6.4.3 Limitations ... 145
6.4.4 Conclusions ... 145
Chapter 7 – Impact of a 12-week exercise intervention on homeostatic and hedonic appetite control in inactive overweight and obese individuals ... 147
7.1 Introduction ... 147
7.1.1 Objective & hypotheses ... 149
7.2 Methods ... 149
7.2.1 Participants ... 149
7.2.2 Study design ... 150
7.2.3 Measures days ... 151
7.2.4 Meal days ... 151
7.2.5 12-week exercise intervention ... 156
7.2.6 Statistical analysis ... 157
7.3 Results ... 157
7.3.1 Compliance with the intervention ... 157
7.3.2 Participant characteristics ... 157
7.3.3 Fixed energy intake: breakfast and lunch ... 158
7.3.4 Ad libitum energy intake: dinner and evening snack box ... 159
7.3.5 Passive overconsumption ... 160
7.3.6 Total daily energy intake ... 161
7.3.7 Hunger ... 162
7.3.8 Satiety quotient ... 163
7.3.9 Food reward ... 165
7.3.10 Are the effects of exercise training on appetite control independent of changes in body composition? ... 166
7.3.11 Cross-sectional associations among determinants of appetite control and HFAT and HCHO energy intake ... 168
7.3.12 Associations among exercise-induced changes in the determinants of appetite control and energy intake ... 169
7.4 Discussion ... 171
7.4.1 The impact of exercise training on the sensitivity of appetite control in overweight and obese individuals ... 172
7.4.2 Distinguishing the impact of exercise on satiation and satiety ... 175
7.4.3 Homeostatic and hedonic determinants of HFAT and HCHO food intake ... 176
7.5 Limitations ... 178
7.6 Conclusions ... 178
Chapter 8 – General discussion ... 180
8.1 Thesis overview ... 180
8.1.1 Systematic review of appetite control in active and inactive individuals or in response to exercise training ... 180
8.1.2 Physical activity, satiation and satiety in non-obese individuals ... 181
8.1.3 Components of physical activity and appetite control ... 182
8.1.4 Exercise training, satiation and satiety in individuals with overweight and obesity ... 183
8.1.5 Physical activity and the mechanisms of appetite control ... 183
8.2 Towards understanding the role of physical activity in homeostatic and non-homeostatic appetite control ... 187
8.2.1 Is the impact of physical activity on appetite control moderated by adiposity? ... 188
8.2.2 A new perspective of the zones of appetite control ... 189
8.2.3 Interaction between physical activity level, appetite control and diet composition: impact on energy balance ... 191
8.3 Methodological considerations ... 192
8.4 Overall implications for appetite control across the levels of physical activity ... 196 8.5 Further research ... 197 8.6 Conclusions ... 198 References ... 200 Appendix A ... 218 Appendix B ... 234 Appendix C ... 235
List of tables
Table 2-1 Keywords included in database search strategy ... 18
Table 2-2 Cross-sectional studies assessing appetite control in physically active and inactive individuals ... 21
Table 2-3 Studies investigating the effect of exercise training on appetite control in previously inactive individuals ... 36
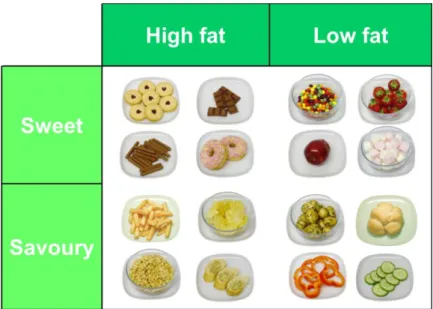
Table 3-1 Nutritional characteristics of the high-fat and low-fat food images used in the LFPQ ... 59
Table 4-1 Ingredients and macronutrient composition of the HCHO and HFAT rice and yoghurt recipes ... 72
Table 4-2 Participant characteristics of LoPA and HiPA groups ... 75
Table 4-3 Eating behaviour traits ... 76
Table 4-4 Habitual physical activity from the SenseWear armband ... 76
Table 4-5 Passive overconsumption in LoPA and HiPA ... 78
Table 4-6 Palatability ratings of the HFAT and HCHO rice and yoghurt ... 84
Table 4-7 Liking and wanting pre- and post-lunch, and change from pre- to post-lunch ... 85
Table 4-8 Redistribution of self-reported IPAQ classification (LoPA and HiPA) into tertiles of objectively-based MVPA from the SWA (LoMVPA, ModMVPA, HiMVPA). ... 92
Table 4-9 Group characteristics of lower and upper tertiles of measured physical activity ... 93
Table 4-10 Energy intake at HFAT and HCHO ad libitum meals in groups of LoMVPA and HiMVPA ... 94
Table 4-11 Passive overconsumption between high and low tertiles of MVPA ... 95
Table 5-1 Ingredients and macronutrient composition of the two porridge preloads ... 102
Table 5-2 MVPA group characteristics ... 107
Table 5-3 Habitual physical activity from the SenseWear Armband ... 108
Table 5-4 Energy intake in the control NEP condition across groups of MVPA ... 109
Table 5-5 Absolute and relative energy intake at dinner, snack box and over 24h ... 111
Table 5-6 Satiety quotient post-breakfast to 3 h ... 115
Table 5-7 Absolute liking and wanting pre- and post-preload consumption in the NEP condition ... 117
Table 5-8 Absolute liking and wanting pre- and post-consumption of preloads differing in energy content ... 117 Table 6-1 Meal characteristics ... 131 Table 6-2 Descriptive statistics of study sample ... 133 Table 6-3 Correlations between components of habitual physical activity and
body composition ... 135 Table 6-4 Associations between components of physical activity and meal
size ... 136 Table 6-5 Associations among body composition, energy expenditure and
meal size ... 137 Table 6-6 Regression coefficients showing the effect of total daily energy
expenditure and energy density on meal size using stepwise multiple regression ... 137 Table 6-7 Associations between components of body composition, energy
expenditure, physical activity, eating behaviour traits and food reward ... 139 Table 6-8 Associations between body composition, energy expenditure,
physical activity, meal size and fasting appetite-related peptides ... 140 Table 6-9 Characteristics of MVPA groups ... 141 Table 7-1 Food items and macronutrient composition of the ad libitum HFAT
and HCHO breakfast at baseline ... 152 Table 7-2 Food items and macronutrient composition of the fixed energy
HFAT and HCHO lunches ... 153 Table 7-3 Food items and macronutrient composition of the ad libitum HFAT
and HCHO dinner meals ... 154 Table 7-4 Food items and macronutrient composition of the ad libitum HFAT
and HCHO snack boxes ... 155 Table 7-5 Participant characteristics at baseline and post-intervention ... 158 Table 7-6 Parameters of passive overconsumption at dinner at baseline (week
0) and post-intervention (week 13) ... 160 Table 7-7 Total daily energy intake in HCHO and HFAT at baseline (week 0)
and post-intervention (week 13)... 161 Table 7-8 Correlations between body composition and physiological
measures and HFAT and HCHO energy intake at baseline ... 168 Table 7-9 Correlations between liking and wanting for high-fat foods and
HFAT and HCHO energy intake at baseline ... 169 Table 7-10 Correlations between exercise-induced changes in homeostatic
measures and the change in HFAT and HCHO intake from baseline to post-intervention ... 170 Table 7-11 Correlations between exercise-induced changes in liking and
wanting for high-fat foods in the hungry and fed states and the change in HFAT and HCHO energy intake from baseline to post-intervention .. 170
Table 8-1 Overview of thesis aims and main outcomes ... 185
Table A-1 Cross-sectional studies assessing appetite control in physically active and inactive individuals ... 221 Table A-2 Studies investigating the effect of exercise training on appetite
control in previously inactive individuals ... 228 Table C-1 Participant characteristics before and after the 12-week intervention
List of figures
Figure 1-1 Components of total daily energy expenditure. ...3
Figure 1-2 The Satiety Cascade highlighting the cross-talk between the hedonic and homeostatic appetite control systems. ...5
Figure 1-3 Relationship between occupational physical activity level and energy intake . ... 11
Figure 1-4 Model of the impact of exercise on the mechanisms of appetite control. ... 13
Figure 2-1 Systematic review flow diagram ... 20
Figure 2-2 Standardised energy intake by physical activity level from the 10 cross-sectional studies reporting energy intake (n=25 data points). ... 35
Figure 3-1 Schematic of the Leeds multi-level experimental platform assessing appetite control ... 55
Figure 3-2 SenseWear Armband ... 56
Figure 3-3 Sensors of the SenseWear Armband ... 57
Figure 3-4 Food array used in the LFPQ ... 58
Figure 3-5 Representation of the implicit wanting and food choice trials in the LFPQ ... 60
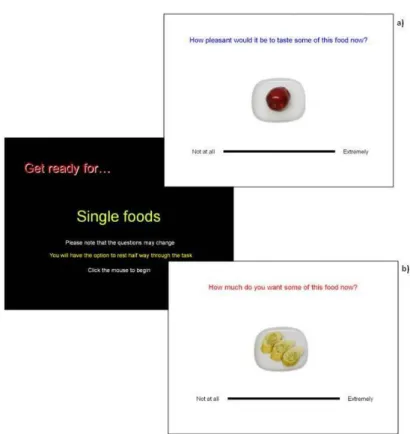
Figure 3-6 Representation of the explicit liking (a) and explicit wanting (b) trials ... 61
Figure 3-7 Electronic Appetite Rating System to assess subjective appetite sensations ... 62
Figure 4-1 Experimental protocol. ... 69
Figure 4-2 Ad libitum breakfast ... 70
Figure 4-3 Self-determined fixed breakfast ... 70
Figure 4-4 High-fat and high-carbohydrate lunch meals... 71
Figure 4-5 Meal size at ad libitum HFAT and HCHO meals. ... 77
Figure 4-6 Energy intake at ad libitum HFAT and HCHO meals... 78
Figure 4-7 Hourly and post-meal ratings of hunger , fullness , desire to eat and prospective food consumption throughout the HFAT and HCHO meal days. ... 81
Figure 4-8 Area under the curve for ratings hunger , fullness , desire to eat and prospective food consumption throughout the HFAT and HCHO meal days. ... 82
Figure 4-9 Satiety quotient following breakfast as a marker of post-meal satiety. ... 83
Figure 4-10 Satiety quotient at HFAT and HCHO meal as a marker of within meal satiation. ... 83
Figure 4-11 Objectively-measured daily minutes of moderate-to-vigorous physical activity by the SWA in individuals classified according to the
IPAQ into low (LoPA) and high (HiPA) levels of physical activity. ... 91
Figure 4-12 Meal size at HFAT and HCHO ad libitum meals LoMVPA and HiMVPA groups. ... 94
Figure 5-1 Experimental protocol. ... 100
Figure 5-2 Fixed-energy breakfast ... 101
Figure 5-3 High-energy , low-energy , and no-energy control preloads ... 102
Figure 5-4 Ad libitum lunch meal ... 103
Figure 5-5 Ad libitum dinner meal ... 104
Figure 5-6 Ad libitum snack box food items ... 104
Figure 5-7 Compensation index scale ... 105
Figure 5-8 Energy intake at lunch after the HEP and LEP relative to control. ... 110
Figure 5-9 Daily profiles of hunger , fullness , desire to eat and prospective food consumption in NEP (water preload). ... 113
Figure 5-10 Hunger , fullness , desire to eat and prospective food consumption area under the curve following HEP and LEP consumption ... 116
Figure 5-11 Liking and wanting relative to NEP pre- and post-preload consumption. ... 119
Figure 5-12 Components of daily energy intake in the NEP condition and habitual energy expenditure. ... 120
Figure 6-1 Individual profile of the components of daily energy expenditure including resting metabolic rate , physical activity energy expenditure , thermic effect of food . ... 134
Figure 6-2 Scatter plot and standardized beta coefficient illustrating the relationship between total daily energy expenditure and meal size. .... 138
Figure 6-3 Relationship between body composition and meal size within groups of moderate-to-vigorous physical activity. ... 142
Figure 7-1 Experimental protocol. ... 150
Figure 7-2 Ad libitum energy intake (meal size) at dinner in the HFAT and HCHO conditions at baseline and post-intervention ... 159
Figure 7-3 Ad libitum energy intake at evening snack box in the HFAT and HCHO conditions at baseline and post-intervention ... 160
Figure 7-4 Hunger ratings and AUC in HFAT and HCHO conditions at baseline and post-intervention ... 162
Figure 7-5 SQ post-breakfast in HFAT and HCHO conditions at baseline and post-intervention ... 163
Figure 7-6 SQ lunch in HFAT and HCHO conditions at baseline and post-intervention ... 164
Figure 7-7 Liking pre- and post-lunch in the HFAT and HCHO condition at baseline (week 0) and post-intervention (week 13). ... 165 Figure 7-8 Wanting pre- and post-lunch in the HFAT and HCHO condition at
baseline (week 0) and post-intervention (week 13). ... 165 Figure 7-9 Post-lunch SQ in the HFAT and HCHO conditions at baseline and
post-intervention by sex-specific median split of change in percentage body fat. ... 167 Figure 8-1 An updated perspective of appetite control along the spectrum of
physical activity level ... 191
Figure A-1 Standardised body fat percentage by physical activity level from the 11 cross-sectional studies reporting body fat ... 226 Figure A-2 Standardised energy intake by physical activity level from the 14
cross-sectional studies reporting energy intake ... 227 Figure B-1 Scatter plots illustrating the relationship between meal size and
physical activity energy expenditure (A) and resting metabolic rate (B). ... 234
List of abbreviations
AG – Acylated ghrelinAUC – Area under the curve BES – Binge Eating Scale BMI – Body mass index CCK – Cholecystokinin
CoEQ – Control of Eating Questionnaire COMPX – Compensation index
FFQ – Food frequency questionnaire GLP-1 – Glucagon-like peptide-1 HE – High-energy
HEP – High-energy preload HCHO – High-carbohydrate HFAT – High-fat
HiPA – High physical activity level
HiMVPA – High level of moderate-to-vigorous physical activity HOMA – Homeostasis model of risk assessment
HR – Heart rate LE – Low-energy
LEP – Low-energy preload
LFPQ – Leeds Food Preference Questionnaire LoPA – Low physical activity level
LoMVPA – Low level of moderate-to-vigorous physical activity MET – Metabolic equivalent of a task
ModMVPA – Moderate level of moderate-to-vigorous physical activity MVPA – Moderate-to-vigorous physical activity
NEAT – Non-exercise activity NEP – No energy preload
NR – Not reported
PAEE – Physical activity energy expenditure PFC – Prospective food consumption
PO – Passive overconsumption PP – Pancreatic polypeptide PYY – Peptide tyrosine tyrosine RMR – Resting metabolic rate RER – Respiratory exchange ratio SED – Sedentary behaviour SQ – Satiety quotient
SWA – SenseWear Armband TEF – Thermic effect of food
TDEE – Total daily energy expenditure TFEQ – Three Factor Eating Questionnaire TG – Total ghrelin
VAS – Visual analogue scale
VO2max – Maximal aerobic capacity/cardiorespiratory fitness
– General introduction and background
The importance of physical activity in reducing morbidity and all-cause mortality (Blair, Cheng, & Holder, 2001; Booth, Roberts, Thyfault, Ruegsegger, & Toedebusch, 2017) and in weight management (Donnelly et al., 2009; Shaw, Gennat, O'Rourke, & Del Mar, 2006) has become increasingly evident. Despite the advances and efforts to help individuals become more active (e.g. fitness trackers, treadmill desks, active video games), most people still do not meet the recommendations of 150 minutes of moderate-to-vigorous physical activity per week established by the World Health Organisation (WHO; World Health Organization, 2017). Accelerometry data from four European countries reveal that less than 30% of adults achieve the WHO physical activity guidelines (Loyen et al., 2017). Physical inactivity is an important contributor to weight gain and obesity, despite claims suggesting that an unhealthy diet is mainly to blame (Malhotra, Noakes, & Phinney, 2015). However, the contribution of diet to obesity cannot be ignored. The current obesogenic food environment encourages intake of large portions and processed foods high in sugar, fat and energy density, which promote food consumption in excess of energy requirements (Swinburn et al., 2011). While obesity can be attributed to several factors other than physical inactivity and a nutrient-poor and energy-dense diet (UK Goverment's Foresight Programme, 2007), these are two key modifiable risk factors impacting on energy balance.
1.1
Defining energy balance and appetite control
Energy balance and resulting effects on body weight are the product of a complex relationship between energy intake and energy expenditure. Energy intake is modulated by the appetite control system through food consumption and eating behaviour. Energy intake is largely influenced by a combination of internal biological factors such as resting metabolic rate (RMR; Caudwell, Finlayson, et al., 2013) and appetite-related peptides (Huda, Wilding, & Pinkney, 2006; Murphy & Bloom, 2004), as well as external nutritional factors such as the energy density of the food consumed (Stubbs, Harden, Murgatroyd, & Prentice, 1995), with intake being greater at higher levels of RMR and energy density. Of the dietary macronutrients, fat has the strongest influence on energy density (9 kcal/g) compared to carbohydrate and protein (~4 kcal/g). Because of its higher energy density, fat has been shown to be less satiating per unit of energy than the other macronutrients, resulting in greater energy intake when consumed ad libitum, which has led to the term “passive overconsumption” (Blundell & MacDiarmid, 1997). Passive overconsumption can be defined as the
unintentional increase in energy intake arising from a failure to appropriately adjust intake in response to energy density (Blundell & MacDiarmid, 1997).
Appetite is controlled by several processes that form a psychobiological system that signals hunger (drives feeding), satiation (terminates feeding) and satiety (post-meal suppression of hunger), which in turn determine food and energy intake (Blundell, 1991; Blundell, Rogers, & Hill, 1987). These processes are influenced by episodic and tonic signals. Episodic signals occur on a meal-to-meal basis and diurnal variations in these signals reflect the size, pattern and frequency of meals and eating episodes. Episodic signals are primarily inhibitory (although they can be excitatory) and are related to meal initiation, termination and satiety. Tonic signals stem from body tissues and cellular metabolism, and convey information relating to energy availability and energy needs to the central nervous system (Morton, Cummings, Baskin, Barsh, & Schwartz, 2006). These homeostatic mechanisms interact with non-homeostatic processes, such as food hedonics, in the overall expression of appetite (Blundell & Finlayson, 2004). The complex relationships between homeostatic and non-homeostatic inputs, coupled with the current obesogenic food environment, can make individuals vulnerable to overconsumption and weight gain.
On the other side of the energy balance equation is total daily energy
expenditure (TDEE), which is composed of RMR, followed by physical activity energy expenditure (PAEE) and thermic effect of food (TEF; Hall et al., 2012). Physical activity encompasses structured exercise in addition to occupational, household,
transportation and other activities of daily living, termed non-exercise activity
thermogenesis (NEAT; Caspersen, Powell, & Christenson, 1985). These components are illustrated in Figure 1-1. The proportion of each can vary widely between and within individuals depending on levels of physical activity and daily exercise regime. Additionally, it is important to distinguish between sedentary behaviour and physical inactivity. Sedentary behaviour can be defined as “any waking behaviour characterized by an energy expenditure ≤1.5 metabolic equivalents (METs), while in a sitting,
reclining or lying posture”, whereas physical inactivity is “an insufficient physical activity level to meet present physical activity recommendations” (Tremblay et al., 2017). This thesis focuses on habitual physical activity levels (including inactivity) rather than sedentary behaviour.
Figure 1-1 Components of total daily energy expenditure, which is composed primarily of RMR. Physical activity energy expenditure (PAEE) can be structured via exercise or non-exercise-based activities (NEAT) and the proportion can vary within and between individuals. The proportion of thermic effect of food (TEF) was generalised to ~10% TDEE. Adapted from Melanson (2017).
1.1.1 A note on physical activity, energy expenditure and body
composition
Common beliefs regarding TDEE assume that it increases with physical activity in a dose-dependent manner, whereby greater physical activity levels lead to greater TDEE (Melanson, 2017). Recently, whether TDEE increases in proportion to physical activity level has been debated, and a constrained energy expenditure model has been proposed by Pontzer et al. (2016). These authors demonstrated that at lower levels of physical activity, TDEE increases linearly with physical activity, but at a certain threshold of much higher physical activity, TDEE plateaus. Thus,
compensatory reductions in other metabolic processes or components of TDEE could occur with increasing physical activity to maintain energy expenditure within a certain narrow range (Pontzer et al., 2016). However, further evidence is required to validate this model, elucidate the mechanisms that could regulate TDEE and the specific components of TDEE affected at very high levels of physical activity.
It is also important to emphasise that within the general population, which is highly inactive and at the low end of the levels of physical activity (World Health Organization, 2017), an increase in physical activity will likely lead to an increase in TDEE and should remain a key component for weight loss and weight management (Donnelly et al., 2009; Shaw et al., 2006).
RMR TEF NEAT Exercise 0% 20% 40% 60% 80% 100% P ercent of t otal da ily en erg y ex pe nd it ure PAEE
1.2 Psychobiological system of appetite control
The control of appetite can be conceptualised as a matrix of events and interactions occurring in three levels of the psychobiological system: psychological and behavioural events; peripheral physiology and metabolic events; and neurotransmitter and
metabolic interactions in the brain (Blundell, 1991). The desynchronisation of these three levels occurs when appetite is disrupted, for example with eating disorders (and perhaps with physical inactivity). While this thesis will address some of the
mechanisms involved in the peripheral level of the system such as gut and appetite-related peptides, it will mainly focus on the processes involved in the behavioural level of the system. This level incorporates the events and behaviours that lead to, arise during, terminate and occur after food consumption, and have been termed the Satiety Cascade (Blundell et al., 1987).
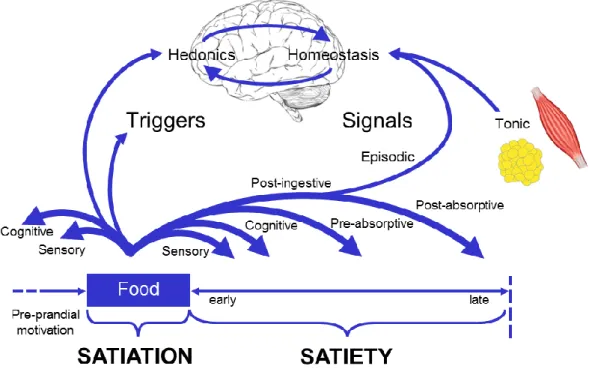
1.2.1 Satiety Cascade
As shown in Figure 1-2, hunger and hedonic sensations stimulate food intake, and prior to food consumption, the sight and smell of food generate gastrointestinal signals in anticipation of its ingestion as part of the cephalic phase of appetite. During and shortly after food consumption, negative feedback signals arise from the stomach and the small intestine to promote meal termination (satiation) and the post-meal
suppression of hunger (satiety), which, in turn, coordinate meal size and frequency (Blundell, 1991). In the pre-absorptive phase of the Satiety Cascade, sensory inputs via chemoreceptors and mechanoreceptors, and humoral responses from gut peptides inform the brain on the amount and nutrient content of the ingested food (Blundell, 1991). The post-absorptive phase is characterised by the circulating metabolic satiety signals that arise from the digestion of nutrients and either reach the brain directly or are metabolised by peripheral tissues or organs, after which by-products may
subsequently enter the brain (Blundell, 1991). As discussed below in Section 1.3, non-homeostatic (e.g. hedonic) factors also influence food intake and appetite control and should be acknowledged alongside homeostatic processes (Figure 1-2).
Figure 1-2 The Satiety Cascade highlighting the cross-talk between the hedonic and homeostatic appetite control systems. Adapted from Blundell and Finlayson (2008).
1.2.2 Gut and appetite-related peptides
On a meal-to-meal basis, following food intake and gastric emptying, the secretion of the orexigenic (appetite stimulating) peptide ghrelin is suppressed and a variety of anorectic (appetite inhibiting) peptides, such as cholecystokinin (CCK), glucagon-like peptide 1 (GLP-1), and peptide YY (PYY), among others, are released from the gut to promote the processes of satiation and satiety (Huda et al., 2006; Murphy & Bloom, 2004). In addition to episodic peptides, tonic signals such as leptin and insulin have also shown to influence appetite control and food intake (Schwartz, Woods, Porte, Seeley, & Baskin, 2000). A brief overview of the most commonly studied peptides, CCK, PYY, GLP-1, ghrelin, leptin and insulin, is provided here.
1.2.2.1 CCK
CCK is released from the small intestine shortly following food consumption and is involved in the process of satiation to reduce meal size and duration, and possibly in the early phases of satiety (de Graaf, Blom, Smeets, Stafleu, & Hendriks, 2004). The secretion of CCK increases in proportion to the dietary fat content of a meal (Feltrin et al., 2007; Pilichiewicz et al., 2006). However, it has been proposed that chronic high-fat intake attenuates the satiating properties of CCK, perhaps through a reduction in
the responsiveness of the vagal receptors, leading to greater food intake (Covasa, Grahn, & Ritter, 2000; French, Murray, Rumsey, Fadzlin, & Read, 1995).
1.2.2.2 PYY and GLP-1
PYY are GLP-1 are secreted from the same intestinal L-cells after food intake and have been proposed to be involved in satiety signalling to supress appetite following meal termination (de Graaf et al., 2004). PYY circulates mostly as its shortened form PYY3-36 and infusions of PYY3-36 decrease food intake in humans (Karra & Batterham,
2010). Concentrations of PYY increase in proportion to the energy content of a meal and are reduced during fasting (Batterham et al., 2006). As one of the incretin hormones, GLP-1 stimulates the release of insulin, but it has been proposed that insulin resistance with obesity may hamper the postprandial secretion of GLP-1 (Cummings & Overduin, 2007; Verdich et al., 2001). Fat intake has been shown to increase the release of PYY to a greater extent than carbohydrate (Feltrin et al., 2007; Pilichiewicz et al., 2006), and to a prolonged release of GLP-1 (Elliott et al., 1993). However, it appears the PYY response to dietary fat is attenuated in individuals with obesity compared to those with a healthy weight (Batterham et al., 2006).
1.2.2.3 Ghrelin
Ghrelin is mainly secreted from the stomach and exists in two forms: acylated and deacylated ghrelin (Kojima et al., 1999). It has been suggested that only the acylated form, which only accounts for 10-20% of circulating concentrations, can cross the blood-brain barrier and exert an effect on appetite (Kojima & Kangawa, 2005). Plasma concentrations increase before meals and decrease following food consumption, suggesting a role in stimulating hunger and eating behaviour, unlike other appetite-related peptides that provide negative feedback signals to promote satiety (Karra & Batterham, 2010). Ghrelin administration has been shown to increase hunger and food intake in humans (Wren et al., 2001). In addition to its episodic role, ghrelin may also be linked to tonic appetite control as a compensatory hormone to restore body weight status; with obesity, ghrelin concentrations appear to be lower, whereas with weight loss, they increase (Karra & Batterham, 2010).
1.2.2.4 Insulin and leptin
Considered as negative feedback signals released in proportion to body fat, leptin and insulin have been hypothesised to act directly in the central nervous system to reduce appetite and energy intake (Schwartz et al., 2000). Insulin, secreted from the
pancreas, was the first hormone considered as an adiposity signal impacting on the control of appetite to supress hunger and food intake (Woods, Lotter, McKay, & Porte, 1979). This was followed by leptin, secreted from the adipocytes, whose discovery provided a direct link between the energy stores within adipose tissue and central appetite mechanisms (Campfield, Smith, Guisez, Devos, & Burn, 1995; Zhang et al., 1994). Very low circulating concentrations of leptin (or leptin deficiency) have been associated with marked hyperphagia and obesity (Farooqi & O'Rahilly, 2009), highlighting its role in inhibiting the drive to eat. Despite circulating concentrations of both leptin and insulin being strongly positively associated with the degree of adiposity (Bagdade, Bierman, & Porte, 1967; Considine et al., 1996), at higher levels of body fat as in the obese state, there appears to be a resistance to the direct action of leptin and insulin in the hypothalamus (Morton et al., 2006; Schwartz et al., 2000). This provides a rationale as to why individuals with obesity continue to eat and feel hungry despite having excessive amounts of body fat stores. Moreover, it is believed that an
interaction between episodic and tonic peptides exists, with a reduced sensitivity to leptin or insulin leading to blunted signalling of satiety peptides such as CCK and GLP-1 (Cummings & Overduin, 2007; Flint et al., 2007; Morton et al., 2006). Indeed, the postprandial response of insulin has been associated with satiety in lean individuals, but less so in individuals with obesity (Flint et al., 2007; Flint et al., 2006; Holt, Brand Miller, & Petocz, 1996; Speechly & Buffenstein, 2000; Verdich et al., 2001).
1.3
Non-homeostatic factors involved in appetite control
In addition to the homeostatic mechanisms, non-homeostatic factors involved in appetite control include food hedonics (food palatability and reward) and eating behaviour traits (Berthoud, 2006; Mela, 2006). These traits characterise certain eating behaviours such as dietary restraint, disinhibition, (Stunkard & Messick, 1985), binge eating (Gormally, Black, Daston, & Rardin, 1982) and control over food cravings (Hill, Weaver, & Blundell, 1991), considered as risk factors in the susceptibility foroverconsumption and weight gain (Blundell et al., 2005).
Hedonic thoughts about food and the sensory appreciation of certain food attributes like salt, sugar and fat determine food preference and choice, and thereby contribute to meal size and frequency (Dalton & Finlayson, 2013). Food hedonics reflect the separate processes of ‘liking’ and ‘wanting’ (Berridge & Robinson, 2003).
Liking can be defined as the degree of sensory pleasure obtained from foods, whereas wanting is the motivation or attraction towards certain foods (Finlayson & Dalton, 2012). While both processes are involved in the motivation to eat, they operate as distinct entities where an increase in wanting may not necessarily predict an increase in liking and vice versa (Finlayson, King, & Blundell, 2007). Liking and wanting can be expressed explicitly through hedonic feelings towards a specific food (e.g. I like this) and the intent or desire to eat a specific food (e.g. I want this), respectively. Wanting can also be expressed implicitly without conscious awareness (e.g. being drawn to one food over another without knowing why). Wanting may be more important for overconsumption and maintenance of obesity than liking, which tends to remain stable within an individual and does not appear to be influenced by obesity (Cox, Perry, Moore, Vallis, & Mela, 1999; Dalton & Finlayson, 2013; Mela, 2006).
In today's obesogenic environment, the availability of highly palatable and often energy-dense foods raises the importance of hedonic influences on the control of food intake that occur independently from and/or in opposition to the energy need or weight status of an individual (Dalton, Finlayson, Esdaile, & King, 2013). Indeed, there is growing evidence to support the considerable functional overlap between the
homeostatic and hedonic mechanisms of appetite control (Berthoud, 2004; Blundell & Finlayson, 2004), which could be linked by GLP-1 (Blundell et al., 2017), ghrelin (Erlanson-Albertsson, 2010; Goldstone et al., 2014), insulin and/or leptin (Morton et al., 2006). Consequently, hedonic signals occurring when palatable and energy-dense foods are ingested can disrupt or override homeostatic satiety signals and lead to overconsumption (Erlanson-Albertsson, 2005). This may be mediated by an accumulation of body fat which has been proposed to weaken satiety signalling (Cummings & Overduin, 2007; Flint et al., 2007; Morton et al., 2006), perpetuating overeating in individuals with excess body fat and obesity. However, it is important to note that palatability of food per se may not lead to overconsumption but it is rather the high energy density associated with palatable foods rich in fat and sugar that is driving the increase in energy intake (Mela, 2006). For example, consumption of highly
palatable artificially sweetened low-calorie foods may not lead to overconsumption over energy requirements.
1.4
The influence of body composition and energy
expenditure on energy intake
While there is evidence for the negative feedback mechanisms involved in satiation and satiety based on the interaction between tonic adiposity and episodic gut signals, less is known on the factors that drive hunger and food intake. Whether energy
expenditure and physical activity are drivers of energy intake is not well understood (Blundell, Goodson, & Halford, 2001). The relationship between energy expenditure and energy intake in humans was examined over 60 years ago (Edholm et al., 1970; Edholm, Fletcher, Widdowson, & McCance, 1955; Mayer, Roy, & Mitra, 1956). Mayer et al. (1956) demonstrated a relationship between occupational physical activity and daily energy intake in Bengali jute mill workers whose daily occupations ranged from “sedentary” to “very heavy work” whereby those performing “very heavy work” consumed more than those performing “light work” (Mayer et al., 1956). In line with Mayer, Edholm et al. (1970) found a strong relationship between TDEE and daily energy intake in army cadets over three weeks. Despite providing initial evidence for physiological processes and behavioural activities impacting on appetite and providing a demand for food intake, this concept was left dormant for several decades.
The roles of body composition and energy expenditure in driving food intake have recently been re-examined (Blundell, Finlayson, Gibbons, Caudwell, & Hopkins, 2015; Dulloo, Jacquet, Miles-Chan, & Schutz, 2017). Fat-free mass has been found to be strongly and positively associated with energy intake in lean and overweight/obese individuals (Blundell et al., 2012a; Weise, Hohenadel, Krakoff, & Votruba, 2014), corroborating findings from earlier but less known studies (Cugini et al., 1998; Lissner et al., 1989). In contrast, the relationship between fat mass and energy intake was found to be negatively associated with hunger and energy intake in lean but less so in overweight and obese individuals (Blundell et al., 2012a; Cugini et al., 1999; Cugini et al., 1998; Lissner et al., 1989). This supports the proposition that adiposity signals inhibiting food intake are blunted with higher levels of body fat (Morton et al., 2006; Schwartz et al., 2000). In addition to fat-free mass, RMR has also been shown to predict energy intake (Caudwell, Finlayson, et al., 2013; McNeil et al., 2017), which led to the suggestion that RMR (largely determined by fat-free mass) exerts a tonic day-to-day signal for hunger and the drive to eat (Blundell et al., 2012b). It has recently been shown that the associations between fat-free mass and energy intake are mediated by RMR (Hopkins, Finlayson, et al., 2016) and TDEE (Piaggi, Thearle, Krakoff, &
Votruba, 2015), suggesting that the associations between fat-free mass and energy intake reflect the energetic demands created by metabolically active tissue.
1.5 Energy intake and appetite control along the spectrum of
physical activity
The contribution of physical activity (behaviour) per se towards the drive to eat is less apparent and remains to be elucidated. In comparison to RMR, physical activity makes up a smaller proportion of TDEE and is more variable; therefore, its impact on energy
intake may be smaller and harder to quantify. Prior reports did not find significant associations between physical activity and energy intake (Blundell & King, 1998) in addition to others showing that seven days of imposed inactivity did not lead to a reduction of energy intake (Stubbs, Hughes, Johnstone, Whybrow, et al., 2004). More recently, a systematic review (Donnelly et al., 2014) and a meta-analysis (Schubert, Desbrow, Sabapathy, & Leveritt, 2013) supported these with little evidence that physical activity or exercise, whether acute or chronic, leads to changes in energy intake. However, the acute or relatively short-term nature of these studies may not have been long enough to demonstrate a compensatory rise in energy intake with habitual physical activity (Stubbs, Sepp, Hughes, Johnstone, Horgan, et al., 2002; Stubbs, Sepp, Hughes, Johnstone, King, et al., 2002; Whybrow et al., 2008) and as originally demonstrated by Mayer et al. (1956). Indeed, a strong relationship was found between weekly objectively-measured habitual physical activity and weekly food intake (based on food diaries) in 300 middle-aged women (Tucker, 2016).
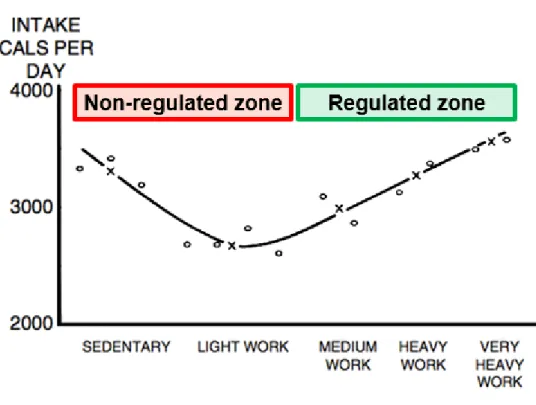
It is important to note that the study by Mayer et al. (1956) revealed a non-linear relationship between habitual physical activity level on energy intake. As shown in Figure 1-3, in the jute mill workers on the right side with higher levels of
occupational physical activity (e.g. “medium” to “very heavy” work), daily energy expenditure and energy intake were closely matched, but on the left side at low levels of occupational physical activity this coupling was lost, such that daily energy intake exceeded expenditure in those performing “sedentary” to “light” work (Mayer et al., 1956). Additionally, those in the sedentary physical activity category were also heavier than those in the light to very heavy work categories (Mayer et al., 1956).
Based on the study by Mayer et al. (1956), it was proposed that appetite control is enhanced with increasing levels of physical activity (Blundell, 2011). In contrast, physical inactivity could not only reduce TDEE but also lead to appetite dysregulation, overconsumption and eventually weight gain (Blundell, 2011). Indeed, according to Jacobs (2006), “the late Henry L Taylor favoured a model that linked energy intake to energy expenditure in a J-shaped curve (personal communication, late 1970s). The first part of his concept was that energy intake is in exact
homeostasis with energy expenditure under conditions of high energy expenditure. The second part was that there is a failure of homeostasis in a sedentary lifestyle because of its accompanying low energy expenditure. He postulated that body signals go awry in sedentary lifestyles; when a person does no physical work, the body will not recognize that it is being overfed. Sedentary persons may lose the innate ability to compensate for inactivity by reducing their eating” (p.189). Thus, Blundell (2011) amended the Mayer curve and suggested that individuals with low levels of physical activity could be considered as being within a “non-regulated zone” of appetite control (left side of Figure 1-3), whereas those with higher levels of physical activity could be
within a “regulated zone” of appetite control (right side of Figure 1-3). However, this model of physical activity and appetite control is based on limited evidence and the factors and mechanisms contributing to this proposed overconsumption at lower levels of physical activity and more sensitive appetite control at higher levels remain to be fully elucidated.
Figure 1-3 Relationship between occupational physical activity level and energy intake divided into non-regulated zone (high levels of sedentary behaviour and low levels of physical activity) and regulated zone of appetite control (medium to very high levels of physical activity) based on the study by Mayer et al. (1956).
Adapted from Blundell (2011).
1.5.1 The impact of physical activity on the mechanisms of appetite
control
There has been increasing interest on the influence of physical activity (and exercise) on the mechanisms of appetite control as it plays an integral (and readily modifiable) part in energy balance and the regulation of body weight (Blundell, Gibbons, Caudwell, Finlayson, & Hopkins, 2015; Martins, Morgan, & Truby, 2008; Stensel, 2010;
Thackray, Deighton, King, & Stensel, 2016). Emerging studies are shedding light on the mechanisms contributing to the proposed dysregulation of appetite at lower levels of physical activity and more sensitive appetite control at higher levels of physical activity. Acutely, exercise has been shown to influence gastric emptying (Horner, Schubert, Desbrow, Byrne, & King, 2015), attenuate the release of ghrelin and
King, & Stensel, 2009; Broom, Stensel, Bishop, Burns, & Miyashita, 2007; Deighton, Barry, Connon, & Stensel, 2013; Douglas et al., 2017; Schubert, Sabapathy, Leveritt, & Desbrow, 2014), and increase feeding latency i.e. the timing when food in consumed (King, Wasse, & Stensel, 2013). Chronic exercise may increase the secretion of GLP-1 and PYY (Lund et al., 20GLP-13; Martins, Kulseng, King, Holst, & Blundell, 20GLP-10). Therefore, physical activity (and exercise) may interact with food intake to enhance hormonal satiety signalling (Stensel, 2010). Moreover, regular physical activity and exercise training are associated with several other physiological adaptations such as improved sensitivity to insulin (Goodyear & Kahn, 1998) and leptin (Dyck, 2005; Steinberg et al., 2004), substrate metabolism (Richter & Ruderman, 2009) and body composition (Shaw et al., 2006; Stiegler & Cunliffe, 2006), which have been proposed as mechanisms involved in food intake and eating behaviour (Figure 1-4; Blundell, Gibbons, et al., 2015).Evidence suggests that chronic exercise influences appetite control through a dual-process action which increases fasting hunger but also post-meal satiety (King et al., 2009). Therefore, inactive individuals in the non-regulated zone of appetite could have weakened satiety signalling or dysfunction of other appetite-related processes or traits, whereas active individuals in the regulated zone could have a more sensitive appetite control system in order for energy intake to be better matched to energy expenditure (Blundell, 2011).
While there is strong support that habitual physical activity affects homeostatic mechanisms controlling food intake, less is known on its effect on non-homeostatic processes such as food hedonics and eating behaviour traits, and their contribution to appetite control across the levels of physical activity. The potential influence of
habitual physical inactivity on food hedonics and eating behaviour traits may contribute to the overconsumption seen in the non-regulated zone of appetite, but this remains unknown. In fact, few studies have focused on the differences in homeostatic and non-homeostatic appetite control between physically active and inactive individuals. These are systematically reviewed in the following chapter and addressed throughout this thesis.
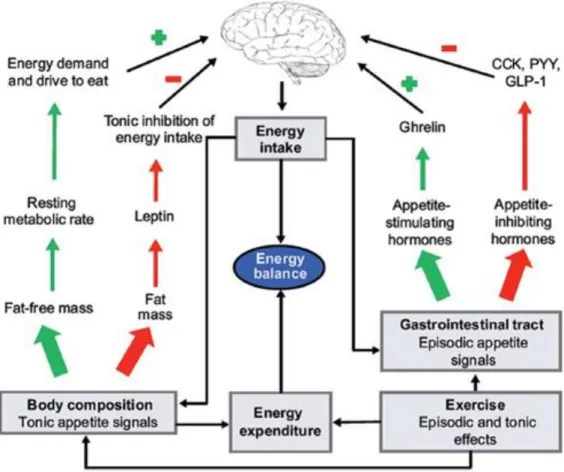
Figure 1-4 Model of the impact of exercise on the mechanisms of appetite control. Exercise increases fat-free mass, which through RMR increases the demand and drive to eat; reduces fat mass, which enhances the tonic inhibition of leptin on energy intake; and affects the release of episodic gut peptides to modulate hunger and satiety. From Blundell, Finlayson, et al. (2015).
1.5.2 Interaction between physical activity and diet composition on
energy intake and energy balance
Whilst physical activity appears to affect several mechanisms of appetite control, whether it renders individuals less susceptible to overconsumption in the current obesogenic food environment has not been extensively examined. This is important to consider, with headlines stating “You cannot outrun a bad diet” (Malhotra et al., 2015). Only a few studies have investigated the impact of physical activity and diet
composition on energy intake and energy balance. A study by Tremblay et al. (1994) in males found that consumption of a high-fat diet over two days following a 500-kcal exercise bout led to a positive energy balance, whereas consumption of a low-fat diet was able to maintain the energy deficit produced by exercise. Along those lines, Murgatroyd et al. (1999) showed in males that increasing the dietary fat content (and energy density) of an ad libitum diet in a day where exercise was imposed (~675 kcal) increased energy intake and led to a positive energy balance (albeit not statistically significant). Moreover, consumption of a high-fat diet while imposing inactivity resulted in a daily positive energy balance of approximately 1000 kcal more than with imposed exercise, and 1200 kcal more than with exercise on a low-fat diet. Other studies in males (King & Blundell, 1995) and females (King, Snell, Smith, & Blundell, 1996) corroborated these findings by demonstrating that the consumption of a high-fat meal following an exercise bout resulted in significantly greater relative energy intake (after considering the energy expenditure of the exercise) compared with a low-fat meal. Interestingly, palatability of both high-fat and low-fat meals increased after exercise compared to rest in females, but not in males (King et al., 1996). These studies highlight the potency and robustness of the phenomenon of passive overconsumption with a high-fat/energy-dense diet, regardless of the added energy expended through acute exercise. However, whether being physically active in general enhances the response to dietary manipulations is also of interest. This will be further addressed in the following chapter and throughout this thesis.
1.6
Overall thesis aims
The literature regarding the influence of habitual physical activity on the sensitivity of appetite control is limited. Whether physical activity enhances appetite control and by which mechanisms have yet to be fully resolved. This thesis aims to shed light on the impact of habitual physical activity level in non-obese individuals and exercise training in individuals with overweight and obesity on homeostatic and hedonic appetite processes; namely satiation, satiety and passive overconsumption. To achieve this, the experimental studies within this thesis employ a multi-level experimental platform that includes biological, behavioural and psychological aspects of energy balance.
1.6.1 Specific objectives
Systematically review the literature examining appetite control in active and inactive individuals, and in response to exercise training in inactive individuals (Chapter 2).
Investigate the effect of habitual physical activity level on satiation and the hedonic response to ad libitum meals varying in dietary fat content in non-obese individuals (Chapter 4).
Investigate the effect of habitual physical activity level on satiety and the hedonic response to preloads differing in energy content in non-obese individuals (Chapter 5).
Examine the associations among components of physical activity (including time spent in light, moderate and vigorous physical activity, energy expenditure and cardiorespiratory fitness), appetite control and energy intake in non-obese individuals (Chapter 6).
Investigate the homeostatic and non-homeostatic responses to a 12-week exercise training intervention and to meals varying in dietary fat content in inactive overweight and obese individuals (Chapter 7).
Examine the potential mechanisms underlying the impact of physical activity on appetite control including body composition, energy expenditure and non-homeostatic processes (all studies), and fasted appetite-related peptides (Chapters 4, 6 and 7).
Chapter 2 – Does habitual physical activity increase the
sensitivity of the appetite control system?
A systematic review
2.1
Introduction
Scientific studies have tended to examine the appetite responses to exercise rather than habitual physical activity levels per se, with few studies having specifically focused on the appetite control differences between physically active and inactive individuals. There is some evidence suggesting that habitual physical activity improves appetite control by enhancing satiety signalling (King et al., 2009; Long, Hart, &
Morgan, 2002). Two recent reviews have included secondary analyses on whether the relationship between acute or long-term exercise and energy intake is influenced by physical activity level (Donnelly et al., 2014; Schubert et al., 2013). From their meta-analysis, Schubert et al. (2013) found that absolute energy intake after acute exercise was greater in active individuals compared to those less active, whereas Donnelly et al. (2014) concluded from their systematic review that increased physical activity or exercise, regardless of physical activity level, had no consistent effect on acute or long-term energy intake. However, these reviews only included energy and
macronutrient intake as their main outcome measures. This limitation is of importance as appetite control involves the complex co-ordination of a range of homeostatic and non-homeostatic signals in the overall expression of food intake (Schwartz et al., 2000). Therefore, in addition to energy intake it is important to consider other components such as appetite-related peptides, subjective appetite sensations, food choice, and hedonic reward.
It has been proposed that the regulation of the appetite control system and energy intake is improved with increasing levels of physical activity (Blundell, 2011). This issue has yet to be systematically reviewed, and the potential mechanisms behind any improvement in appetite control are unclear. The aim of this systematic review was to examine whether physically active individuals have more sensitive control over appetite than their inactive counterparts and if this confers them the ability to better match energy intake to energy expenditure, and identify behavioural or physiological mechanisms underlying any observed differences.
2.2
Methods
This systematic review follows the Preferred Reporting Items for Systematic Reviews and Meta-Analysis (PRISMA) guidelines and is registered in the PROSPERO
database (registration number CRD42015019696).
2.2.1 Search strategy
A search was conducted in the databases Ovid Medline, Ovid Embase and
SPORTDiscus (EBSCOHost), which included articles published between 1st January
1996 and 15th April 2015 using the strategy (physical activity AND (appetite AND (food
intake OR appetite-related peptides))). Previous systematic reviews were screened to identify relevant subject headings and key words to include within each subject category. The specific key words used for the search are listed in Table 2-1 and the full search strategy for one of the databases consulted can be found in Appendix A.1. Limits were set to include articles published in English and studies conducted in human adults aged 18-64 years. Reference lists from the resulting articles were also screened to identify any additional articles. Articles published after 15th April 2015 that
Table 2-1 Keywords included in database search strategy
Physical activity Appetite Food intake Appetite-related peptides
Motor activity Appetite Energy intake Gut hormone
Exercise Feeding behavior Diet Gut peptide
Oxygen
consumption Food preferences Dietary proteins Peptide YY
Physical fitness Hunger Dietary fats PYY
Exercise tolerance Satiety Dietary
carbohydrates Ghrelin
Exercise test Satiation Calorie intake Glucagon-like
peptide-1
Physical endurance Fullness Food intake GLP-1
Physical activity Motivation to eat Meal size Pancreatic polypeptide Physical
performance Food choice
Energy
compensation PP
Aerobic Food selection Energy density Leptin
Aerobic capacity Desire to eat Macronutrient Insulin
Training Palatability Cholecystokinin
Maximal VO2 Food reward CCK
Physical capacity Hedonic Liking Wanting
2.2.2 Study selection, inclusion, and exclusion
Articles were included if they involved healthy adults participating in cross-sectional studies and examined appetite control in physically active and inactive individuals. Longitudinal studies assessing appetite control before and after an exercise-training intervention in previously inactive individuals were also included if the intervention was greater than four weeks (to allow sufficient time for adaptations from regular physical activity to emerge; e.g. (Cornelissen & Smart, 2013)) and did not include any
concurrent dietary intervention (e.g. energy restriction, supplementation). Articles were excluded if they involved animals, children, adolescents, athletes or older adults (>65 years old) and participants who smoked. Abstracts and full-texts were assessed for eligibility independently by KB and a second reviewer with uncertainty regarding eligibility discussed with a third reviewer.
2.2.3 Data extraction and synthesis
The following study information was extracted into a spreadsheet: authors, date of publication, sample size, participant characteristics (age, sex, body mass index (BMI), % body fat, maximal aerobic capacity (VO2max), physical activity details), criteria used
to assess physical activity status (cross-sectional studies) or training intervention (longitudinal studies), setting, outcome measures (energy intake, appetite ratings and appetite-related peptides), and results. To determine any statistical relationship between habitual physical activity level and energy intake, where data were available energy intake values were standardised (z-scores) and from the definitions provided in the studies, physical activity levels were graded into low (<150 min/wk, <1000 kcal/wk or physical activity level (PAL): 1.4-1.69), medium (150-419 min/wk, 1000-2499 kcal/wk or PAL: 1.7-1.99), high (420-839 min/wk or 2500-3499 kcal/wk), or very high (>840 min/wk or >3500 kcal/wk). One-way ANOVA was then used to test for a main effect of graded physical activity level on energy intake score, followed by trend analyses for linear and non-linear functions. Other outcome measures are presented as a qualitative synthesis.
2.2.4 Risk of bias
Risk of bias was assessed using the Cochrane Collaboration’s tool for assessing risk of bias for sequence generation, allocation concealment, blinding of participants, personnel and outcome assessors, incomplete outcome data, selective outcome reporting, and other sources of bias (Appendix A.2; Higgins & Green, 2008). Study inclusion was not influenced by the results of the risk of bias assessment.
2.3
Results
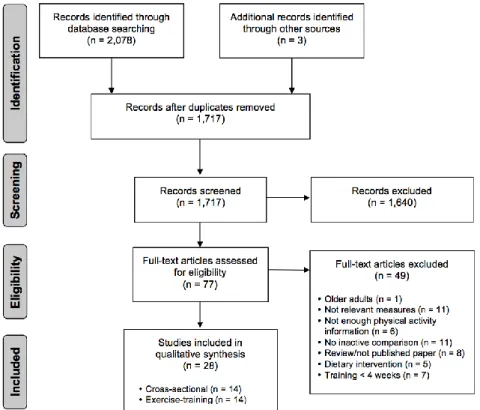
Figure 2-1 illustrates the systematic review flow diagram. The database search yielded 2,078 articles, 1,640 of which were eliminated based on titles and abstracts alone. The full text was retrieved from 77 articles and 28 satisfied the inclusion criteria. A further 13 studies were included in this thesis in Appendix A.3.
Figure 2-1 Systematic review flow diagram
2.3.1 Cross-sectional studies
- 21
-Table 2-2 Cross-sectional studies assessing appetite control in physically active and inactive individuals
Study Participants Physical activity status Setting Outcome
measures Results
Apolzan et al. (2009)
Young groups
Men and women
Active: n = 11 (63.6 % men); age = 25±3 years; BMI = 23.5±2.0 kg/m2; body fat =15.7±6.3 %; VO2max = 47.5±6.3 mL/kg/min; PA =2.6±0.7 h/d Inactive: n = 13 (61.5% men); age = 25±4 years; BMI = 26.6±3.6 kg/m2; body fat = 23.1±5.0 %; VO2max = 33.7±5.8 mL/kg/min; PA = 0.0±0.0 h/d
Paffenbarger physical activity questionnaire and VO2max
Active: MVPA ≥4d/wk, VO2max above average for age, >2500 kcal/wk
Inactive: <20min/d ≤2 d/wk, VO2max below average for age, <1000 kcal/wk
Free-living Hunger, fullness, desire to eat (vertical dashes)
Food intake (24-h food record)
No effect of activity status on appetite, energy intake or macronutrient intake.