Research Article
Jan Strohmandl* and Zdeněk Čujan
Risk Minimisation in Integrated Supply Chains
https://doi.org/10.1515/eng-2019-0082 Received Aug 20, 2019; accepted Oct 14, 2019
Abstract:Integrated supply chains, due to their complex-ity, are vulnerable in relation to various types of risks, espe-cially in the present turbulent market environment, char-acterised by increased demand for effectiveness of the in-dividual logistic activities, extended customer service and decreased cost. The supply chain risks are represented by any threatening event that may unexpectedly disrupt or restrict material flow, or directly stop the scheduled logis-tic or manufacturing activities. Supply chain risk manage-ment includes risk identification, analysis and implemen-tation of measures against potential risk consequences. This article describes supply chain management, risk elim-ination methods in the case of a technological breakdown and potential subsequent supply chain failure and appli-cation of the modified Failure Mode, Effects & Criticality Analysis (FMECA).
Keywords:method, management, risk, supply chain
1 Introduction
At present, in the period of frequent market turbulences, potential supply chain risks must be prevented, and if the prevention fails, then the consequences must be elim-inated to the maximum extent possible. Risk prevention can be achieved above all by profound analysis of poten-tial risks and preparation of a strategic plan for potenpoten-tial risk consequence minimisation already at the moment of the risk occurrence [1].
Larger organisations have specialised staff working on ongoing potential risk analyses and strategic plan updates for risk consequence minimisation. Smaller organisations and small entrepreneurs usually endow their top manage-ment, or their owner, with the responsibility for decisions in the case of potential risk occurrence.
*Corresponding Author: Jan Strohmandl:Tomas Bata University in Zlín, nám. T. G. Masaryka, 5555, Faculty of Logistics and Crisis Management, Czech Republic; Email: [email protected]
Zdeněk Čujan:Department of Bachelor study, College of Logistics, Přerov, Czech Republic; Email: [email protected]
Supply chain management is [2–4], where this area is analysed, including the relations between the individual links of the chain. There are known solutions related to production management, using above all the methods of brainstorming, cause and effect diagrams, 5 why, Pareto analysis, or FMEA method. These methods are described by many authors, see for [5–8].
In the area of plastic processing there is a unique pro-cessing technology of artificial leather made of powder PVC, described in the technological procedure of its man-ufacture in special-purpose manufacturing equipment de-veloped solely for this purpose. A similar issue is ad-dressed by [9, 10]. On the basis of this technology a risk analysis method called FMECA has been developed. Appli-cations of this method have resulted in definitions of crit-ical conditions for enterprise management and substitute solutions in case of production failure (breakdown) appli-cable even before the production breakdown actually oc-curs.
2 Methods
There are several established methods of risk identifica-tion and evaluaidentifica-tion, used variedly on different levels of assessment and identification. Each of them has been cre-ated for a specific problem and therefore they are not mutu-ally comparable. They are used for assessment of risk prob-ability and seriousness. The result is risk classification as acceptable or non-acceptable.
FMECA is an improved version of FMEA extended with a section on criticality analysis, used for mapping the probability of failure modes against consequence impact. FMECA can be illustrated as a method for identification of system failures, their causes and impact. In relation to crit-icality the FMECA process can be used for identification and focus on the integrated supplier chain in production management.
FMECA may further be useful in improvements of product and process design, which may led to improved re-liability, safety and quality, cost reduction and increased customer satisfaction. This tool would be useful for cre-ation and optimiscre-ation of replaceable system maintenance plans and other quality assurance procedures
Table 1:Risk acceptability assessment [1]
Levels of seriousness
1 2 3 4
Failure frequency Insignificant Marginal Critical Catastrophic
5 - Frequent Undesirable Unacceptable Unacceptable Unacceptable
4 – Probable Acceptable Undesirable Unacceptable Unacceptable
3 - Occasional Acceptable Undesirable Undesirable Unacceptable
2 – Very weak Negligible Acceptable Undesirable Undesirable
1 – Improbable Negligible Negligible Acceptable Acceptable
In addition both FMEA and FMECA are required to meet the requirements for quality and safety, such as ISO 9001, Six Sigma, Good Manufacturing Practice (GMP), the Act on Process Safety Management etc.
Supply chain risk prevention and continuous material and goods flow assurance, as the top priority for every sup-plier, beneficially uses the FMECA method. FMECA – ČSN EN 60812:2007 is described in the national technical stan-dards of the Czech Republic as an expression of potential failure occurrence and consequence analysis [1].
FMECA is a team-oriented method used for develop-ment, planning, manufacturing and supply process risk minimisation and requiring interdisciplinary cooperation of all supply chain stakeholders since the very beginning of their cooperation.
FMECA is a semi-quantitative method used to identify failures with significant effects for the system function. Se-riousness of failure effects is described in terms of criti-cality. There are several classes or levels of criticality re-lated to the hazards for and reduction of operability of the system, and sometimes also to probability of the risk oc-currence. When defining criticality people usually make two fundamental mistakes: First they incorrectly estimate the criticality value. This mistake is made where there are many individual criticality levels. And second they overly round up the input error and thus also the output error. This mistake is made if there are few criticality levels. Lim-iting the size of one error increases the effect of the other.
2.1 System Elements and System Structure
of Modified FMECA
The system includes system elements used for hardware concept description and classification and arranged in a system structure forming a hierarchy of the system ele-ments [11].
Risk potential analysis is performed for each moni-tored element described within the system with
specifica-tion of its potential consequence and significance quantifi-cation on a 10-point scale.
If the risk acceptability level is generally specified all identified risks can be divided in two groups:
– Acceptable risks – Unacceptable risks
Each business forming part of the supply chain has a problem to define the risk acceptability threshold, unique and unrepeatable for every business. Specification of this threshold is subjective and influenced by multiple factors. The risk calculation is based on mathematical expres-sion of risk as a function of multiple variables [1]:
R=f(p1,p2,. . .,pn) (1)
Variables in the equation: p1– risk probability p2– effect size
p3– detection probability
2.2 Procedure of FMECA Method Application
2.2.1 Implementation Team Formation
The team should include people on various organisational levels who know the process, possess the needed experi-ence, ideally from multiple fields, and are communicative. An “ideal” team should consist of 5-7 members but there are also teams of around 15 assessors. The most impor-tant thing is to engage imagination and courage to express one´s own ideas and opinions. The team should ideally in-clude one knowledgeable moderator. An external party is used as an exception, for the method is relatively simple.
2.2.2 Specification of All Potential or Probable Defects of the Proposal
This is where experience of the individual team members with similar previous proposals, knowledge of the issue, technological options available etc. – team work – are utilised.
2.2.3 Priority Definition
With regard to consequences,i.e.the level of impact on the customer, and cause of occurrence,i.e.the scope of occur-rence in use, and finally with regard to the scope of the necessary controls,i.e.the probability of the risk detection, the risks are categorised as follows.
2.2.4 Risk Categorisation
Scoring by priority
2.2.5 Evaluation
Risk evaluation is based on characteristic numbers. The risk number specifies the priority of dealing with the prob-lem.
2.2.6 Proposal of Adequate Measures
Clearly the higher the risk number, the more effort should be exercised to deal with the risk,i.e.to plan and deploy re-medial measures. But there are also cases of low risk num-bers that need reasonably early addressing for one reason or another.
2.2.7 Measure Implementation
New Status Assessment–i.e.repetition of the whole pro-cess
The resulting calculated RPN indicator focuses prior-ity on elimination of the failure causes in the supply chain links [12].
3 Results
Generally, transport is the top risk link of the supply chain. Organisations transporting goods face many risks. Some of them are hardly predictable and therefore timely and good preparation for them is difficult. These include natural phenomena occurring independently of human will (earthquake, flood, flash of lightning, gale, avalanche etc.). Another risk category includes anthropological risks (traffic accidents, train derailing, airplane crashes, ship wrecking etc.), unprofessional load handling and many more [13].
Risk may occur in any supply chain link. Natural dis-asters, warehouse fires or factory explosions are not the highest risks. Much more real threats are represented by supplier failure, manufacture interruption, logistic diffi-culties, IT faults, or growing oil and energy prices with the related risk of cost increase. For example storage brings about risks represented by natural disasters such as flood, fire, gale, snowfall, hailstorm, and further the risks of theft, vandalism etc. The presently used modern technologies allow for goods monitoring at nearly every stage of their transport. This technology significantly contributes to pre-vention of goods theft during transport.
A newly emerging risk factor, in addition to terrorist attacks, is cyber terrorism, represented by both external intruders and data abuse within the organisation. Occur-rence of random events may cause damage or loss of the transported goods. Also the means of transport can be damaged.
Effective prevention and utilisation of current data and statistical analysis methods is the most effective method of supply chain risk minimisation. There are analy-ses helping prevent some emergencies in the area of man-ufacturing equipment. The first step of risk management is identification of key products, processes and localities forming parts of the supply chain. The identification is needed as part of raw material supply tenders as well as of end product or part delivery including all possible events that might affect their production and supply. The next step is risk management strategy establishment for all stages and potential weak points of the process. Risk man-agement should not be set within the company only but across the whole supply chain in cooperation with both the suppliers and the customers.
Integration of the individual logistic links into integral supply chains definitely brings about several advantages in the area of risk reduction. Sharing of information, for ex-ample about material, finished product and goods stock or about the status of customer order coverage, dramatically
reduces uncertainty of decision-making, stock shortage on the individual levels and obviously also related costs.
Supply chain integration in itself however introduces one significant risk factor, and that is mutual dependence of individual links of the supply chain. As all links are in-terconnected, the risk manifested in one of them is trans-ferred onto the other links and affects the whole supply chain and its ability to function faultlessly. It is therefore recommended to realize certain relations and respond to them properly when setting the relations between chain links within the supply chain [13, 14]:
– Risk within supply chain usually begins on the level of the key link from where it spreads further. The key link managers should formulate a risk management policy, create a system of risk management, or ap-point a risk control team and share their experience with the other links within the supply chain. – The more the company applies the lean manufacture
principles and the more quickly it is able to adapt to customer requirements, the higher is the proba-bility of risk occurrence - but the truth is that on the current knowledge level there is no other, more ap-propriate way to be competitive in the present turbu-lent market environment and elimination of the lean manufacture principles and quick adaptation to cus-tomer needs would certainly be a step backward. – The chain is only as strong and reliable as is its
weak-est link. That is why the weakweak-est link needs to be strictly identified and work on potential risk areas with possible impact on the whole chain must be done.
– Appropriate prevention is always better (and usually also cheaper in terms of costs) than consequence ad-dressing.
– It is necessary to be prepared for potential risk events – for example in terms of substitute capaci-ties, finished product stock, financial reserves, and work on effective alternatives of the current enter-prise functioning in the crisis mode.
– No manager is (likely to be) able to identify 100% of potential risks and be fully prepared for each of them when it occurs. It is therefore good to antici-pate, monitor the current situation and flexibly re-spond to stimuli.
Mutual dependence of individual chain links inside in-tegrated supply chains is not the only problem, though. Certain specific risks occurring within a supplier chain hide the potential of significant negative impact on an-other supply chain or group of chains and this is often hard to predict.
What needs to be emphasized in this context is that an identical risk may generate different progress scenar-ios and even the best crisis scenario is unable to describe all options in sufficient detail. In addition, when the risk event actually occurs, it would be very difficult to read-ily find the correct instruction applicable to the particular event out of the many available and implement it within a short time span. That is why when a risk event occurs (i.e. when prevention fails or effective risk prevention was not possible) the crisis management plan must be supported with the skills of the managers able to quickly react to the current condition thanks to their managerial experience, creative approach and also intuition, for that is the only way to manage the broad spectrum of different factors en-tering the decision-making processes concerning appro-priate response for minimisation of damage caused by the particular risk.
3.1 Manufacturing Technology Related
Risks
A good example may be manufacturing technology for pro-duction of artificial leather of PVC powder on a single-purpose machine of foreign origin, producing interior equipment for automotive industry of powder PVC.
Figure 1:A section of the top part of dashboard made of PVC powder. Source: In-house
The working part of the machine includes a horizon-tally laid roller with a dividing plane along its axis permit-ting the roller opening and placing a mould with a cav-ity the surface of which is the negative of the future inte-rior part including the design surface. The required der colour is selected and the needed quantity of the pow-der PVC is measured and put inside the mould cavity and the roller is closed. At the same time the inside space of the roller is filled with gas by a hollow shaft ended with a
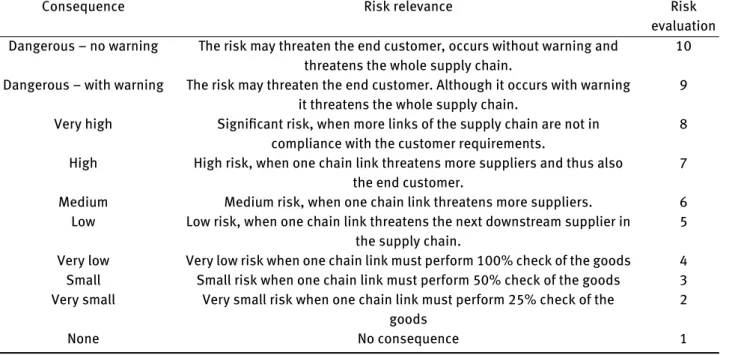
Table 2:Modified risk relevant assessment table (Source: In-house)
Consequence Risk relevance Risk
evaluation Dangerous – no warning The risk may threaten the end customer, occurs without warning and
threatens the whole supply chain.
10 Dangerous – with warning The risk may threaten the end customer. Although it occurs with warning
it threatens the whole supply chain.
9 Very high Significant risk, when more links of the supply chain are not in
compliance with the customer requirements.
8 High High risk, when one chain link threatens more suppliers and thus also
the end customer.
7
Medium Medium risk, when one chain link threatens more suppliers. 6
Low Low risk, when one chain link threatens the next downstream supplier in the supply chain.
5
Very low Very low risk when one chain link must perform 100% check of the goods 4
Small Small risk when one chain link must perform 50% check of the goods 3
Very small Very small risk when one chain link must perform 25% check of the goods
2
None No consequence 1
gas burner. When the roller inside is heated to the required temperature the powder PVC melts, the roller begins to ro-tate and the cavity is filled evenly with the melted PVC by centrifugal force action. This makes the required interior part, usually creating a surface that cannot be unfolded, such as the dashboard. After a short cooling of the roller inside by cold air the roller is opened and the still warm part is taken out by the operator using protective gloves. Then the burrs are removed mechanically and the surface (design) of the finished part is checked under an UV lamp. This manufacturing method is also beneficial for manufac-ture of automotive interior parts, otherwise hard to pro-duce.
The manufacture of automotive interior parts of pow-der PVC on a foreign-made machine, the only manufactur-ing equipment in the organisation for this purpose, repre-sents a manufacturing technology related risk. The same machine is used by a sister company abroad.
Following a detailed analysis of potential risks a strate-gic plan of risk management was needed to minimise po-tential consequences of threatening manufacture stop as soon as they occur. The strategic plan included creation of a sufficient reserve stock of finished parts n complete sets both on the manufacturer´s and on the customer´s side. The safety reserve stock would bridge the period needed for the mould transport to the sister company and com-mencement of substitute manufacture including return of the finished products back to the factory for assembly. The strategic plan of risk management was discussed by the
manufacturing plant with the sister company abroad, ap-proved including a schedule of substitute manufacture as-surance and confirmed by an executed contract.
4 Discussion
At present there are already different measures permitting control of small risks that cannot be prevented. These measures include order record keeping in reliable inven-tory systems connected to the suppliers, which may pre-vent problems of mutual communication. An executed and legally controlled contract is however the key instrument of risk prevention. If the supply chain is disrupted in any way a quick remedial response minimises the risk impact. At present supply chain management is affected by factors related to increasing customer demand for quick response to changes brought about by innovations, high quality levels, cost reduction etc., which require process optimisation in all its components.
4.1 System Elements and System Structure
of Modified FMECA
The system consists of system elements used for descrip-tion and classificadescrip-tion of the hardware concept and ar-ranged into a hierarchical system structure [11].
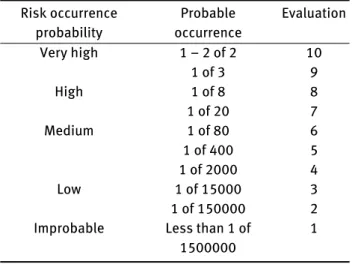
Table 3:Risk occurrence probability assessment (Source: In-house) Risk occurrence probability Probable occurrence Evaluation Very high 1 – 2 of 2 10 1 of 3 9 High 1 of 8 8 1 of 20 7 Medium 1 of 80 6 1 of 400 5 1 of 2000 4 Low 1 of 15000 3 1 of 150000 2
Improbable Less than 1 of
1500000
1
Potential risk occurrence analysis is performed for each monitored system element described in the system, with specification of potential impact and quantification of its relevance on a 10-point scale.
Possible risk causes due to defective function of sub-ordinate system elements are allocated to a certain super-imposed system element. Risk occurrence probability is es-timated for every possible cause, with quantification on a 10-point scale.
The analysis is ended by a list of existing preventive measures (measures for risk prevention) and the intro-duced control measures, for which the probability of the risk cause (mechanism) detection is quantified on a 10-point scale.
When assessing the integrated supplier chain and con-trol calculation execution the authors arrived at the conclu-sion that the unique production components represent the highest risk element (the most vulnerable part), as, if out of operation, they may cause failure of the whole system. Therefore a substitute solution must be prepared for each of these components.
5 Conclusion
After specification of all three scores the integrated crite-rion is calculated for each potential risk occurrence due to a defined cause. This is called the risk number, or RPN (Risk Priority Number), calculated as the product of the rel-evant scores of the individual evaluated criteria:
Risk number = relevance × occurrence (2) × detectability
Table 4:Modified risk occurrence cause evaluation (Source: In-house)
Detection Probability of risk
occurrence detection
Evaluation
Impossible Potential risk
occurrence cause detection is absolutely
impossible
10
Very remote Very remote possibility to detect potential risk
cause
9
Remote Remote possibility to
detect potential risk cause
8
Very low Very low possibility to detect potential risk
cause
7
Low Low possibility to
detect potential risk cause
6
Average Average possibility to detect potential risk
cause 5 Slightly above-average Slightly above-average possibility to detect potential risk cause
4
High High possibility to
detect potential risk cause
3
Very high Very high possibility to detect potential risk
cause
2
Nearly certain Detection of potential risk cause is nearly
certain
1
The RPN value must not exceed the defined threshold (for automotive industry RPN ≤ 120). In the case of higher RPN remedial measures are taken to lower the value.
Potential risk control in supply chain with the help of modified FMECA means finding potential supply chain failures. Risk probability scoring in relation to conse-quences for the end customer and the chances of the poten-tial risk detection by the existing system reduces the threat of the risk occurrence.
Important prerequisites for the above described method application include team work, knowledge of sim-ple quality management methods (brainstorming, cause
and effect diagram, 5 why, Pareto analysis etc.) and man-agement support.
The result is a proposed solution of elimination of the risk of manufacture failure with subsequent measure – ex-ecution of a contract for use of the same machine in an-other manufacturing company for the reason of minimisa-tion of producminimisa-tion loss.
Acknowledgement: This work is a part of these projects RVO/FLKŘ/2019/05, IGA/FLKŘ/2019/001.
References
[1] Švec, L. (2016) Risk management. FMEA method. 1st ed. Ostrava. Retrieved Jun 16, 2019, from https://docplayer.cz/18338444-1-management-rizik-metoda-fmea.html.
[2] Lourenço, H. R., Ravetti, M. G. (2018). Supply chain management. Handbook of Heuristics, (pp. 1241–1258), Berlin: Springer Inter-national Publishing.
[3] Islam, D. M. & Fabian Z. & Meier, J. & Aditjandra, P. T. & Zunder, T. H., & Pace, G. (2013). Logistics and supply chain management. Research in Transportation Economics, 41(1), 3–16. https://doi. org/10.1016/j.retrec.2012.10.006.
[4] Calhoun, F. S., Weston, F. S., & Stephen W. (2010). Introduction to Supply Chain Management Technologies. Introduction to Supply Chain Management Technologies. (2nd ed). Boca Raton, USA: CRC Press.
[5] Strohmandl, J. Tomek, M., Vargová, S., Čujan, Z. (2018). The use of the FMEA method for the evaluation of failures in crawler cranes. In VVaPOL 2018, 18. – 21. September 2018, Podbanské, SK, MATEC Web of Conferences 263, 01004 (2019).
[6] Davies, P. (2019) Brainstorming. 70 Activities for Tutor Groups. Abingdon: Taylor & Francis Group.
[7] Banghart, M., Fuller, K. (2014). Utilizing confidence bounds in Failure Mode Effects Analysis (FMEA) Hazard Risk Assessment. In IEEE Aerospace Conference Proceedings, 1-8 March 2014, Big Sky, MT, USA IEEE Computer Society.
[8] Stout, K., and Stout, K. (2012). Pareto Analysis. In Quality Con-trol in Automation, pp. 171–176, Berlin: Springer International Publishing.
[9] Zeitler, G. (2010). Thermoplastic Polyurethanes for Instrument Panel Skins. In SAE Technical Paper Series (Vol. 1). SAE Interna-tional. Published February 1, 1990 by SAE International in United States.
[10] Chamberlain, G. (1996). The ins and outs of automotive materials. Design News, 51(19), 95. ID 235217718.
[11] Aleš, Z., Legát, V. FMEA, FMECA method. Presentation. Quality management systems, TF, Retrieved Jun 16, 2019, from https: //slideplayer.cz/slide/2668242/, ČZU Praha.
[12] Eichler T. (2016). Do not be afraid of FMEA. Procedure of PFMEA analysis. Retrieved January 10, 2016 from: kvalita-jednoduse.cz/fmea
[13] Vaněček D. & Toušek, R. (2017) Supply chain management. 1 st ed. Faculty of Economics. South Bohemian University in České Budějovice.
[14] Sabadka, D. Molnar, V. Fedorko, G. & Jachowicz, T. (2017). Opti-mization of production processes using the yamazumi method. Adv. in Scie. and Tech.-Res. J. 11(4), 175-182.
![Table 1: Risk acceptability assessment [1]](https://thumb-us.123doks.com/thumbv2/123dok_us/9933196.2486194/2.892.97.814.129.294/table-risk-acceptability-assessment.webp)