Mohammed Almansor, MA, Zhang, C, Khan, W, Hussain, A and Alhusaini, N
Cross Lingual Sentiment Analysis: A Clustering-Based Bee Colony Instance
Selection and Target-Based Feature Weighting Approach
http://researchonline.ljmu.ac.uk/id/eprint/13658/
Article
LJMU has developed LJMU Research Online for users to access the research output of the
University more effectively. Copyright © and Moral Rights for the papers on this site are retained by the individual authors and/or other copyright owners. Users may download and/or print one copy of any article(s) in LJMU Research Online to facilitate their private study or for non-commercial research. You may not engage in further distribution of the material or use it for any profit-making activities or any commercial gain.
The version presented here may differ from the published version or from the version of the record. Please see the repository URL above for details on accessing the published version and note that access may require a subscription.
For more information please contact [email protected]
http://researchonline.ljmu.ac.uk/
Citation
(please note it is advisable to refer to the publisher’s version if you
intend to cite from this work)
Mohammed Almansor, MA, Zhang, C, Khan, W, Hussain, A and Alhusaini, N
(2020) Cross Lingual Sentiment Analysis: A Clustering-Based Bee Colony
Instance Selection and Target-Based Feature Weighting Approach.
Sensors, 20 (18). ISSN 1424-8220
Sensors 2020, 20, 5276; doi:10.3390/s20185276 www.mdpi.com/journal/sensors
Article
Cross
Lingual
Sentiment
Analysis:
A
Clustering
‐
Based
Bee
Colony
Instance
Selection
and
Target
‐
Based
Feature
Weighting
Approach
Mohammed Abbas Mohammed Almansor 1, Chongfu Zhang 1,2,*, Wasiq Khan 3, Abir Hussain 3
and Naji Alhusaini 4
1 School of Information and Communication Engineering, Zhongshan Institute, University of Electronic Science and Technology of China, Chengdu 611731, China; [email protected]
2 School of Electronic Information, University of Electronic Science and Technology of China, Zhongshan Institute, Zhongshan 528402, China
3 Department of Computer Science, Liverpool John Moores University, Liverpool L33AF, UK; [email protected] (W.K.); [email protected] (A.H.)
4 Department of Computer Science, School of Computer Science and Technology, University of Science and Technology of China (USTC), Hefei 230026, China; [email protected]
* Correspondence: [email protected]
Received: 21 July 2020; Accepted: 11 September 2020; Published: 15 September 2020
Abstract: The lack of sentiment resources in poor resource languages poses challenges for the
sentiment analysis in which machine learning is involved. Cross‐lingual and semi‐supervised
learning approaches have been deployed to represent the most common ways that can overcome
this issue. However, performance of the existing methods degrades due to the poor quality of
translated resources, data sparseness and more specifically, language divergence. An integrated
learning model that uses a semi‐supervised and an ensembled model while utilizing the available
sentiment resources to tackle language divergence related issues is proposed. Additionally, to
reduce the impact of translation errors and handle instance selection problem, we propose a
clustering‐based bee‐colony‐sample selection method for the optimal selection of most
distinguishing features representing the target data. To evaluate the proposed model, various
experiments are conducted employing an English‐Arabic cross‐lingual data set. Simulations results
demonstrate that the proposed model outperforms the baseline approaches in terms of classification
performances. Furthermore, the statistical outcomes indicate the advantages of the proposed
training data sampling and target‐based feature selection to reduce the negative effect of translation
errors. These results highlight the fact that the proposed approach achieves a performance that is
close to in‐language supervised models.
Keywords: cross‐lingual sentiment analysis; multi‐graph semi‐supervised learning; sample
selection
1. Introduction
With the development of Web 3.0 era, artificial intelligence (AI), increasing amount of multi‐
lingual user‐generated content are available that expresses the users’ views, feedback or comments
concerning various aspects such as products quality, services, and government policies. User‐
generated content contains rich opinions about several topics including brands, products political
figures, celebrities, and movies. Due to the business values of the huge bulk of user‐generated
Due to the multilingual nature of the user‐generated contents, the necessity for an effective and
autonomous multilingual and cross‐lingual social media analysis technique is becoming vital. The
majority of the existing sentiment research has been focusing predominantly on the English language,
except for a few researches exploring other languages. Various well‐regarded sentiment resources,
i.e., lexicons and labeled corpora, are constructed for the English language. Research progress in other
global languages is limited due to the lack of such sentiment resources [1–8]. The manual
development of dependable annotated sentiment resources for each poor resource language and its
domain is a time‐consuming and intensive task. In order to overcome the annotation cost, various
solutions have been proposed in the literature to exploit the unlabeled data in target‐language (this
is called semi‐supervised learning) [1], or to explore translated models and/or data available in other
languages (this is called transfer learning) [3–5,9]. The lack of these annotated resources in the
majority of languages motivated research toward cross‐lingual approaches for sentiment analysis.
Language Adaptation (LA) or Cross‐Lingual Learning (CLL) is a particular example of Transfer
Learning (TL), that leverages the labeled data in one or more related source languages to learn as a
classifier for unseen/unlabeled data in a target domain. More specifically, the leveraging of sentiment
resources from rich language to predict sentiment polarities of a poor‐resource language text is
referred to as Cross‐Lingual Sentiment Classification (CLSC). Language with the availability of rich
and reliable resources is usually referred to as ‘source language’, while a low‐resource language is
referred to as the ‘target language’. Despite the fact that sentiment analysis has received notable
attention from the research community, there are limited works that focus on cross‐lingual sentiment
analysis. The difficulty of handling cross‐lingual sentiment analysis comes from various sources such
as loss of polarity during machine translation, cultural disparity, feature divergence, and data
sparsity. In addition, the noisiness and informal nature of the social media text poses additional
challenges to cross‐lingual sentiment analysis.
Supervised Cross‐Lingual (SCLL) as well as Semi‐Supervised Learning (SSL) are commonly
used approaches to control sentiment analysis in poor resource languages with little to no labeled
data available [9]. SCLL techniques attempt to make use of current annotated sentiment resources
from opulent language domain (i.e., genre or/and different topics). These approaches employ
machine translation (from target to source languages, or from source to target, which are referred to
as bidirectional), bilingual lexicons or cross‐lingual representation learning techniques with parallel
corpora to project the labeled data from source to targeted language [1,3,9,10]. It should be noted that
state‐of‐the‐art CLSA techniques suffer from insufficient performance due to the low machine
translation quality as well as cultural and language divergence [3,4,9,11,12] (i.e., various sentiment
expressions and social culture). The success of these approaches is largely dependent on how similar
the projected source data and target language data are. In contrast, SSL techniques such as co‐
training, self‐training, and active learning for cross‐lingual sentiment classification, rely on a small
quantity of labeled data from the same domain, which necessitates additional annotations. However,
SSL techniques suffer from data sparseness as the small amount of labeled data used cannot cover all
target test data topics. Additionally, SSL techniques cannot reasonably use large translated resources
from rich languages. Therefore, discovering methods to exploit translated labeled data sets and
unlabeled target data to enhance classifier performance has recently become a popular research topic.
In this paper, an efficient integrated supervised and semi‐supervised learning is proposed in
order to address the cross‐lingual classification issues. The critical idea is to develop a cross‐lingual
learning model that can overcome the disadvantages of both SCLL and SSL via fusing sentiment
knowledge‐translated labeled and target unlabeled from multiple sources. The aim is to incorporate
an extended supervised learning model trained over the selected translated labeled data samples
along‐with semi‐supervised models learned from the target unlabeled data, to achieve superior
performance. The paper investigates several research questions that are relevant in addressing cross‐
lingual sentiment analysis, including: 1) Which direction of SCLL or SSL is better with scarce resource
languages? 2) Could translated sentiment sources be employed together with target data to solve
To summarize, this work has a number of contributions. First, it proposes two‐dimensional noisy
data reduction. In the horizontal dimension, a new cluster‐based meta‐heuristic sample selection
method is proposed to select the optimal, informative and representative training sample. The aim is
to avoid noisy examples in order to achieve the target classification best performance. In the vertical
dimension, a novel modification of feature selection algorithms is proposed to select features from
the translated source data set not only based on their association with classes but also associated with
target data. This means that features or opinion expressions are excluded even if they are
discriminating, and are only source language‐specific features. Only features that are discriminating
and related to the target language are chosen. Secondly, this work proposes a new integrated model
where an ensemble model trained over the translated data is integrated with a semi‐supervised
model trained over the target data at the learning phase. The target test data is then passed to the
trained integrated model, which is responsible for classifying test data instances that are similar to
the source data and passing them to the semi‐supervised model. So, the integrated model fuses
knowledge from translated data, and simultaneously, uses target language data to handle the
divergence of data distribution.
The remainder of this paper is organized as follows. Section 2 shows related studies on cross‐
lingual sentiment analysis. The proposed method is presented in Section 3. The experiments’
methodology and experimental results are presented in Sections 4 and 5, respectively. Conclusion
and further works are illustrated in Section 6.
2. Related Studies
Cross‐lingual sentiment analysis is introduced to alleviate the problem of developing training
data and building separate models for different languages and domains. The following subsections
summarize the challenges and existing approaches for cross‐lingual sentiment analysis.
2.1. Challenges of CROSS‐LINGUAL Sentiment Analysis
Cross‐lingual sentiment analysis task shows many challenges. Loss of polarity, cultural
disparity, feature divergence, and data sparsity are all considered as challenges [1,4,9,10,12].
However, loss of polarity or the issue of labeling mismatching caused by the erroneous machine
translation of source language training data severely deteriorates the analysis performance [3].
Previous work predominantly relies on machine translation engines or bilingual lexicons to project
data from the source language to the target language [1,2,13]. Machine translation quality is still low
and far from satisfactory [1,2,9]. Additionally, machine translation may result in the mistranslation
of a word into something with a totally distinct meaning, which can negatively affect the quality of
the projected source language labeled data. However, this is not a factor in performance degradation.
On the other hand, cultural disparity is a major difficulty in cross‐lingual sentiment analysis, despite
translation quality [14]. Each language has its own particular way of expressing sentiments and
writing styles. Even in the scenario of expressing a comparable idea, there can be a huge disparity in
the vocabulary and metaphor within the context of various languages, leading to a far smaller word
and phrase intersection between native expressions and translations [9]. Furthermore, feature
distribution, which refers to instances of mismatching between the knowledge examples that the
classifier acquired in training phase, contains many source and target language‐specific features
which need to be categorized. From a sentiment analysis perspective, this relates to the cross‐domain
sentiment analysis situation where training and test data are drawn from various domains, therefore
making it a hurdle for traditional semi‐supervised and supervised classification algorithms to attain
satisfactory sentiment classification [10,14]. Additionally, using machine translation, auto‐translated
data contains a vast number of irregular words and meaning‐less terms as a result of translation
errors. References [15,16] indicated that incorrect translations show an increase of noisy features and
sparseness. This implies that poor translation quality results in generating noisy features that
ultimately provides poor classification accuracy.
2.2. Main Techniques for CROSS‐LINGUAL Sentiment Analysis (CLSA)
Despite the fact that sentiment analysis has received a significant amount of attention, very few
methods have been put forward for cross‐lingual sentiment classification in various methods. First,
translation‐based methods are dependent on machine translation or bilingual dictionaries [17,18] to
project the annotations from the source language into the target language, or vice versa. A
classification model is then trained over the target data with projected annotations [2,13]. Earlier
works utilize the bilingual dictionaries to transfer the sentiment features from one language to
another. For example, in [17] a lemmatized form of English terms from ‘Opinion Finder’ was
extracted and translated with two bilingual dictionaries to create a subjective analysis lexicon.
Authors in [18] used a bilingual dictionary to create a bilingual word pair that was extracted from
high‐occurrence terms contained within the source and target language. The word pair is then
utilized to extend the Structural Correspondence Learning Approach (SCL) proposed by Blitzer et al.
[19] from cross‐domain to cross‐lingual adaption. The primary disadvantage of bilingual dictionaries
is that they are unable to capture a word context during translation, as each word may possess a
distinct meaning in a variety of contexts. Thus, it is likely to generate a negative effect on the accuracy
of sentiment analysis in the target language [1,20]. The recent innovations in machine translation have
motivated researchers in sentiment analysis to utilize freely available MT services such as Google
translator and Bing translator. For example, the researchers in [2] showed that machine translation is
a reliable tool to generate sentiment analysis resources for multilingual sentiment analysis. More
recently, [13] investigated whether machine translation could be employed to generate reliable
training data for emotion analysis. For this purpose, they employed Google engine to translate the
original text from the source language. In [21], a direct transfer model, namely, adversarial deep
averaging network, is trained to transfer the knowledge learned from source labeled data, whereby
the model attempts to create language invariant bilingual representations. Despite recent
advancements in machine translation tools, researchers are still unwilling to take advantage of such
technologies as they have concerns about the capabilities of machine translation systems to preserve
the sentiment information across languages.
The second method can be referred to as domain adaptation methods that attempt to deal with
the cross‐lingual using cross‐domain adaptation. For instance, Structural Correspondence Learning
(SCL) [19] was employed for CLSA in several studies, including [18,22]. Such methods provide
correspondence among words taken from two different languages utilizing ‘pivot features’ which
represents the set of frequent features provided in both languages. In this case, a pair of words is
utilized from source and target languages as pivot features to model the correlation among these
features and other words using leaner classifiers and unlabeled data set which can be used as an
independent language predictor. Additionally, Li et al. [22] employed the distributed representation
of words to build one‐to‐many mappings between the pivot features in the source language (English)
and those in the target language (Chinese). The direction aims to deal with feature divergence or
domain mismatch between translated resources and target data. Unfortunately, accuracy
degradation naturally occurs even in cases of perfect MT, because of the cultural disparity, i.e.,
language divergence. Also, there is no regular method for pivot selection and therefore, these
methods cannot guarantee performance in all situations.
The third direction of CLSA is cross‐lingual representation learning methods. These methods
prompt language‐independent features to bridge the cross‐lingual distinction in the original word‐
level representation space and build connections across various languages [23]. The majority of these
methods employ parallel corpora to train bilingual word embedding to obtain aligned inputs for
learning feature extraction that works with both languages [24]. Recently, Chen et al. [25] proposed
the idea of joint two‐view convolutional neural networks (CNNs) to grasp the connection from
opinionated documents across languages. Their method begins by projecting the extracted parallel
sentiments connection into a bilingual sentiment relation space. Then, it captures the connection by
subtracting them with an error tolerance. In [26], sentence‐aligned corpora were used between a pair
of resource‐rich and resource‐poor languages. The assumption is that the system is reliant upon the
Later, [27] presented a model that could be used to learn distributed representations through a
hierarchy of network architectures.
Recently, [28] demonstrated that word embedding can be enriched for sentiment information
without the necessity of a labeled corpus. This enrichment improves the performance across
sentiment and non‐sentiment‐related tasks. The primary disadvantage of the cross‐lingual
representation method for CLSA is the need for large parallel corpora, which is difficult to obtain,
especially when high quality is required.
Semi‐supervised learning direction is followed by researchers when needing to deal with
cultural disparity challenges in which each language has its own sentiment expressions. Researchers
used unlabeled data in the learning process to strengthen classification performance [29,30]. A
bilingual co‐training approach is exploited to leverage annotated English resources for sentiment
classification in Chinese. A machine translation service was utilized to translate labeled English
documents (training documents) and unlabeled Chinese documents (testing documents) into each
other. The author used two different views (English and Chinese) and employed the co‐training
approach for a classification problem. Later, unlabeled data for the target language are incorporated
into the learning process via a bi‐view framework proposed by [20]. The key idea is to enrich training
data through the addition of the most confident automatically labeled examples, as well as a few of
the most informative manually labeled examples from unlabeled data in an iterative process.
Finally, several works have recently been introduced to incorporate sentiment information.
Bilingual Sentiment Embedding (BLSE) [31] is proposed to jointly optimize and represent both
semantic information and sentiment information given comparably little bilingual lexicon and an
annotated sentiment corpus.
Related to this work, some researchers have tried and are trying to solve the issue of different
term distribution between the training (translated data from source language) and test data in CLSC‐
incorporating unlabeled data from the target language using a semi‐supervised learning approach.
A number of research studies use the supervised or semi‐supervised classification trained on
translated data to classify the unlabeled target data. The most solid instances are used as seeds for a
semi‐supervised model. Due to the significant vocabulary gaps between source data and target data,
the supervised model incorrectly classifies instances of the seeds that, in turn, were used in the semi‐
supervised model. When the initial classifiers are not sufficient, this can increase the examples that
are incorrectly labeled within the training set. Hence, using noisy examples will decrease the accuracy
of the learning model as well as the performance of each classifier. It should also be noted that
confident classified examples may not essentially provide information during the learning process.
Hence, the addition of these examples may not be useful from the classifier point of view.
Both [1] and [32] used active learning with semi‐supervised learning to select the most confident
and most informative training samples to be added. The main disadvantage of this method is that it
requires human intervention from experts in the target language, and this can be regarded as the
semi‐automatic annotation of the data set. Considering these problems, several factors are dwelt on
within the proposed research study. First, the model proposed utilizes the available sentiment
resources, labeled translated data set, labeled seed from the target language, and unlabeled data from
the target language. Second, the proposed model integrates a supervised model with semi‐
supervised at the learning phase. Third, this work brings forward a new clustering‐based bee‐colony
sample‐selection method to choose the optimal, informative, and noiseless representative training
sample to achieve superior performance of the target classification. This work proposes target‐based
feature‐selection algorithms to select features from the translated sources data set based on their
association with classes and with the association with target data. This means that feature or opinion
expressions that are discriminating and associated with the source language specific‐features, are
excluded. Hence, only features that are discriminating and related to the target language are selected.
2.3. Main Techniques for Instance Selection and Feature Weighting
The handiness of vast amount of source target training data has necessitated the development
Most of the proposed algorithm focus on randomly selected subset of data. Recent approaches for
training sample selection are classified into instance‐based methods and feature‐based methods.
Instance‐based methods focus on weighting individual instances based on their importance to the
target domain [33]. Feature‐based methods are based on projecting, mapping, as well as representing
features in a way that the source classifier can achieve well using the target data. A feature‐based
method presented in [34] uses a greedy algorithm for the selection of a subset of features from a
source data matrix which approximates the features of a target matrix. Xia [5] identifies the most
relevant target domain samples and uses them as the training dataset. In [35,36], a semi‐supervised
learning technique called PU learning is used to identify and weight these instances. The performance
is evaluated on cross‐domain sentiment classification. Different samples in the source training are
provided with different weights during the base model training to make the distribution of training
dataset resemble the distribution of target data. In Xia et al. [36], the authors extend this work by
taking both sample selection bias and sample selection variance into consideration for the domain
adaptation. To improve PU‐learning, [37] proposed an approach called PUF that additionally selects
reliable negative instances through the fuzziness of the instances.
3. The Proposed Method
As discussed earlier, the primary aim of the proposed method is to leverage the available
sentiment resources, translated resources, and target language resources to strengthen the sentiment
analysis performance and tackle the language gaps. The key idea presented in this work by
integrating SL with SSL is that the supervised model is responsible for classifying target data that are
similar to training data, i.e., translated data. Those target instances that are classified with low
confidence by the supervised model are passed with prior information to a semi‐supervised model
trained over the target data for classification. The concept of transferring previous information is to
combine the influence of translated resources with the influence of target data and to reduce the time
complexity of graph‐based algorithms by accelerating them to convergence.
To benefit from translated resources effectively, two levels of filter are proposed to minimize the
translation noise. The first level (horizontal level or sample selection) aims to select optimal,
informative and representative training samples and avoid noisy examples to achieve the best target
classification performance. The second level (vertical level or feature selection) uses a target‐based
feature selection algorithm to select features that are discriminative and simultaneously associated
with the target data. Generally, the proposed method consists of (1) clustering‐based bee‐colony
training sample selection, (2) target‐based feature selection, (3) ensemble supervised learning, (4)
integrating prior supervised information with semi‐supervised learning, (5) multi‐graph semi‐
supervised learning. The details of each component are shown as follows.
3.1. Clustering Based on BEE‐COLONY Training Instance Selection
Instance selection (sample selection) is one of the important components of cross‐lingual
sentiment classification because a rich‐resource language such as English has many datasets from
different domains, each containing large size of labeled reviews. Therefore, it is quite easy to obtain
a large collection of labeled reviews along‐with machine‐based translation. However, only some of
them may be useful for training a desired target‐language sentiment classifier. Therefore, it is
important to identify the samples that are the most relevant to the target domain. Under this
circumstance, instance selection is necessary for training an effective classifier [35,36,38]. Unlike
domain adaptation, instance selection within the cross lingual adaptation has an additional aim to
filter out the noisy instances from a selected dataset. Such noisy instances (or outliers) within the
source translated dataset are usually generated due to the language gap and translation errors.
Existing multi‐source or single source cross‐language methods frequently utilize the entire
translated source data and ignore the selection of appropriate data instances from the translated
source data to be used for adaptation. Nonetheless, assuming the availability of a single‐source
language or multi‐source languages, it is critical to adapt and choose the most efficient training
attention. Because of the vocabulary gaps between translated data and target data, the supervised
classifier will not accurately classify the target data. To overcome this problem, this section describes
an instance selection algorithm to select the high‐quality training data from the translated source
language data that is used to train the supervised classification model. The main objective of this
component is to select the optimal training samples to achieve efficient performance of the target
classification. In this phase, the top ranked source domain clusters are selected as a source training
set. Given that the translated data instances from source(s) languages and domains, a new cluster‐
based bee‐colony meta‐heuristic instance selection algorithm is proposed to discover the best training
sample from the source language.
3.2. Clustering Target Language Data
The algorithm divides the target language into Q number of clusters, each represented as Cq,q
= {1, 2, ..., Q}. The aim is to utilize these clusters to select representative source training data. To
overcome the limitations of k‐based clustering where the number of clusters must be predefined, this
work introduces radius‐based clustering. The step‐by‐step flow of the proposed algorithm is
summarized below:
(i). Inferring a target data similarity matrix: Given an unlabeled target data set consisting of the
feature vectors of m unlabeled reviews, U u , … . , u , The similarity matrix element S is
computed between each pair of the unlabeled reviews (u , u) from the target language dataset
using cosine similarity measure as in Equation (1):
S cos u , u |u |∗ u u ∗ u
(1)
The constructed similarity matrix is built through computing pair‐wise similarity between the
target set instances:
S . . S . . . .
S . . S (2)
(ii). Estimating reviews density: A random number r is selected where 0.5 r 1. The algorithm
then calculates the density of each unlabeled review u of the data as:
Density ui | u : S r ;∀j (3)
where S is the cosine similarity cos u , u between two feature vectors of review u and
u. Density u is the density of review, u is the set of all reviews whose cosine similarity such
that the review u is greater than r. After computing the density function for all reviews, a
review which has the highest density (i.e., Density u Density u ;∀j) is then chosen as the
seed of the first S , i.e., review which has most similar reviews, and all reviews in S density
set d : dist u , u r ;∀j are removed from the data set.
(iii).The centroid of each cluster: Given the selected review and all reviews in its density set, the
centroid of a formed cluster is computed as average of the feature vectors of all cluster members
(i.e., density set members), as shown in the equation below:
μ |C |1 u∝
| |
∝ ,
(4)
where μ is the centroid of the formed cluster, |C | is the number of reviews in the cluster f and
u∝ is the feature vector of review u∝.
(iv). Selection Q optimal target clusters: Repeat step (iii) and step (iv) to continue selecting the
subsequent clusters as long as the algorithm continues to find documents in the data set.
3.3. Improved Artificial BEE‐COLONY Training Selection
Algorithm 1. In this step, the goal is to craft an approach for selecting a training sample from the
source language. This means finding an optimal translated source data to be utilized as training data
for the target language. The selected sample is aimed to be representative, with fewer translation
errors, and suitable for the target domain. Also, sample instance topics must have the same topic
distribution as the target language data, i.e., contains data that cover more topics in the target data in
the concept space.
To start with, the artificial bee colony (ABC) produces a randomly distributed which will be the
population of SN solutions (i.e., positions of the source food) using search space, in this case the SN
represents the size of engaged bees. Each solution x is a D‐dimensional vector in which k
represents the number of the solution with k 1,2, … , SN. Here, D is the number of translated
reviews from a single source. All solutions generated in this phase are collected using (5):
x θ , (5)
θ , is a random number between [0,1] while z is the number of a translated reviews from the
given source z 1,2, … , D. After the initialization phase, each employed bee’s position is discretized
to reveal the selected and omitted reviews. Specifically, employed bees are represented as a vector of
0,1 defining whether a review d in the translated dataset from a particular domain, is selected or
not, as shown in (6)
x , 1 if d is selected in solution k0 otherwise (6)
This means changing the real position to a discrete one; each x, is set to a binary number 0 or
1. The following equations are applied to map each x to be zero or one:
x , S 𝜽𝒌,𝒛 1 1e 𝜽𝒌,𝒛 (7)
Then, the artificial bee colony calculates the amount of nectar in each food source depending on
the quality of the associated solution. Given g target data clusters and the calculated centroid μ f
1, . . , g of those clusters calculated in the previous section. To calculate the fitness F of each solution
(employee bee) x , the algorithm does the following steps:
(1) For each review d from the solution x ( selected sample from the source), the algorithm
finds the maximum similarity of review and each centroid μ of the g target clusters as
follows:
ms max
∀ cos d ,μ (8)
where ms can be defined as the maximum similarity of a review d and the target data.
(2) Then, the fitness of the solution x is defined as average of total maximum similarity of all of
its reviews and calculated as follows:
F ∑ ∈| x |ms (9)
| x | is the number of selected reviews in the solution x . An onlooker bee assesses the
information of the nectar for all employed bees and selects the source of the food based on the
probability of the nectar quantity. This probability value is determined based on the following
formula:
P F
∑ F (10)
To provide diversity for the population, the onlooker is required to find local search with
bee colony introduces the global optima into the search formula of artificial bee colony for improving
the exploitation based on the following formula:
x , x , θ , ∗ x , x , β ∗ x x , (11)
where x , is a new value of review d in the generated solution x , x , is the value of review d in
the solution x which ℎ is a random number between 1 and D and not equal to k and x is the
value the value of review d in the best global solution x . Onlooker bees as well as employed
bees complete manipulation for the search area, and consumed food sources are replaced with a new
one using the artificial bee colony algorithm with the scout bees during the discovery process. If the
position is not enhanced as a previously determined cycle number, the food source is acknowledged
as abandoned. In this case, a previously concluded cycle number is considered the “limit” for
abandonment. With this scenario, three control parameters in ABC are utilized: the number of food
sources (SN), equals to the number of employed and onlooker bees, the limit value and the maximum
cycle number (MNC). If an abandoned solution is assumed to be x and z 1, 2 … D, the scout
goes to search for a new replacement solution, as in Equation (12).
𝑥 , 𝑥 , 𝑟𝑎𝑛𝑑 0,1 ∗ 𝑥 , 𝑥 , (12)
where x , is the value of review d in the solution x , x , and x , are the lower and upper
bounds of the value of review d in the generated solution x , respectively.
The performance of new food source is compared with the previous one. When the new food
source has an equivalent or more amount of nectar than the previous one, new one will substitute the
old food source in memory. Otherwise, the old one holds its memory position. This implies that a
greedy selection mechanism is used to make selections among the old source and that of the
candidates.
Algorithm 1. ABC algorithm Pseudo code
Input: Translated Training Data, Q optimal target clusters, S centroids of target clusters Output: Optimal Training Data
For each Cluster C in Q target clusters
(1)Generate the initial population { x , … . . , x
(2)Assess the fitness of the population using Equation (9) (3)Let cycle to be 1
(4) Repeat
(5) FOR each solution (employed bee) Begin
Find new solution from x with Equation (11) Determine the fitness value using Equation (9) Employ greedy process
EndFor
(6) Find probability values 𝑷𝒊 for the solutions utilizing Equation (10)
(7) FOR every onlooker bee Begin
Choose solution based on P
Generate new solution from x utilizing Equation (11) Determine the fitness value using Equation (9) Employ greedy selection process
EndFor
(8) If abandoned solution for the scout is determined, Begin
swap it with a new solution
EndIF
(9) Remember the best solution up to this point (10) increase cycle by 1
(11) Until cycle equals to MCN
3.4. Target‐Based Feature Selection Methods
Algorithm 2. In the previous step, a sample selection or horizontal noise removal is used, which
selects a sample of best training instances that are appropriate for the target language. This has been
performed at instance level. In the following step, these reviews are passed through machine
translation using Google translation, preprocessing and feature selection components. In traditional
feature selection methods, features are selected based on their class weights. However, not all features
included in these instances are useful for target language sentiment analysis. For instance, a word
that cannot be translated to the target language by the machine translation appears in its original
language in the translated text. These words should be removed even if they are selected by the
feature selection method. To design a target‐based feature selection, we introduce target‐feature
weighting methods for selecting features that are discriminating and suitable for the target language.
This is called ‘vertical noise removal’. Features are chosen according to two factors a) to their class
weights and b) target‐language weights. Firstly, this work evaluates a pointwise mutual information
feature weighting method for measuring its correlation with source data classes. The pointwise
mutual information feature selection method selects features for each class according to the co‐
occurrence measure between a feature f and a class c. The pointwise mutual information (nPMI)
between the feature and its classes is calculated using (13).
nPMI class c , f ∑PMI c , f
PMI c , f (13)
After that, features are weighted in target data based on their occurrence in the target data using
(14):
Tw f f T, f
f T, f f S, f (14)
where f T, f and f S, f are the term frequency‐inverse document frequency (TFIDF) of feature
f in both sources translated data and target data.
Algorithm 2. Algorithm for integrating prior supervised information with semi‐supervised
training.
Input: UT Test Unlabeled data from the target language,
LS: Selected labeled training sample from Source language.
Output: Unconfident Group UG, Prior Label matrix PL, confident group CG
Begin
(1) Train classifier C1 on LS.
(2) Train classifier C2 on LS.
(3) Train classifier C3 on LS.
// C1, C2 and C3 used to predict class label and calculate
// the prediction confidence of each example in U
(4) For Each (Example ui in UT)
Begin
P1←Predict_label(c1,ui)
P2←Predict_label(c2,ui)
P3←Predict_label(c3,ui)
// calculate average confidence values ACV←ensemble P , P , P
IF ( ACV >γ) Begin CG←CG∪ u, l Else UG←UG∪u PL←ACV ENDIF ENDFOR
(4) Call Semi Supervised UG, PL
End
RETURN CG, UG, PL
3.5. Ensemble Supervised Learning
The final prediction is performed using an ensemble approach by integrating the outcomes from
a supervised and a semi‐supervised model. The supervised model is trained using a selected sample
from the translated source data while the semi‐supervised graph‐based model learned the patterns
within the target data. The main objective is to strengthen the classification performance and reduced
complexity of the graph‐based model.
In the ensemble model, classification is performed using the weighted voting to combine the
predictions from multiple algorithms as in Equation (15):
H x αh x (15)
where h is a classifier, H is …., alpha is the Naïve Bayes, maximum entropy, and logistic regression
are utilized as base classifiers. Each weak classifier offers an output prediction, h(xi), for every target
test sample. Every base learner has a weight, αi so that the error sum is minimized.
Naïve Bayes uses the Bayes’ theorem with strong or naïve independence assumptions for
classification. Provided with feature vector table, the algorithm calculates the posterior probability
that the document belongs to distinct classes and assigns the document to the class that has the
highest posterior probability. To classify the most probable class c* for a new document d, NB
computes Equation (16):
C∗ argmax p c|d
(16)
The NB classifier calculates the posterior probability as in Equation (17):
p c d p c p c dp d (17)
A detailed explanation of the NB classifier can be found elsewhere. Maximum Entropy (ME)
classifier estimates the conditional distribution of the class label c given a document x using the
form of an exponential function with one weight for each individual constraint as in Equation (18):
P c | x 1
z x e , (18)
f c , x 1 if c c and x contain w
0 otherwise (19)
where each f c , x represents a feature, ω is the weight to be determined through optimization,
and Z x is a normalization factor. P c | x is estimated for each class, and the class with the highest
probability value will be selected as the class of document x. f c , x as an indicator function returns
one only when the class of a particular document isc, and the document contains the word w .
Further details about ME can be found in [37]. Logistic regression defines the predicted probability
f x P c | x e ⋯
1 e ⋯ (20)
where the coefficient β controls the effect of the feature. The further a β drops from 0, the more
dramatic the effect of the feature f.
The diversity of the ensemble classifier is generated by several factors:
(1) Using different types of base classifiers.
(2) Selecting samples that contain instances generated randomly, and
(3) Selecting samples that are distributed in a representative and informative way. The final
prediction output of the ensemble model is obtained by averaging the confidence values for each
label.
3.6. Integrating Prior Supervised Information with Semi‐Supervised
To leverage the benefits of the source language annotated resources through supervised
approaches and the unlabeled examples from the target language through semi‐supervised learning,
we use an integrated model that combines both approaches. The output from the ensemble model
(described in the previous section) is clustered into two categories on the basis of the obtained average
confidence values. The average confidence of an example is calculated by averaging the confidence
of the majority classifiers in predicting the label of that example. The first type of output is a group
of all test instances that have been assigned to their classes based on high average confidence values,
i.e., a group of the most confident, positive examples and the most confident negative examples.
Classes associated with these test instances are considered as their final class predictions.
The second group (i.e., unconfident group) represents the set of test instances that have been
assigned low average confidence values because they contain target language opinion expressions.
In other words, they have different term distribution with the translated training data set. Instances
of the unconfident group are transferred along with their associated values to the semi‐supervised
learning module (next section).
3.7. SEMI‐SUPERVISED Learning
As mentioned in the previous section, the semi‐supervised model is responsible for classifying
test instances that have been categorized with low average confidence in ensemble model. The idea
is that they contain target language opinion expressions i.e., they have different term distribution
with the translated training data set. Given a data set X X ∈ R , where, d is the dimension of
the feature space. X x , , x is a labeled seed set from the target data. Y is the R ∗ label
matrix of these seed sets. For each review i from the seed set, Y i, 0 is 1 if x is labeled as
negative, and Y i, 1 is 1 if x is labeled as positive. X x , , x is an unlabeled
unconfident set with prior probabilities from the supervised model. Y is the label matrix for the
test data set. Y is R ∗ . N n m is the size of the total data set. For traditional graph‐based
method, both Y i, 0 , and Y i, 1 are initialized to 0 for each review from the test set. In our
integration algorithm, Y i, 0, and Y i, 1 are the prior probabilities for positive and negative
classes passed from the supervised model. The multi‐graphs algorithm as shown in Figure 1 is
described below:
Step (1) Each review is represented as a feature vector.
Step (2) Initialize the label matrix Y ⌊Y ; Y ⌋ ∈R ∗ for the labeled data set. Y and
Y is described above.
Step (3) Randomly select f features from all features
Step (4) Graph construction:
a) Each x a labeled or unlabelled review, a node is assigned. Allow V v , … . , v to be a set
b) K‐NN node calculation: To construct the graphs, the nearest neighbor method is employed.
Two nearest k neighbors set a review of x and is determined where Knn x is a set of K
nearest unlabeled neighbors, and Knn x is a set of K nearest labeled neighbors of x. A
review x is assigned to one of the k nearest neighbors set of review x if their edge weight
w between their feature vectors is greater than ε. The weight of an edge w is defined with
the Gaussian kernel:
w exp xv σxv (21)
where xv is the feature vector of review x, Weight matrix W WW WW is constructed.
Step (1) Run semi‐supervised inference on this graph utilizing label propagation:
Y ← 1 γ W Y γ W Y . (22)
Finally, Normalize Y
Repeat the above steps n times from step 3 to build n trained semi‐supervised models
each trained with different feature set;
Step (2) The n Semi‐Supervised classifier vote to determine the final labels for the unlabeled data Y .
Figure 1. Multi‐Graph Semi‐Supervised Learning with Prior Label Information.
4. Experimental Design
This work is evaluated using a standard evaluation data set for cross‐lingual sentiment
classification from English to Arabic presented in [3]. The Amazon corpus [19] is used as a benchmark
dataset. This data set contains four distinct types of product reviews extracted from Amazon.com,
including Books (B), DVDs (D), Electronics (E), and Kitchen Appliances (K). Each review comes with
full text and the rating score from the reviewer. As in [29], 800 reviews have been selected randomly
from Amazon product reviews dataset, 200 of each domain. Then, we employ Google Translate (GT)
to translate the test data to the target language and manually correct the output. Table 1 summarizes
the dataset characteristics.
Table 1. Characteristics of The Data Set.
Dataset/Features Books DVDS Electronics Kitchen
No. of reviews 2000 2000 2000 2000
Positive 1000 1000 1000 1000
No of features 188,050 179,879 104,027 89,478
Average length/review 239 234 153 131
To measure the performance of sentiment classification methods, experimental results are
presented using the gold standard statistical metrics used in machine learning that include: True
Positive (TP) of a class is the set of reviews that are correctly assigned to that class, False Positive (FP)
of a class is the set of reviews that are incorrectly assigned to that class, False Negative (FN) of a class
is the set of reviews that is incorrectly rejected for corresponding class, and True Negative (TN) is the
set of reviews that is correctly rejected to that class. Precision, recall, and F1 are used to measure
performances.
5. Result and Discussions
The following experiments are conducted using the aforementioned dataset and validation
metrics (1) baseline ensemble models where experiments are conducted to evaluate the baseline
ensemble model (2) baseline semi‐supervised learning, and (3) the proposed integrated model. All
the experiments outlined are with consistent model configurations, training and test data.
The first set of experiments is to evaluate Supervised Cross‐Lingual Learning sentiment analysis
(SCLL). This means that these experiments use only translated data for the training process. Initially,
LR, NB, and ME and voting ensemble classifiers are trained using translated data from English and
Arabic dataset. The experimental results using LR, NB, ME, classifiers voting ensemble on Books B,
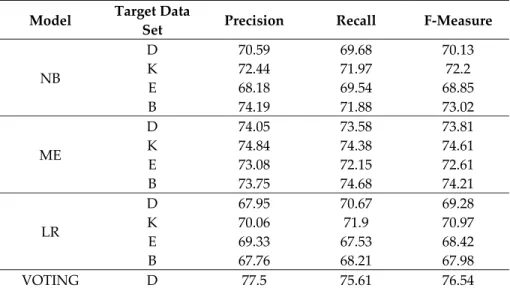
DVDs D, Electronics E, and Kitchen Appliances K are summarized in Table 2 and Figure 2. Table 2
indicates that the highest performance is obtained with the voting ensemble classifier with f‐measure
performance of 76.54%,75%, 73.42%, and 76.92% on Books B, DVDs D, Electronics E, and Kitchen
Appliances K, respectively. On the other hand, the LR classifiers show poor classification accuracy
with f‐measure performance of 69.28%, 70.97%, 68.42%, and 67.98% on Books B, DVDs D, Electronics
E, and Kitchen Appliances K, respectively. The outcomes from ensemble model clearly indicate the
superiority over the performances of individual classifiers. This further indicates the independence
between the predictions from individual classifiers.
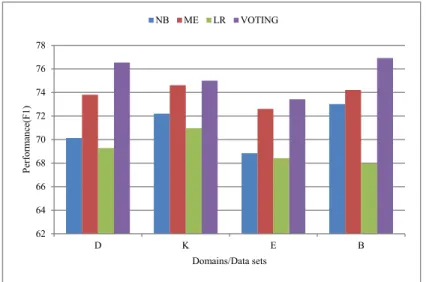
Figure 2 demonstrates that the performance of the baseline classifiers varies from domain to
domain. However, generally, the results obtained by the proposed model are significantly better than
those obtained by supervised in‐lingual adaptation. We argue that this is because different term
distribution between original and translated documents can lead to low performance in cross‐lingual
sentiment classification.
Table 2. Performance of baseline supervised learning models.
Model Target Data
Set Precision Recall F‐Measure
NB D 70.59 69.68 70.13 K 72.44 71.97 72.2 E 68.18 69.54 68.85 B 74.19 71.88 73.02 ME D 74.05 73.58 73.81 K 74.84 74.38 74.61 E 73.08 72.15 72.61 B 73.75 74.68 74.21 LR D 67.95 70.67 69.28 K 70.06 71.9 70.97 E 69.33 67.53 68.42 B 67.76 68.21 67.98 VOTING D 77.5 75.61 76.54
K 76.43 73.62 75
E 74.36 72.5 73.42
B 77.16 76.69 76.92
The second experiment is to evaluate the Semi‐Supervised Learning (SSL) sentiment analysis
that only uses seeds from the target language. The co‐training semi‐supervised learning method is
evaluated. Results are also provided in Table 3. Table 3 shows that the highest performance is
obtained with the SSL with f‐measure performance of 62.07%, 64.41%, 66.67%, and 63.01% on Books
B, DVDs D, Electronics E, and Kitchen Appliances K respectively. From Tables 2 and 3, the results
show that SCLL trained with large translated data from the source language is superior to the SSL
with seed from the target language.
Figure 2. Performance of baseline supervised learning models on Books B, DVDs D, Electronics E, and Kitchen K domains.
Table 3. Performance of Baseline Semi‐Supervised Learning Model.
Target Data Set Precision Recall F‐Measure
D 65.07 63.76 64.41
K 63.89 62.16 63.01
E 67.11 66.23 66.67
B 63.38 60.81 62.07
In addition to the evaluation of the baseline models, the paper aims to answer how SCLL models
trained with the selection of training sample from translated sentiment sources to be employed
together with the target data by SSL to successfully solve cross‐language analysis tasks. To do this,
we investigate the effect and importance of different sizes of selected samples for cross‐lingual
sentiment classification. Furthermore, experiments also investigate the integrated model to show the
importance of the exploitation of monolingual resources for cross‐lingual sentiment classification.
Table 4 shows the overall performance of the integrated model proposed in this study. Results
clearly indicate that the integrated learning model that combines SCLL and SSL and utilizes
monolingual resources substantially improves the overall performance over baseline models. Figure
3 show the performance (x‐axis) of an integrated supervised and semi‐supervised learning model
with different sizes of samples (y‐axis).
Table 4 show that the highest performance is obtained with the integrated model when sample
size is 4000 with f‐measure performances of 85.72%, 83.38%,83.04%, and 85.72% on Books B, DVDs
D, Electronics E, and Kitchen Appliances K respectively. These results are significantly better than
that of the best baseline models (voting ensemble classifier) with f‐measure performances of
62 64 66 68 70 72 74 76 78 D K E B Perf or m an ce( F1 ) Domains/Data sets NB ME LR VOTING
76.54%,75%, 73.42%, and 76.92% on Books B, DVDs D, Electronics E, and Kitchen Appliances K
respectively.
Based on the statistical results shown in Tables 2–4, it can be validated that the optimal selection
of resources and the appropriate integration of SCLL and SSL significantly improve the performance
of cross‐lingual sentiment analysis.
Table 4. Results (F‐Measure) of Integrated Model with different sizes of selected samples.
Size of Sample B D E K 1000 80.95 78.42 79.15 80.95 1500 82.36 80.24 81.66 82.36 2000 82.7 80.24 82.36 82.7 2500 83.39 80.95 80.24 83.39 3000 84.39 82.01 83.04 84.39 3500 85.39 83.04 84.06 85.39 4000 85.72 83.38 83.04 85.72 4500 82.95 78.42 81.79 80.16 5000 81.31 78.79 80.24 80.24 5500 80.24 77.68 79.16 78.05
Figure 3. Performance (x‐axis) of integrated supervised and semi‐supervised learning models with different sizes of samples (y‐axis).
6. Conclusions
A study on cross‐lingual sentiment analysis using integrated supervised and semi‐supervised
models is presented in this paper. The aim is to show that SCLL models trained with selected training
sample from translated sentiment sources can be integrated together with the target data by SSL to
successfully solve cross‐language analysis tasks. We designed and developed a clustering‐based
sample selection approach and a target‐based feature selection to select the optimal and
representative training samples and features that are suitable for the target data. Several experiments
are conducted to evaluate standalone supervised or semi‐supervised Cross‐Lingual Learning
sentiment analysis as well as the proposed model. Results show that SCLL trained with large
translated data from the source language is superior to the SSL with seed from the target language.
Experimental results also indicated that the proposed integrated models (supervised and semi‐
supervised models) are much more accurate than standalone supervised or semi‐supervised machine
learning approaches. In addition, our work showed that the majority voting method has a stable
77 78 79 80 81 82 83 84 85 86 87 1000 1500 2000 2500 3000 3500 4000 4500 5000 5500 Performance (F1) Sample Size B D E K