S u re, speed matters, but it’s
not a one-dimensional
p roblem. And, despite what
you’ve heard, just adding
m o re bandwidth doesn’t
always make things go
f a s t e r.
I
s there an Internet performance problem? There are two views: The conventional wis-dom held by ’Net insiders is that things are just fine. They point to the massive invest-ment in bandwidth that has eliminated many con-gestion problems, and to the performance of the Keynote Business-40 Index, which has fallen from more than 12 seconds to less than 3 seconds in only four years.The other view is held by the vast majority of Internet users, who complain that the Web is an awfully slow way to do anything useful. To be sure, most connections are slow; no matter whose numbers you use, anywhere from 78 percent to 93 percent of the users in the U.S. use a dial-up modem to connect to the Internet. And most con-nections actually are at speeds closer to 30 kbps. Furthermore, most real users and network shoppers don’t visit the Keynote Business-40 sites. Instead, they visit sites like MSN, A O L , Amazon, ICQ, ESPN and Disney, which are designed to be “interesting and cool” rather than optimized for performance; these sites are slow by design. In short, geography, demographics and interest all play important roles in determining what the “Internet experience” will be like.
The Gomez report, “Performance Metrics in Context” (www.gomez.com), describes these e ffects: Only 47 percent of ecommerce users sur-veyed are satisfied with the speed of the We b .
Indeed, speed is always among the top five reasons for selecting an on-line service for a busi-ness transaction or abandoning a shopping cart. But the need for speed is relative to the type of site being visited (brokerage, shopping, travel) and the type of function being performed (browsing, buy-ing, getting a confirmation).
These findings aren’t limited to the consumer market. Since 1997, analyst and author Rebecca
Wetzel ([email protected]) has been survey-ing enterprises about what they think of their Internet service provider. Her latest survey shows that while performance is the second highest attribute out of 12 (after reliability) they desire from an access provider, it is third from the b o
t-t o m in t-the service sat-tisfact-tion rat-ting.
There is a wide range of acceptable response times depending on the activity, its criticality, etc. But all points along the range of acceptable speeds are trending down. Ye s t e r d a y ’s “fast” is considered “slow” today.
How Applications Work On A Network
The World Wide Web is a complex system of ser-vices that operate on top of the Internet, a sepa-rate, complex system of connectivity and trans-port. But despite all the complexity, the interac-tion and behavior of the transacinterac-tions between a client (browser) and server (website) is very con-sistent. Page-load time—from the click on a URL to the point at which the page is completely dis-played on the destination PC—is a process that can be boiled down to two functions: discovery and transfer.
■D i s c ove ry : A user starts the process by
instructing his/her browser to open a connection to a destination known by a Universal Record Locator—a URL. URLs are convenient names or handles people give to piles of information or some specific data. The browser must first ask a local Domain Name Server (DNS) to resolve the U R L name into an IP address. After the DNS sys-tem replies with a specific IP address for the URL, the browser opens a Transmission Control Proto-col (TCP) connection to that address.
The process by which the connection is opened is called a three-way handshake—three packets of information and sequence numbers are exchanged. Once the connection is established, the browser sends a HTTP “Get” command, ask-ing for the content of the URL. The server replies with a base page, which is a description of what the Web page will look like when loaded on the screen along with a list of elements (more URLs) to fill the screen. Then the browser sends a “Get” for each element, one at a time.
So far, the browser has been “discovering” where to go to get the content and how to proceed on actually calling for the content. Each of the
Peter Sevcik is p resident of N e t Fo recast in A n d ove r, M A , and a B C R columnist. He can be re a ched at p e t e r @ n e t fo re c a s t . c o m . John Bartlett is a p rincipal at N e t Fo re c a s t , and he can be re a ched at j o h n @ n e t fo re c a s t . c o m .
Understanding We b
P e rf o rm a n c e
Peter Sevcik and John Bartlett
exchanges described above requires processing by the client (desktop PC) and one or more servers on the Internet. Each exchange also requires that at least one packet go from the client to a server with at least one packet coming back in reply. Getting a Web page is truly a process of discovery, which has just begun.
Conventions and specifications on how the Web operates force a few more discoveries to o c c u r. Each element that must be retrieved from a website requires a separate T C P connection along with, potentially, a new DNS address resolution process. (The attribute “persistent TCP” in HTTP version 1.1 reduces the need for some of the T C P opens, but its effectiveness is limited and some-times counterproductive.) It is very likely that the browser will be told to get some of the content from other servers that are not even associated with the base Web page, such as banner ads. In a typical scenario, the website sends the browser to DoubleClick, which will exchange cookie data to figure out which ad this user should see at this time, and then a URL is sent directing the brows-er to yet anothbrows-er sbrows-ervbrows-er to receive the ad.
All the exchanges described above can be grouped into a number we call “turns.” A turn is a non-content carrying exchange of packets between client and server that requires a round-trip over the network. More specifically, it is a count of each time communications changes direction among these discovery packets. T C P -level acknowledgements (ACKs) are not counted as turns. A turn is limited to the ping-pong packets that do not move any user visible content.
Think of the number of times you have to swing your head back and forth if you are watch-ing a tennis match from a seat near the net. Now think of the number of times the objective – scor-ing a point – occurred. The ratio of head turns to total points in the match may make for an inter-esting game, but they are a sure indication of how long the game will take. Some tennis matches take hours to end! Some websites take long to load for the same reason.
Turns add up. Turns take time. They are a direct byproduct of the quest to make the We b simple to build and highly scalable.
■Tra n s fe r : Once the browser finishes the
dis-covery process for each element, it starts the trans-fer process of moving the content (text, graphic, photograph, etc.) to the desktop. The transfer is performed by T C P using standard windowing and acknowledgement procedures coded into the client and server operating system.
T C P is a transfer protocol that is controlled by the receiver. Since the overwhelming ratio of con-tent to be moved is from server to client, it is the client that governs how fast things will move. T h e client advertises a window size in bytes that it is prepared to receive from the server. Once some or all of the window is successfully received, the client acknowledges and updates the window with
a new byte count. If all goes well, the content never stops arriving; the client acknowledges fast enough and the server keeps the connection or “pipe” full. In theory, the transfer should operate at the speed of the slowest link in the system less the overhead of protocol headers.
But things hardly ever go that well. There are often delays in updating the window. The server often waits to get an acknowledgement. If a pack-et is lost, a rpack-etransmission has to occur. T C P a l s o uses a mechanism called “slow-start” to help man-age congestion. Since most Web elements are small enough to fit into one or two packets, the system is always operating in the start-up (slow) phase of the cycle.
The bottom line is that transfer takes time, and the throughput is not nearly that of the slowest link in the system.
Application Profiles
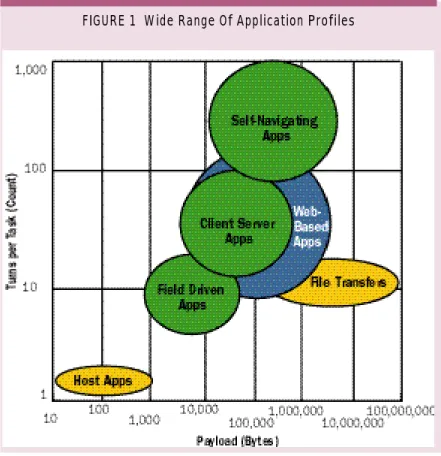
Any transactional application—the Web is transac-tional—can be characterized by payload size and turn count. This article does not cover non-transac-tional applications like voice and video. We call the payload and turn data an “application profile.” Fundamental performance over a network can be derived from only these two numbers.
Figure 1 shows the wide range of payload and turns from our library of more than fifty applica-tions. Each circle in the figure encompasses the profiles of the most common user tasks for each application. They are grouped by major applica-tion genre.
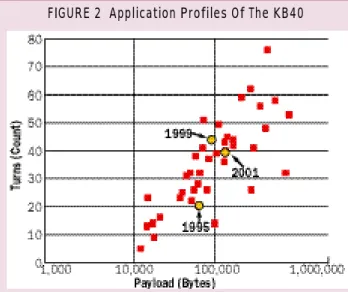
Our first significant study of Web traffic and its application profile was performed in 1995, when we watched 20,000 users at a single large compa-ny attack the Web with gusto. In 1995, the typical business Web home page had a profile of 50,000 bytes payload and 20 turns. Using the Keynote Business-40 (KB40) as a representative sample of business sites, the current average KB40 profile is 115,000 bytes payload and 40 turns. Figure 2 shows the application profile of each site in the KB40 along with the average composite profiles for three summers where we gathered significant data on business sites.
We noticed that during this summer, 10 sites in the KB40 were consistently ranked by Keynote as one of the top 10 performing sites for that week. It is interesting to see that the average profile for those 10 sites is 24 turns and 65,000 bytes of pay-load—half of the profile for the remaining 30 KB40 sites. Clearly a good application profile is a good step in making a site perform fast.
Figure 2 also indicates the trends in business-oriented website profiles. Payload has been climb-ing steadily—the compound annual growth rate from 1995 to 1999 was 13 percent, and from 1999 to 2001 it accelerated to 19 percent.
More alarming growth occurred in turns from 1995 to 1999, where the annual growth rate was 22 percent, but the turn count appears to have peaked in 2000, and it has since fallen consider-a b l y. The overconsider-all chconsider-ange in turns from 1999 to 2001 was a decline of 4 percent. It appears that Web managers at these sites, who are under the Keynote microscope, have finally realized that simplifying the Web page and thus reducing turn count is to their benefit.
Predicting Performance
We have developed a useful formula for predict-ing the performance of an application across the Internet. This formula was developed by analyz-ing the behavior of the protocols, as well as by extensive comparison with real data from real
net-works. The formula predicts the time necessary to bring payload across the network, including the overhead of the protocols involved (TCP o p e n , DNS look-up, etc).
Once the data has arrived, additional time is required to render the information in a useful mat on the computer screen for the user. The for-mula does not account for this necessary render-ing time, only the time needed to brrender-ing in the pay-load itself. This formula also assumes that the server has the content being requested, and mere-ly has to retrieve and send it. If the server is required to do an extensive database search before responding, this additional time needs to be added to this equation.
There are two parts of the performance equa-tion, representing the two components of delay in retrieving data through the Internet. T h e d i s c ove ry
c o m p o n e n t accounts for the client/server
interac-tions required to set up the payload transfer. T h e
t ra n s fer component accounts for the time it takes
to move the payload bytes across the network.
■Pa rt 1—Discove ry (Accounting for Tu rn s ) :
This term accounts for the delay incurred as the client and server set up the payload transfer, dri-ven by the number of application turns. T h e s e turns include DNS lookups, T C P opens, HTTP Gets and other protocol interactions that are nec-essary to find the server, open the connection and establish which piece of data is required. Since these application turns typically use very small packets, their network performance is limited by round trip delay. This portion of the total time is represented by:
D i s c ove ry Time = 2(D+L+C)+(D+C/2) ( ( T- 2 ) / M ) + D L n ( ( T- 2 ) / M + 1 )
The multiplexing factor M represents the abili-ty of some applications or browsers to multi-thread or initiate more than one transfer simultaneously. While current browsers are set to a multiplexing factor of four, actual measurements show that such e fficiency is rarely achieved; most browser/We b page combinations operate at three threads.
The 2(D+L+C) at the beginning of the equa-tion represents two round-trip delays, one for the T C P Open and one for the HTTP Get. These two interactions must take place sequentially to get the base Web page and discover how many elements need to be fetched. Once these two interactions are complete, the remaining components are sub-ject to the multiplexing factor.
■Pa rt 2—Tra n s fer (Moving the Pay l o a d ) :
Payload transfer is limited either by the connec-tion speed, or by the combinaconnec-tion of window size and round-trip delay. Whichever is greater deter-mines the transfer time. The equation calculates both times, and then chooses the larger value for this portion of the equation. This portion of the overall calculation is:
Payload Time = max(8P(1+OHD)/B, D P / W ) / ( 1 - s q rt ( L ) )
The max function chooses either line delay or window delay in the numerator of the equation.
Note that overhead is added to the payload. Over-head is a percentage that accounts for HTTP, T C P and Level 2 bytes that are added to the actual pay-load to move it through the network. If 10 percent additional bytes are required to move the payload, OHD would be set to 0.1 as is the current situation on the We b .
The window size and round-trip delay aff e c t the payload transfer, because the server is only allowed to send a window’s worth of data before receiving back an acknowledgement from the client that the data was received. The acknowl-edgement time is limited by the round-trip delay of the connection. Although the window size is usually at least 8 Kbytes, T C P is required to send an acknowledgement after two full-size packets are received. Empirical evidence shows that set-ting the window size to match two full-size pack-ets (3 Kbytes) works well.
One more factor comes into play: packet loss. Each loss of a packet causes an inefficiency in the T C P interaction, slowing the transfer. The denom-inator of the equation models this slowdown.
■Total Response Ti m e : The total response time
is the sum of the two sections above, discovery and transfer. (See “The Complete Formula.”) A n Excel spreadsheet with the full equation can be found on the NetForecast website, at www. n e t-forecast.com.
The equation makes the simplifying assump-tion that the server payload is much larger than the client payload, as is the case for Web pages. Clear-l y, cClear-lient payClear-load must be accounted for in situa-tions where client payload dominates, such as Web publishing or on-line backup.
The bandwidth value in these equations is the bandwidth of the slowest link in the network
Window size,
round-trip delay
and packet loss
all affect
transfer time
between server and client. This is typically the access line from the service provider to the enter-prise or home.
L a s t l y, the mux factor must be set to match the behavior of the client or browser. As has been noted, current browsers achieve an effective mux of three. However, transaction-processing applica-tions, ftp transfers and most older applications are single-threaded, and so will require that the mux be set to one.
Measuring Web Performance
We used detailed measurement data of the top 10 performing sites in the KB40 to verify the accura-cy of the formula shown above. This also gave us
R = 2(D+L+C)+(D+C/2)((T- 2 ) / M ) + D l n ( ( T- 2 ) / M + 1 ) + m a x ( 8 P ( 1 + O H D ) /
B, D P / W ) / ( 1 - s q rt ( L ) )
B = Min line speed (bits per second) C = Cc + Cs
Cc = Client processing time (seconds) Cs = Server processing time (seconds) D = Round trip delay (seconds) L = Packet loss (fraction) M = multiplexing factor OHD = Overhead (fraction) P = Payload (bytes)
R = Response Time (seconds) T = application turns (count) W = Window size (bytes)
©NetForecast Inc.
The Complete Form u l a
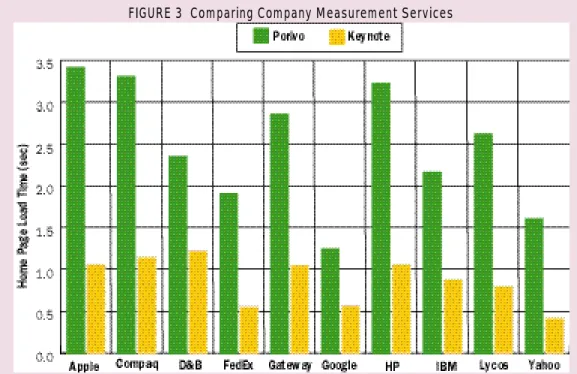
FIGURE 3 Comparing Company Measurement Servicesthe opportunity to compare the techniques of two leading Web measurement services, Keynote and Porivo. (See “How Did We Get The Data?”
Keynote tests the Keynote Business-40 each day of the workweek, every 15 minutes, from each of its testing agents. These tests are then averaged together and sorted by page-load time. The top 10, those websites with the highest per-formance (fastest page-load times), are listed on their website each week, showing the site name and the average time to load that Web page. Keynote also indicates how many weeks this site has been in the top 10.
We asked Porivo to test the fastest 10 of the Keynote Business-40, over a four-week period in July and August of 2001. Porivo activated its agents, which are installed in user desktops across the nation. These agents then tested the download speed of the target websites every 15 minutes throughout the workweek. The average download speed of each site, per week, was then calculated from the results.
Keynote and Porivo have different testing approaches, and can be expected to deliver slight-ly different results. We have compiled data here for four weeks in August from each service, and Figure 3 (p. 31) shows the results. In looking at that figure, however, two quite different answers e m e rge to the same question: How fast does this page download? Is this the same Internet?
L e t ’s work with the formula proposed above to recreate these numbers. The variables we have to play with are bandwidth, client-processing time, round-trip delay, packet loss and the multiplexing factor. The We b page profile and server parame-ters are constant across both mea-surement services.
Table 1 shows the result of poking at the formula variables until it properly recreates the results shown in Figure 1 above. Here is why we believe these parameter changes make sense.
Keynote and
Porivo have
different testing
approaches
First on the list is access line rate. We focused the data taken from Porivo on users with broad-band access, but “broadbroad-band” often means a speed above 384 kbps, about one-fourth of a T1. But Keynote has high-speed access—45 Mbps T 3 — from its datacenter locations. For most websites, the delay caused by payload transiting a T1 link will not be a decisive factor, but it may make a dif-ference for low latency connections.
Because real user desktops are further from the Internet core and on slower lines, they also exhib-it higher packet loss percentages. A prime spot for packet loss is at the boundary between the core and the user’s access ISP. This additional loss slows the transfer, as explained above.
T h i r d l y, round-trip delay is lower for Keynote than for most end users. Keynote has its test agents set up at datacenters around the country, where they are directly tied to backbone providers. They are never far, in Internet delay, from the big carrier that will take them to the web-site being tested. End users, on the other hand, are on the other end of an access link or even an access ISP, which causes additional delay. We have broken down the delay in Table 1 to show both the backbone portion and the access link por-tion to demonstrate this diff e r e n c e .
Multiplexing also comes into play when a test-ing service emulates the browser behavior. If the test agent behaves exactly like a browser, it uses only three connections at a time and, typically, downloads only two objects at a time. T h e Keynote agents, once they parse the base page, fetch as many objects simultaneously as possible. This tests the performance of the Internet, but does not necessarily match the user experience of opening that page.
L a s t l y, client processing follows much the same argument as multiplexing. Because Keynote uses a dedicated, powerful server for its testing agent, it is likely to have much shorter client-pro-cessing times than a user desktop. The desktop is running a non-real time operating system and may be doing other tasks concurrently. Increasing the
Keynote Porivo
Line Rate 45 Mbps 1.5 Mbps Loss 0.1 % 5% RTT Backbone 21 msec 21 msec RTT Access 0 26 msec
M 6 3
Client Proc 12 msec 36 msec
TABLE 1 Variable Changes
K
eynote Systems (www. key n o t e. c o m ) :Keynote publishes a weekly list of the Keynote Business 40 performance on their website. They publish the top 10 sites (best performance) for each week. Keynote tests these sites every 15 minutes throughout the business day from their test agents. T h e s e agents are located in 25 cities, where they are connected to the Internet with T3 speeds or g r e a t e r. The KB40 websites are tested from each server, and the performance measurement they post is an aggregate of those values.
Po rivo Te ch n o l ogi e s ( w w w.porivo.com):
Porivo has thousands of clients that Internet
users have downloaded into their desktop computers. Porivo is then able to schedule the clients to run specific performance tests throughout the day. Porivo ran performance tests against the top 10 members of the KB40 for four weeks, from late July through mid August, using agents on T1 and cable access lines. We imported this data into a Microsoft Access database, and then sorted and averaged the numbers to generate the Porivo results. Note that because the Porivo client is running on a user desktop, it will be affected by local proxy and caching servers. It will not, however, take advantage of browser caches
server and client computing times to zero. A perfect network is one that has no latency and no packet loss.
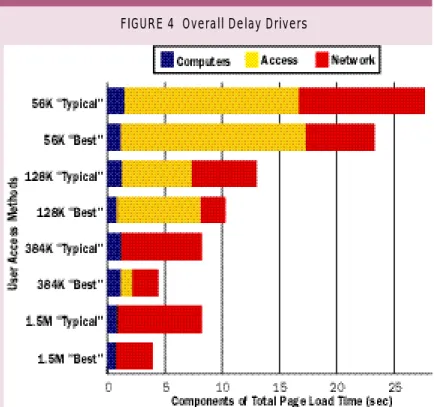
Each recalculation gave an equal or better result than the base case. An equal result indi-cates that the change to the parameter made no change to the total response time. We then apportion the improvements to the base case (Figure 4).
Note that access bandwidth improves things dramatically as you go from 56 kbps to 384 kbps, but then the effect goes away
com-p l e t e ly by 1.5 Mbcom-ps. The reason there is still some
minor benefit for the 384-kbps “Best Case” user to buy more bandwidth is that his/her network per-formance is good enough to take advantage of the better speed. However, there is no advantage for either the Best Case or the Typical Case user to buy more than 1.5 Mbps. In fact, the point at which no more benefit occurs is at about 512 kbps.
As broadband access grows, the focus will have to shift to making network latency and loss commensurately lower. Packet loss can be addressed with proper engineering. However, latency is limited by the speed of light and the cir-cuitous routing that paths will always take in a network. The only sure way to improve perfo
r-mance below four seconds is to either move the s e rver closer to the user or to reduce the nu m b e r of turns in a Web page. There are many companies
that are addressing these approaches with a variety of performance-boosting products and services.
Implications Of The Data
C l e a r l y, there is a Web performance problem. Real world performance is 3–10 times slower than the client-processing value for Porivo makes sense in
this context.
Making the above parameter changes and feed-ing the equations with the profiles of the top 10 KB40 Web pages then yields numbers that close-ly match the empirical results shown in Figure 3.
What Contributes To Poor Performance
Given that the formula can match measured per-formance of 10 different sites using two diff e r e n t measurement techniques, we are confident of its predictive capabilities across a wider range of alternatives. It is interesting to test the value of new technologies that are proposed to improve Web performance.
Here we use the overall KB40 average ( 115,000 byte payload and 40 turns) as a better indicator of a typical page, because the tests were clearly performed on a group of sites that have an unusually low payload and turn count. We also made a few changes to the Keynote parameter set-tings in order to make it a more realistic represen-tation of a very well-connected user that we call the “Best Case” as shown in Table 2. The Porivo parameters are essentially unchanged, becoming the “Typical Case.” In addition, we had to create a new RT T for dial-up users that accounts for the 100 msec latency penalty of a dial-up modem.
The results indicate that a Best Case broadband user will see the typical Web page load in four sec-onds, while the more Typical Case broadband user will likely experience a load in eight seconds. T h i s range is in line with our experience.
Now that the real performance model is under-stood, we can vary any parameter in order to see the effect. The most logical investigation is to study the effect bandwidth has on response time. Figure 4 shows the dramatic effect to response time when bandwidth is much slower than 1.5 Mbps. The majority of Internet users see a typical page load in more than 20 seconds, a vast diff e r-ence from the Best Case broadband user.
H o w e v e r, it is also interesting to make some of the elements of delay go away. Figure 4 shows the components of delay for users in each of the band-width classes. In each case, we recalculate the for-mula as if the element under investigation were perfect. We replace the access line rate (band-width) with a Gigabit Ethernet pipe (1,000 Mbps). In the case of the computers, we drove both the
Beyond 512 kbps,
there’s no
performance
advantage in
buying more
access bandwidth
Best Case Typical Case
Line Rate 1.5 Mbps 1.5 Mbps
Loss 1% 5%
RTT (Backbone + Access) 55 msec 110 msec RTT for Modem Users 155 msec 210 msec
M 3 3
Response Time 3.9 sec 8.2 sec
TABLE 2 Realistic Performance Parameters
often-quoted Keynote Business-40 numbers; no users actually see the performance of the KB40.
During a meeting held here at NetForecast last year (May 2, 2000), we challenged the CEO of Keynote, Umang Gupta, with the observation that the KB40 index was shifting away from being a real measure of true performance. His reply was, "Our data is not intended for use as a measure of any specific user, and they should not be used for historic trend analysis since they change over time. The data is intended as a benchmark for comparison between websites at any given time." While Keynote is providing a very useful and interesting benchmarking service, they should remove “seconds” from the charts and simply call it an “Index” very much like the Dow Jones Indus-trial Index: Interesting but not relevant to daily life. We can think of only one group of users that sees performance approaching the level published by Keynote. They are connected with lightly-loaded T1 lines directly to a core ISP, have only the latest fastest desktops and spend most of their day checking on company credit ratings at Dunn and Bradstreet and chasing document shipments on FedEx; in other words, VCs.
These VCs who think the ’Net is just fine are thus making two very wrong bets: First, they over-invest in bandwidth plays (e.g., optical) while
u n d e r-investing in companies that make the ’Net run better (edge services). Second, they are sur-prised when the mass market (millions of users) does not show up for their dot-com investments. Maybe, just maybe, the fact that the basic We b page took about 20 seconds to download had something to do with it.
Porivo stands out as a reliably accurate source for realistic measurements of the true user experi-ence, largely because of two key factors: First, its agents are on real desktops that see the perfor-mance of the full path from the server. Second, it can tap the resourses of thousands of agents dis-tributed over demographic and geographic points that match the true Internet user population.
A lot still needs to be done to improve perfor-mance on the ’Net. We also need better methods of measuring performance, along with under-standing the impacts of poor performance. It will be interesting to watch the improvements emerg e that successfully tackle the real long-term culprits —payload, turn count and network latency
Clearly, there is a
Web performance
problem
Companies Mentioned In This A rt i cl e
Gomez (www. g o m e z . c o m )
Keynote Systems (www.keynote.com) Porivo Technologies (www. p o r i v o . c o m )