C .I. F . G : 59069740 U ni v er s it at R am on Ll ul l F undac ió R gt re. F und. G ener al it at de C at al un y a nú m . 472 ( 28 -02 -90)
Preference Disaggregation: Towards an Integrated Framework
Mohammad Ghaderi
http://hdl.handle.net/10803/404257
ADVERTIMENT. L'accés als continguts d'aquesta tesi doctoral i la seva utilització ha de respectar els drets de la persona autora. Pot ser utilitzada per a consulta o estudi personal, així com en activitats o materials d'investigació i docència en els termes establerts a l'art. 32 del Text Refós de la Llei de Propietat Intel·lectual (RDL 1/1996). Per altres utilitzacions es requereix l'autorització prèvia i expressa de la persona autora. En qualsevol cas, en la utilització dels seus continguts caldrà indicar de forma clara el nom i cognoms de la persona autora i el títol de la tesi doctoral. No s'autoritza la seva reproducció o altres formes d'explotació efectuades amb finalitats de lucre ni la seva comunicació pública des d'un lloc aliè al servei TDX. Tampoc s'autoritza la presentació del seu contingut en una finestra o marc aliè a TDX (framing). Aquesta reserva de drets afecta tant als continguts de la tesi com als seus resums i índexs.
ADVERTENCIA. El acceso a los contenidos de esta tesis doctoral y su utilización debe respetar los derechos de la persona autora. Puede ser utilizada para consulta o estudio personal, así como en actividades o materiales de investigación y docencia en los términos establecidos en el art. 32 del Texto Refundido de la Ley de Propiedad Intelectual (RDL 1/1996). Para otros usos se requiere la autorización previa y expresa de la persona autora. En cualquier caso, en la utilización de sus contenidos se deberá indicar de forma clara el nombre y apellidos de la persona autora y el título de la tesis doctoral. No se autoriza su reproducción u otras formas de explotación efectuadas con fines lucrativos ni su comunicación pública desde un sitio ajeno al servicio TDR. Tampoco se autoriza la presentación de su contenido en una ventana o marco ajeno a TDR (framing). Esta reserva de derechos afecta tanto al contenido de la tesis como a sus resúmenes e índices.
WARNING. The access to the contents of this doctoral thesis and its use must respect the rights of the author. It can be used for reference or private study, as well as research and learning activities or materials in the terms established by the 32nd article of the Spanish Consolidated Copyright Act (RDL 1/1996). Express and
DOCTORAL THESIS
Title
Preference Disaggregation:
Towards an Integrated Framework
Presented by
Mohammad Ghaderi
Centre
ESADE Business School
Department
Marketing Management, Operations Management
and Innovation and Information Systems Management
Directed by
Dr. Núria Agell
Dr. Francisco Ruiz
C .I.F .G : 59069740 U ni ve rsita t R amon L lul lF unda ció R gtr e. F und. Ge ne ral ita t de C atal un ya n úm . 472 (28-02-90)Acknowledgments
First and foremost I must acknowledge my supervisor, Dr. Núria Agell, for the extensive support that she generously provided me during these years. You have not only been a great encouraging and knowledgeable academic supervisor, but also a wonderful friend that I could always come to whenever I needed to talk about anything. I am grateful for all the trust that you put in my capabilities, and always inspiring me to follow my ambitions. They say, PhD life is a heavily stressful one; I would like to add: unless you have a wonderful supervisor.
I would like to express my deep appreciation to my co-supervisor, Dr. Francisco Ruiz for his academic supports and guidances. I am grateful to the enormous support from Pilar Gállego, ESADE PhD programme manager, and Cristina Costa from Ramon Llull University. Your kind support and constant availability for helping me with even my non-academic paperworks has been so heartwarming. I am thankful to Professors Juan Manuel Batista, Jatinder Singh, Ioana Schiopu, Cecilio Angulo, Skander Esseghaier, Xari Rovira, and everyone whom I had the chance to work closely with during these years at ESADE. I am thankful to Professor Roman Słowiński for his warm hospitality during my stay at Laboratory of Intelligent Decision Support Systems at Poznan, and to Milosz Kadziński for his time and helpful comments on my works.
My special thanks to my family for their emotional support and encouragement. Thank you to my friends Alexander, Mehdi, Germán, Stefan, Menna, Albert, Amer, Julia, Saadi, Joonho, Solange, and all my colleagues from PhD programme. I acknowledge the financial support received from the Secretaria d’Universitats i Recerca del Departament d’Economia i Coneixement de la Generalitat de Catalunya and by European Social Funds (2014FI_B - 00637, 2015FI_B1 - 00105, 2016FI_B2 - 00058).
Thank you to my students. You taught me that high expectations and powerful relationships co-exist. You helped me understand that teaching is about more than great lesson planning and content. Teaching is about consistency and purpose ... and fun!
Abstract
Preference disaggregation aims at capturing preference models by decomposing
indirect preference information that are in form of holistic choices or judgments.
From a multiple criteria decision aiding perspective, such information is taken as
input to an inference procedure that yields to a preference model based on all the,
usually conflicting, points of view that together form a basis for the judgments.
Studying human judgments and choices has received increasing attention in the
last few years from several disciplines, including behavioral science (decision
anal-ysis, preference disaggregation), artificial intelligence (preference learning), and
economics and marketing (choice modeling). The three streams, although
orig-inated from different philosophies, are converging rapidly to a comprehensive
understanding of human preferences, that is the main element of decisions and
actions. This doctoral dissertation sheds light on this phenomenon by introducing
an integrated analytical framework that allows capturing preferences of a complex
form by observing holistic choices, decisions, and judgments.
Contents
1 Introduction 1
1.1 Objective of the Thesis . . . 2
1.2 Overarching Theoretical Framework . . . 3
1.3 Main Research Problems and Contributions . . . 9
1.4 Structure of the Thesis . . . 11
1.5 Main outputs of the Thesis . . . 12
2 Understanding the Impact of Brand Colour on Brand Image 15 2.1 Introduction . . . 16
2.2 Colour coordinates and colour spaces . . . 18
2.3 Preference disaggregation methodologies . . . 19
2.4 Proposed methodology . . . 24
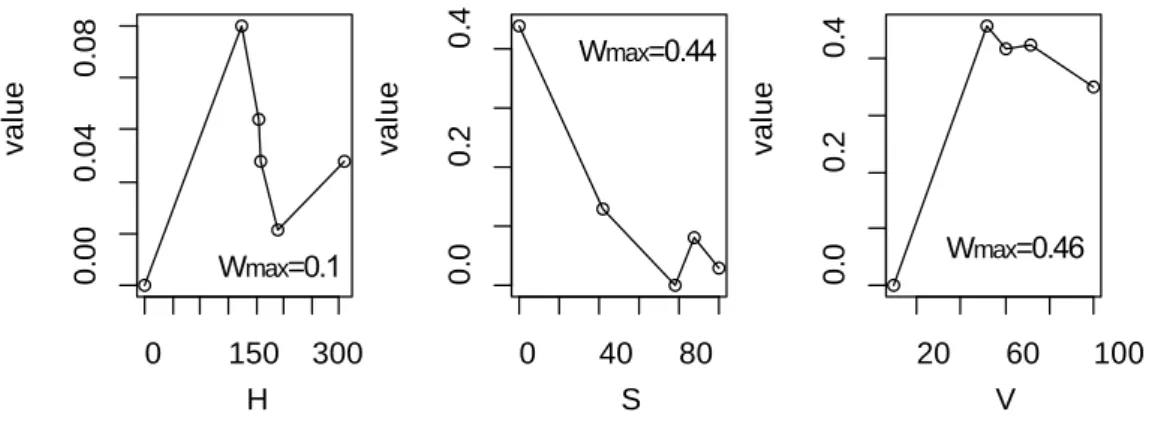
2.5 Brand colour and Brand Image . . . 35
2.6 Conclusion and future work . . . 40
3 A Linear Programming Approach for Learning Non-Monotonic Addi-tive Value Functions in Multiple Criteria Decision Aiding 43 3.1 Introduction . . . 44
3.2 Reminder on Preference Disaggregation . . . 48
3.3 Proposed Methodology . . . 52
3.4 Experimental Analysis . . . 69
3.5 An Extension of the Proposed Methodology . . . 75
4 Expressiveness and robustness measures for the evaluation of an ad-ditive value function in multiple criteria preference disaggregation
methods 81
4.1 Introduction . . . 82 4.2 Reminder on Preference Disaggregation Value-based Methods . . . 86 4.3 Selecting Characteristic Points for Marginal Value Functions . . . 89 4.4 Assessing Expressiveness and Robustness in Preference Disaggregation
Value-based Methods . . . 96 4.5 Results . . . 100 4.6 Conclusions . . . 124 4.7 Appendix: Results of the Statistical Comparison of the Impact of Methods for
Selection of the Characteristic Points on the Expressiveness and Robustness Measures . . . 128
5 Conclusion and Future Research 129
5.1 Implications for Theory . . . 130 5.2 Implications for Practitioners . . . 131 5.3 Discussion, Limitations and Future Research . . . 132
List of Figures
2.2.1 RGB (a) and HSV (b) coordinates . . . 19 2.4.1 Proposed Method Flowchart . . . 34 2.4.2 Assumed value functions for the illustrative example of car characteristics . . . 34 2.4.3 Extracted value functions for the proposed method in the illustrative example
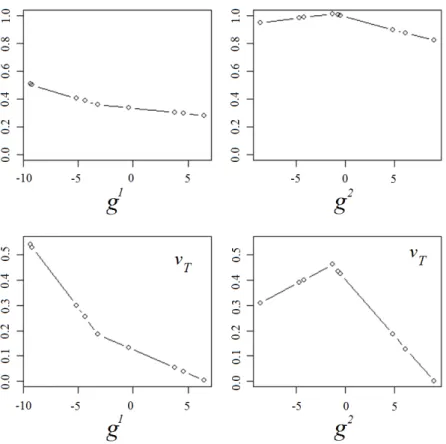
of car characteristics . . . 35 2.4.4 Extracted value functions by UTA-MN method in the illustrative example . . . 35 2.5.1 Value functions for the item fun . . . 38 2.5.2 Colour map of the brand image attributes . . . 42 3.3.1 Pairwise comparisons of the hypothetical alternatives . . . 59 3.3.2 Inferred marginal value functions before transformation (top row) and after
transformation (bottom row) . . . 63 3.3.3 Estimated marginal value functions in (Despotis and Zopounidis 1995) . . . . 65 3.3.4 Estimated marginal value functions by UTA-NM . . . 65 3.3.5 Estimated marginal value functions by the proposed methodology . . . 65 3.3.6 Comprehensive values versus ranking of alternatives obtained by each of the
three methdologies . . . 66 3.3.7 Change of slope angle at a breakpoint . . . 67 3.3.8 Range of admissibleθ2for differentθ1values andγ =1 . . . 68 3.3.9 The role ofγin tolerance: greaterγvalues provide wider tolerance ranges . . . 68 3.3.10Upper bound of|θ1−θ2|for differentγmj values . . . 69
3.4.1 The impact of numbers of alternatives (N), criteria (M), pairwise comparisons (p), and degree of polynomials employed to simulate DM preferences (D) on
3.4.2 The effect ofponMCdiminishes by increasingM . . . 74 3.4.3 Average value of standardizedγandMCversus different degrees of
polynomi-als employed to simulate DM preferences . . . 74 3.5.1 The inferred value functions using the LFP model (top), and extended method
withw=0.8(middle) andw=0.9(bottom) . . . . 77
3.5.2 Ranking of alternatives obtained by the LFP model (left), the extended model withw=0.8(middle), andw=0.9(right) . . . 77 4.3.1 Marginal value functions forg1,g2,g3, andg4; different colors (see online
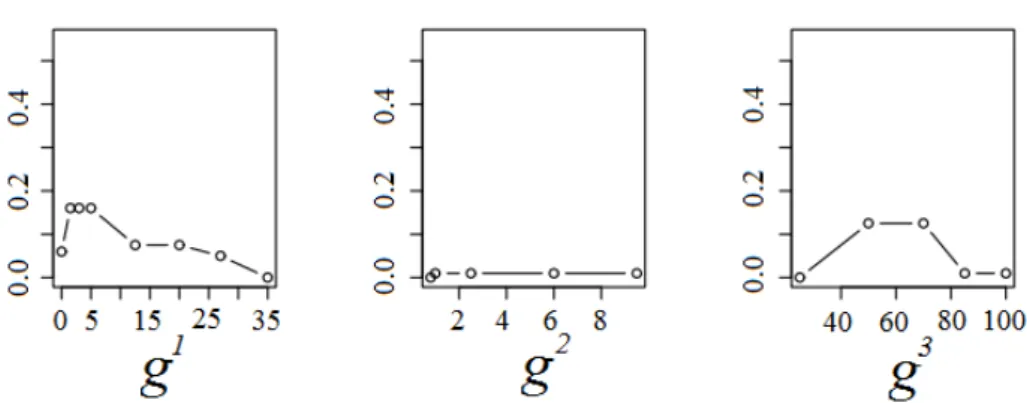
ver-sion) and markers represent five methods for selection of the characteristic points: blue (circle) – EWB; green (triangle down) – EFB, red (square) – KMC; azure (pentagon) – KDE; purple (cross) – SSP. Gray vertical lines represent performances of alternatives; extreme points of the black horizontal lines represent the performances of reference alternatives compared pairwise by the DM. . . 94 4.5.1 The percentage %(U ̸= ∅) of randomly generated decision situations for
which the pairwise comparisons provided by the DM are fully consistent with an assumed preference model, for different numbers of alternatives, crite-ria, pairwise comparisons, and types of performance distribution. The series represent different shapes of marginal value function with the characteristic points selected with EWB: blue (X marker) – linear functions (2 characteristic points), green (triangle) – 3 ch.p., red (square) – 4 ch.p., azure (pentagon) – 5 ch.p., purple (hexagon) – 6 ch.p., yellow (circle) – general. . . 102 4.5.2 The minimal difference ε∗ between comprehensive values of reference
alter-natives related by a strict preference by the DM, for different numbers of alternatives, criteria, pairwise comparisons, and types of performance distribu-tion. The series represent different shapes of marginal value functions with the characteristic points selected with EWB: blue (X marker) – linear functions (2 characteristic points), green (triangle) – 3 ch.p., red (square) – 4 ch.p., azure (pentagon) – 5 ch.p., purple (hexagon) – 6 ch.p., yellow (circle) – general. . . . 104
4.5.3 The average number|%N |of pairs related by the necessary preference for
dif-ferent numbers of alternatives, criteria, pairwise comparisons, and types of per-formance distribution. The series represent different shapes of marginal value function with the characteristic points selected with EWB: blue (X marker) – linear functions (2 characteristic points), green (triangle) – 3 ch.p., red (square) – 4 ch.p., azure (pentagon) – 5 ch.p., purple (hexagon) – 6 ch.p., yellow (circle) – general. . . 107 4.5.4 The average number | %N
I | of necessary inferences which do not directly
follow the provided preference information, for different numbers of alterna-tives, criteria, pairwise comparisons, and types of performance distribution. The series represent different shapes of marginal value functions with the char-acteristic points selected with EWB: blue (X marker) – linear functions (2 characteristic points), green (triangle) – 3 ch.p., red (square) – 4 ch.p., azure (pentagon) – 5 ch.p., purple (hexagon) – 6 ch.p., yellow (circle) – general. . . . 109 4.5.5 The percentage %(U ̸= ∅) of randomly generated decision situations for
which the pairwise comparisons provided by the DM are fully consistent with an assumed preference model, for different numbers of alternatives, criteria, pairwise comparisons, characteristic points, and types of performance distribu-tion. The series represent different types of methods for selecting the charac-teristic points: blue (X marker) – EFB; green (triangle) – EWB; red (square) – SSP; azure (pentagon) – KDE; purple (hexagon) – KMC. For clarity, the
minimum value on y-axis has been set to25%. . . 115
4.5.6 The minimal difference ε∗ between comprehensive values of reference
alter-natives related by a strict preference by the DM, for different numbers of alternatives, criteria, pairwise comparisons, characteristic points, and types of performance distribution. The series represent different types of methods for selecting the characteristic points: blue (X marker) – EFB; green (triangle) – EWB; red (square) – SSP; azure (pentagon) – KDE; purple (hexagon) –
4.5.7 The average number of inferred necessary preference relations| %N
I | which
do not directly follow the provided preference information, for different num-bers of alternatives, criteria, pairwise comparisons, characteristic points, and types of performance distribution. The series represent different types of methods for selecting the characteristic points: blue (X marker) – EFB; green (triangle) – EWB; red (square) – SSP; azure (pentagon) – KDE; pur-ple (hexagon) – KMC. . . 119 4.5.8 The average values of%(U ̸=∅),ε∗,|%N |, and|%N
I |for different
discretiza-tion methods. Series represent different numbers of characteristic points: blue –3characteristic points (ch.p.); green –4ch.p.; red –5ch.p.; azure –6ch.p. . . 121 4.5.9 Mean plots of%(U ̸=∅),ε∗and|%N
I |for different discretization methods in
poor preference information setting. . . 123 4.5.10Mean plots of%(U ̸=∅),ε∗and|%N
I |for different discretization methods in
List of Tables
1.5.1 This table shows the central chapters of the thesis and the journals they are
published in. . . 13
1.5.2 This table shows the conferences in which elements of this dissertation have been presented. . . 13
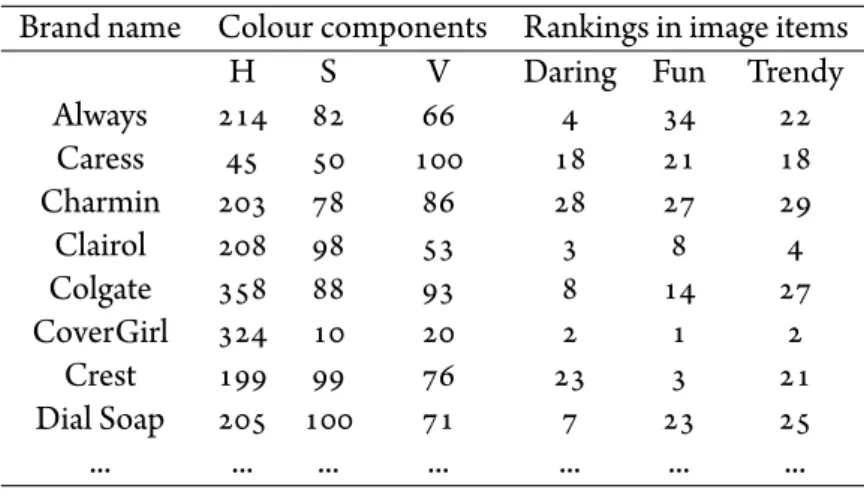
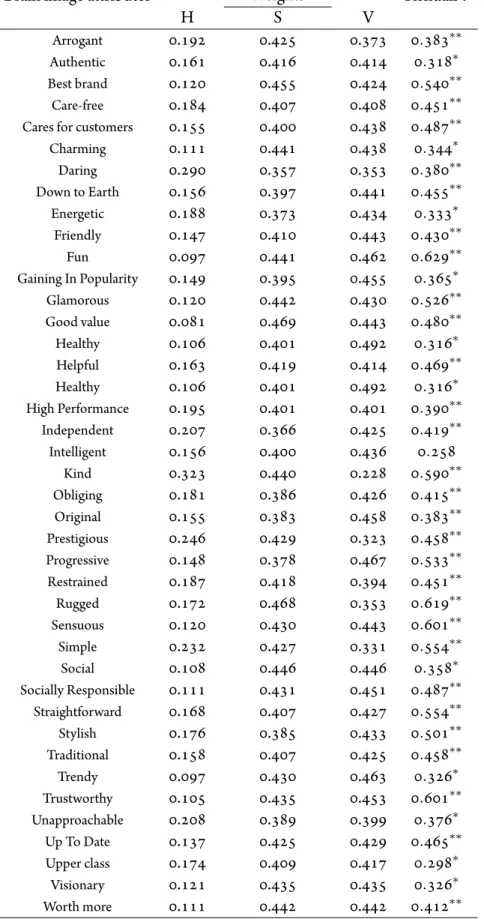
2.5.1 Brand colour components and rankings with respect to brand image items . . . 37
2.5.2 Extracted weights of the colour components and Kendallτof the reproduced ranking (single star means significant at0.01and double star means significant at0.001) . . . 41
3.3.1 Randomly generated performances of10alternatives evaluated by2criteria . . 59
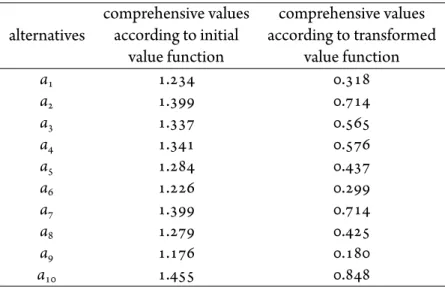
3.3.2 Estimated values for the decision variables related to the marginal value functions 62 3.3.3 Estimated comprehensive values for the alternatives . . . 62
3.3.4 Multicriteria evaluation of firms by the DM . . . 64
3.4.1 Different decision problem settings considered in the experiment . . . 70
3.4.2 Summaries of experimental results . . . 72
3.5.1 Results obtained by the LFP model (left column), the extended model with w=0.8(middle column), andw=0.9(right column) . . . 78
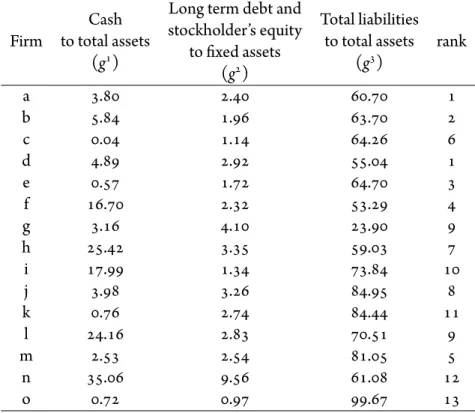
4.3.1 Randomly generated performances for14alternatives evaluated in terms of4 criteria. . . 95
4.5.1 Results of a hierarchical regression analysis for the low level of “model flexibil-ity” (m- number of criteria, γj- number of characteristic points,n - number of alternatives,r- number of pairwise comparisons; an empty cell means indi-cates “no impact”). . . 111 4.5.2 Results of a hierarchical regression analysis for the high level of “model
flexibil-ity” (m- number of criteria, γj- number of characteristic points,n - number of alternatives,r- number of pairwise comparisons; an empty cell means indi-cates “no impact”). . . 112 4.5.3 Test of homogeneity of variances for the decision scenarios with poor
prefer-ence information. . . 122 4.5.4 Test of homogeneity of variances for the decision scenarios with rich
prefer-ence information. . . 124 4.7.1 p-values derived from the Wilcoxon signed-rank test for the comparison of
all pairs of procedures for selection of the characteristic points. The results concern different numbers of characteristic pointsγj ∈ {3,4,5,6}. p-values
greater than0.01are in bold. Ifp-value is less than a pre-defined significance level (e.g.,α = 0.01), the null hypothesis is rejected and we can deduce that the difference between a pair of compared methods is statistically significant. . . 128
As soon as questions of will or decision or reason or choice of action arise, human science is at a loss.
Noam Chomsky
1
Introduction
Alice is passionate about art and sun. She recently spent a week in Barcelona to enjoy the great art museums and warm sunny days that the city has to offer. During her trip, she stayed in a hotel near the beach. At the end of her trip, as she usually does, Alice writes online reviews about some of the places she has visited and the hotel that she was staying in. In her overall review of the hotel, which is the number of stars that she gives to the hotel, Alice considers several factors such as comfort and cleanness, ease of access to the central area, price, the staff friendliness, as well as her overall feelings and impression of the hotel. Her overall assessment of
the hotel can change by some, probably less visible, factors such as the music that she has heard in the lobby, the decoration and colors of the hotel, the ambiance of the restaurant in hotel, and several other factors that Alice may or may not be aware of, but they change her feelings about the hotel in a direct or indirect way. Alice evaluates other services and products in a similar manner. Alice is not the only person whose decisions and judgments are based on multiple evaluation criteria, but the same is true for all consumers in the marketplace.
When facing a decision situation such as choosing a product or a service amongst all the other available alternatives, consumers typically consider several criteria to evaluate the existing alternatives and to eventually make a final decision. Some of these criteria are visible to the consumer who directly takes them into account, whereas some others can operate in an indirect way and at a subconscious level. Whether direct or not, both types of criteria form the prefer-ences of the consumer which result in her final decision. Decomposing the holistic preferprefer-ences based on the evaluation criteria and understanding how each of these criteria contributes to the final decisions and choices made by the Decision Maker (DM) is critical in marketing and consumer behavior studies. This is the focus in preference disaggregation paradigm based on the Multiple Criteria Decision Aiding (MCDA) perspective.
1.1
Objective of the Thesis
Modeling of consumer preferences among multiattribute alternatives has been one of the ma-jor activities in consumer research (Green and Srinivasan 1978,1990;Gustafsson et al. 2013;
Rao et al. 2014). The main objective of this dissertation research is to develop techniques to
unfold the choices made by consumers in order to capture their preferences and predict their choices. Such techniques enhance our understanding of consumers preferences as the basis of their decisions, as well as the decision making strategies that they pursue to make a choice. This
dissertation is broadly motivated by two prevalent trends: developing efficient methodologies for processing preference information of realistic size, and the increasing need in marketing and branding contexts for analytical frameworks that enable us to explore the cognitive process of decision making, to elicit complex preferences, and to identify the main factors influencing consumers’ choices and the mechanism under which they operate to shape consumers’ prefer-ences. This thesis addresses these questions from a MCDA perspective, a subfield of behavioral operational research, and following a preference disaggregation approach.
1.2 Overarching Theoretical Framework
Research on understanding human preferences has received increasing attention in several dis-ciplines, including psychology (Kahneman et al. 1982;Keeney and Raiffa 1993;Tversky and
Kahneman 1985), economics and marketing (Ben-Akiva and Lerman 1985;Rossi and Allenby
2003;Train 2003), artificial intelligence (De Gemmis et al. 2009;Fürnkranz and Hüllermeier
2010), and behavioral operational research (Figueira et al. 2016). These paradigms, however, view ”preferences” from a different perspective, employ different approaches in analyzing them, and seek for different implications of such understanding. According to Lichtenstein and Slovic, preferences can be conceived of as an individual’s attitude towards a set of objects, typically reflected in an explicit decision-making process (Lichtenstein and Slovic 2006). In economics and marketing, however, preferences are viewed slightly different than the psychological per-spective by Lichtenstein and Slovic. From this point of view, preferences reflect satisfaction, en-joyment, or utility that is gained by some alternatives/items, and form a basis for judgments and choice. Studying preferences in economics and marketing mainly addresses analysis of demand and consumer’s willingness to pay, product development, brand preference studies, and qual-ity improvements in multiple dimensions. The implications in artificial intelligence, however,
direct towards recommender systems and human-computer interactions. From a behavioral research perspective, understanding preferences are of interest for decision support systems and decision aiding practices. The three paradigms, although differ in their theoretical approach, prevalent contexts, methodologies (statistical modeling versus mathematical programming ver-sus machine learning techniques), even terminology (decision maker verver-sus consumer verver-sus user or agent), but are converging rapidly to gain a comprehensive understanding of human judgments and choices.
The assessment of alternatives in real-world decision making requires consideration of a vari-ety of criteria. With an indirect elicitation of preferences, the preference model is constructed in order to identify a rational basis underlying the provided holistic judgments (Jacquet-Lagrèze
and Siskos 2001). Within MCDA, various preference models can be used for this purpose, see,
e.g., (de Almeida 2007;Kadziński et al. 2015;Sarabando and Dias 2010;Słowiński et al. 2002;
Soylu 2011;Vetschera and de Almeida 2012;Zheng et al. 2014), but the most prevailing one
is Multiattribute Value Theory (MAVT) (Keeney and Raiffa 1993). MAVT is built on utility theory which was developed during the1940s and1950s by Von Neuman and Morgenstern
(Von Neumann and Morgenstern 1944) and Savage (Savage Leonard 1954). In general, utility
is a real number representing the preferability of an item. Utility theory, although initially de-veloped for normative decision making, has been one of the main methodological streams of multiple criteria analysis (Zopounidis and Pardalos 2010). MAVT is often found to be appro-priate for practical decision support due to the high interpretability of numerical scores that can be decomposed into per-criterion marginal values and easily explained due to low amount of inter-criteria parameters (Greco et al. 2012;Sarabando and Dias 2010).
In decision making involving multiple criteria, the main attempt concerns the way by which the final decision should be made. In this spirit, several aggregation procedures have been developed to identify the best alternative amongst the available solutions, by simultaneously
considering several conflicting points of view. Goal programming (Charnes and Cooper 1961) has largely impacted the philosophy and evolution of this paradigm. A comprehensive taxon-omy of such procedures is provided inHwang and Yoon (2012). These procedures mainly follow a normative approach that is based on the axioms of rationality and optimality, assuming that the decision behavior is purposive and goal directed (Einhorn and Hogarth 1981). Follow-ing this view, therefore, the aim is to find the decisions thatmustbe made in order to ensure the efficient use of means to attain certain ends (Fishburn 1970;Tversky 1972;Von Neumann and
Morgenstern 1944). When such goals conflict, the notion of optimality does not make much
sense as the problem is not maximizing or minimizing an explicit criterion, but it seeks for compromises between the conflicting goals that reflect one’s values. Therefore, in presence of multiple conflicting criteria, the notion ofoptimalityis replaced byconsistencywith one’s values
(Einhorn and Hogarth 1981).
The main interest in many decision making situations, however, is in the opposite direction
(Jacquet-Lagrèze and Siskos 2001). Given the final decisions made by the DM, how is it
pos-sible to find the rational basis through which the decisions are made? The actual behavior of a DM often involves several cognitive biases and limitations, henceforth deviating from pre-dictions derived from normative approaches (Simon 1957). Descriptive theories of human judgments and choices are developed along this direction by analyzing the decisions that are already made by the DM in order to discover, understand, and explain the rational behind them (Kahneman and Tversky 1984;Slovic et al. 1977;Tversky and Kahneman 1975;Von
Win-terfeldt and Edwards 1993). According to Tsoukiàs, the main difference between normative
and descriptive approaches is the sources that they derive their model of rationality from. Ac-cording to this view, normative approaches derive rationality models from the norms that are established a priori (e.g. maximizing expected utility), whereas source of rationality model for the descriptive approaches is by observing how DMs make decisions (Tsoukiàs 2007).
Dis-aggregation techniques in MCDA aim at understanding judgments and choices of a DM by decomposing the holistic preferences over the set of relevant criteria that form the basis for the preferences.
Following MAVT perspective in MCDA, preferences of a DM are captured by constructing an additive value function. Additive value functions represent the preferences of the DM by computing an overall score for each alternative (Vetschera et al. 2014). This comprehensive value indicates the alternative’s quality from all relevant points of view considered jointly. Fol-lowing this perspective, the most representative preference disaggregation approach in MCDA is the family of UTA methods (Jacquet-Lagrèze and Siskos 1982).
1.2.1 State of the art
Multiple criteria decision aiding is a rapidly growing field of study which has increasingly at-tracted attention in recent years from various fields of applications. The main goal of MCDA is to achieve a set of criteria aggregation procedures that enables the development of decision support models considering preferences and evaluations of the DM (Doumpos and
Zopouni-dis 2013). A criterion can be viewed as a tool which allows one to represent consequences
related to a point of view so as to be able to establish partial preferences (Bouyssou 1990). Tsoukiàs formally defines a criterion as a preference relation, that is a binary relation, on the set of alternatives, or a function representing the criterion (Tsoukiàs 2007). In fact, a criterion is a function that measures performances of the alternatives on each of their characteristics
(Doumpos and Zopounidis 2013). For a decision aiding purpose, the family of criteria is
needed to be consistent, which means i)it needs to address every important point of view (ex-haustive), ii)the partial preferences have to be consistent with the comprehensive preference, i.e. if one alternative is preferred over another according to all points of view, the same should
hold at the comprehensive level, and finally iii)the criteria should not be redundant (Bouyssou
1990).
Analytical frameworks based on MCDA, being mathematically sound and practically flexi-ble, have provided powerful toolkits to effectively tackle complex decision problems of various kinds. These frameworks have been successfully applied in different contexts such as finance, sustainability, health care, urban design, customer satisfaction measurement, supply chain man-agement, and marketing (Angilella et al. 2016; Bisdorff et al. 2015; Doumpos et al. 2015;
Grigoroudis and Siskos 2002,2009;Kadziński et al. 2016;Spronk et al. 2016).
Following the framework suggested by (Pardalos et al. 2013), four main streams can be distinguished in MCDA research:
• multiobjective mathematical programming,
• multiattribute utility/value theory,
• outranking relations approach,
• preference disaggregation.
The aim of multiobjective mathematical programming is to discover the set of non-dominated solutions/alternatives - usually a set of large size - in presence of conflicting objectives/criteria
(Ehrgott 2006;Koopmans et al. 1951). Multiattribute utility/value theory attempts to model
the preferences of a DM by means of a value function (certain environment) or a utility func-tion (decision under uncertainty) (Keeney and Raiffa 1993). The principles of outranking rela-tions have been established by Bernard Roy by introducing the family of ELECTRE methods. An outranking relation, according to Roy, is a binary relation such that alternativeaoutranks alternativebif there are sufficient arguments in favor of this assertion, while there are not many arguments against it. Outranking relations are used to model the preferences of the DM by
constructing preference, indifference, and incomparability relations (Figueira et al. 2005;Roy 1968, 1991). Finally, preference disaggregation, the main focus of this dissertation, aims at inferring preference models from indirect preference information. This approach is discussed in more details in the next section.
1.2.2 Preference Disaggregation
The disaggregation paradigm in MCDA formally started with the introduction of the UTA method in1982(Jacquet-Lagrèze and Siskos 1982). Preference disaggregation, the focus of this dissertation, aims to identify the aggregation model behind the indirect and holistic preference information from the DM (Jacquet-Lagrèze and Siskos 1982). Additive value function is the most common form of preference model used in disaggregation analysis. Ordinal regression techniques are employed to infer a value function, or a set of value functions in case of robust ordinal regressions (Greco et al. 2008), compatible with the decision examples provided by the DM. In this regards, decision examples can take different forms such as ordering of reference al-ternatives, pairwise comparisons, assigning alternatives to a set of predefined ordered categories, and choice of the best alternatives. Moreover, several other types of preference information, such as ordering of the evaluation criteria, intensities of preferences, or desired ranks of some alternatives, can be incorporated in disaggregation analysis to enrich the inference procedure.
Disaggregation approach is of interest because it requires a low level of cognitive effort and interaction time from the DM. With its flexibility in processing several types of preference information, its ability to address different types of decision problems such as ranking, sorting, and choice, and its data driven approach that yields generic outcomes without relying on prior assumptions about the DM’s shape of preferences, preference disaggregation can be a powerful approach in marketing to study consumers behavior.
1.3 Main Research Problems and Contributions
This chapter presents the main motivations of this dissertation, as well as the main contribu-tions to the addressed research problems.
Most of the existing preference disaggregation methods assume a monotonic relationship be-tween input attributes and preferences. The few methods currently addressing non-monotonicity demand excessive computational effort or require extra information from the DM. Developing an efficient methodology for learning non-monotonic preference models is therefore of great importance.
The assumption of monotonicity is widely used because it seems reasonable for many criteria (such as price of a product, level of risk, security, safety and ease of use of a service, required time and effort for accomplishing a task). However, this is not the case for many other at-tributes. In a medical context, for instance, attributes such as sugar and cholesterol levels in blood are clear examples of non-monotonic attributes. In finance, there are many indicators used to depict the financial performance of a firm that experts believe must be controlled within a specific range. For instance, a large value for thecash to total assets ratioimplies that the firm is losing many profitable investment opportunities, whereas a low value indicates a low capacity of the firm to cope with operating expenditures (Despotis and Zopounidis 1995). In marketing, non-monotonic preferences are widely prevalent in product design. Examples include screen size for a smartphone, sweetness of a chocolate, or any design attribute based on ideal point model (Rao 2014).
This dissertation mainly addresses the following three problems:
• As a motivating example, the thesis elaborates on the case of non-monotonic prefer-ences in the context of branding by investigating the impact of brand color on customers perception of a brand (Ghaderi et al. 2015). In this regard, the main question ishow
can MCDA be used for exploring the cognitive role that color plays in determin-ing brand perception? This question will be addressed by proposing an analytical framework and analyzing the secondary survey data combined with the data that is inde-pendently collected by measuring the colors of the well-known beauty and care brands that have a single dominating color (chapter 2).
• Inspired by the example of brand color, the second research problem ishow can we
cap-ture preferences of non-monotonic form? The assumption of monotonicity limits the applicability of the MCDA methods in many fields, therefore it is crucial to overcome this limitation. The analytical framework to elicit such complex preference models still needs to be tractable and efficient in terms of computational demand, in order to ensure its applicability to data sets of realistic size. These requirements inspired the research presented inchapter 3. The problem is addressed by developing an analytical framework based on a Linear Programming (LP) approach. The framework is discussed through an illustrative example, a comparison with some benchmark methods, and a comprehensive experimental analysis (Ghaderi et al. 2017).
• The preference disaggregation frameworks in MCDA, including the one introduced in this dissertation, involves the choice of some parameters which might affect the perfor-mance of the inference process. The quality of the outcomes of a disaggregation analysis, in addition to the parametrization of the problem, could depend also on the settings of the decision problem. In this respect, the next questions addressed in this dissertation is how and to what extent the parametrization procedures and problem settings can change outcome quality of the inference model? Which procedures should be followed in different settings in order to ensure a desired level of quality? To address these questions, chapter 4will argue how expressiveness of the inferred
prefer-ence model, as well as the robustness of the recommendations resulting from the derived model (the two main dimensions of the outcome quality), are influenced by different characteristics of a decision problem and by different procedures for selection of the characteristic points on the scale of evaluation criteria (Kadziński et al. 2017).
1.4 Structure of the Thesis
This thesis is structured as a compendium of publications, organized as follows.
Chapter 2 addresses the challenging question in branding literature about how colors can shape customer perceptions of a brand. It will be demonstrated how the problem can be formulated by employing a MCDA framework. By introducing an analytical framework, a real data set of customers perceptions of dozens of cosmetics brands are analyzed. The results demonstrate a strong connection between perceptions of a brand and its color. It will also be shown how this analytical framework can be employed to create an intuitive perception-color map in order to help brand managers to better position their brands in customers minds. To this aim, forty main attributes of a brand image are mapped on a color space, based on the findings of the analysis.
Chapter 3, inspired by chapter 2, introduces a framework for inferring non-monotonic addi-tive preference models from a set of indirect pairwise comparisons. Moreover, the applicability and effectiveness of the proposed methodology is demonstrated through an extensive experi-mental analysis covering a broad class of decision problem settings.
Chapter 4 investigates the impact of the parametrization of a decision problem, as well as the settings of a decision problem, on the outcome quality of the elicitation process. The quality of the outcomes is defined based on the expressiveness of a preference model derived from the supplied indirect preference information, and robustness of the recommendations derived from
the inferred preference model. Amongst others, particularly special attention will be given to the impact of various procedures for selection of characteristic points, which define shape of marginal value functions in a preference model. In the thesis, a new procedure for selection of characteristic points will be introduced. The results from experimental analysis confirm that the introduced procedure demonstrates overall better performance than the existing ones, and its performance improves when more preference information is becoming available.
Chapter 5 presents a general discussion by addressing theoretical, as well as practical im-plications, and concludes the thesis. Finally, the references of the thesis are provided in the end.
1.5
Main outputs of the Thesis
The three central chapters are already published in Pattern Recognition Letters, European Jour-nal of OperatioJour-nal Research, and Computers & Operations Research jourJour-nals. An overview of the three central chapters is provided in Table 1.5.1. The three papers have been presented in several conferences at different stages of their development and have evolved based on the con-structive feedbacks received at each presentation. The list of conferences is provided in Table 1.5.2.
T able 1.5.1: This table sho ws the central chapters of the thesis and the journals they are published in. C ha pt er A rt icle T itle Author s Jour nal P ub lishin g D at e Jour nal M etr ic s 2 U nde rs ta nd in g the Imp act of br and co lor on br and im ag e: a pr efe re nc e d is aggr eg at ion appr oa ch . Gh ade ri ,M ., R ui z, F., A ge ll, N . P att er n R ec ognit ion L ett er s V olume 67 ,i ss ue 1 , pa ge s 107 -115 , 2015 A B S 3 SJR Q 1 , Imp act Fa ct or : 1 . 586 3 A line ar pr ogr ammin g appr oa ch for le ar nin g non-monot onic add it iv e value funct ion s in m ult ip le cr it er ia de ci sion aid in g. Gh ade ri ,M ., R ui z, F., A ge ll, N . E ur ope an Jour nal of O pe ra tion al R es ea rch V olume 259 ,i ss ue 3 , pa ge s 1073 -1084 , 2017 A B S 4 ,S JR Q 1 , Imp act Fa ct or : 2 . 679 4 E xpr es siv ene ss and ro bus tne ss me as ur es for the ev alua tion of an add it iv e value funct ion in m ult ip le cr it er ia pr efe re nc e d is aggr eg at ion me thod s: an ex pe rime nt al an alysi s. K ad ziń sk i, M ., Gh ade ri ,M ., W ąsi ko w sk i, J., & A ge ll, N . C omput er s & O pe ra tion s R es ea rch Ac ce pt ed ,M ay 2017 A B S 3 ,S JR Q 1 , Imp act Fa ct or 1 . 988 T able 1.5.2: This table sho ws the conferences in which elements of this dissertation have b een presented. C onfe re nc e N ame D at e L oca tion 85 th M ee tin g of EUR O W ork in g Gr ou p on M ult ip le C rit er ia D ec ision A id in g (E WG -M C D A 85) A pr il 20-22, 2017 P ado va ,I taly 28 th E ur ope an C onfe re nc e on O pe ra tion al R es ea rch { (EUR O )} July 3-6, 2016 P ozn an, P ol and 82 nd M ee tin g of EUR O W ork in g Gr ou p on M ult ip le C rit er ia D ec ision A id in g (E WG -M C D A 82) Se pt embe r 24-26, 2015 O de ns e, D enm ark 23 rdIn te rn at ion al C onfe re nc e on M ult ip le C rit er ia D ec ision M ak in g (M C DM 23) Au gus t2-7, 2015 H ambur g, Ge rm an y 1 stIn te rn at ion al C onfe re nc e on D ec ision Su ppor tS ys te m T echno lo gy: B ig D at a A naly tic s For D ec ision M ak in g (IC DSS T ) M ay 27-29, 2015 Be lgr ade ,S er bi a 81 stM ee tin g of EUR O W ork in g Gr ou p on M ult ip le C rit er ia D ec ision A id in g (E WG -M C D A 81) M ar ch 26-28, 2015 A nne cy ,F ra nc e The 17 thIn te rn at ion al C onfe re nc e of the C at al an A ss oc ia tion of A rt ific ial In te lli ge nc e (C C IA) O ct obe r 22-24 B ar ce lon a, Sp ain 22 nd In te rn at ion al C onfe re nc e on M ult ip le C rit er ia D ec ision M ak in g (M C DM 22) June 17-21 M al ag a, Sp ain
2
Understanding the Impact of Brand Colour on Brand
Image: a Preference Disaggregation Approach
1
What is the role that colour plays in perception of a brand by customers? How can we ex-plore the cognitive role that colour plays in determining brand perception? To answer these questions we propose a preference disaggregation method based onmulti-criteria decision aid. We identify the criteria aggregation model that underlies the global preference of a brand with
1This chapter is published in Pattern Recognition Letters by Ghaderi, M., Ruiz, F., Agell, N., (Volume67, issue
respect to each brand image attribute. The proposed method is inspired by the well-known UTASTAR algorithm, but unlike the original formulation, it represents preferences by means of non-monotonic value functions. The method is applied to a database of brands ranked on each brand image attribute. For each brand image attribute, non-monotonic marginal value functions from each component of the brand colour are obtained separately. These functions contain the fitness between each colour component and each brand image attribute, in an understandable manner.
2.1
Introduction
Colour is one of the key ingredients of brands which plays an important role in the purchase de-cisions of customers. As an aesthetic stimuli, colour can shape consumer preferences and alter perceptions by communicating meaningful messages (Zaltner 1975). As an essential element of a brand, colour can signal quality (Lohse and Rosen 2001), affect perception of quality (Chebat
and Morrin 2007), contribute to brand recognition and brand image (Lightfoot and
Gerst-man 1998), and affect brand personality (Labrecque and Milne 2012). Colour, in addition,
intrinsicly communicates the desired image (Bottomley and Doyle 2006) and is considered a strategic tool for marketers and brand managers for differentiating brands from competitors, signalling product attributes, and grabbing customer attention (Schindler 1986).
Colour operates via two mechanisms: sensory and cognitive. In the sensory mechanism, colour helps retrieve information in blurry conditions, by distinguishing, for example, an object from its background. In the cognitive mechanism, colour helps perception by playing a diagnos-tic role and characterising the object that is being represented (an orange sunset and the blue of the sea have specific meaning). As brand image is characterised by the perception of the
customers, brand colour influences brand image through the cognitive mechanism (Wu et al.
2014).
The importance of colour to the marketers is not limited to brand colours. Studies support a significant impact of packaging colours on customer intention to buy and perceived quality. Hoegg and Alba found that colour cues dominate taste cues. In their experiment using orange juice, participants perceived a significantly greater difference in the taste of two identical sam-ples with different colours, than two different samsam-ples with the same colour (Hoegg and Alba 2007). Garber et al, in their experimental study, found that colour affects identification and flavour perception of both congruently and incongruently coloured beverages (Garber et al.
2000).
The common practice for understanding colour trends in industry is based on the opinion of field experts, whose judgements are based on past experiences and are difficult to substitute by analytic models. In this paper, we explore the relationship between brand colour and customer perception of brand image in an understandable and interpretable manner. To this end, we pro-pose a preference disaggregation method based on a multi-criteria decision analysis (MCDA) framework. The aim of this approach is to analyse the holistic preferences of a set of alterna-tives in a multi-criteria setting in order to identify the criteria aggregation model that underlies global preferences, and represent the existing preferential system using a set of marginal value functions.
To address this paradigm, several methods have been proposed in the literature considering different forms of comprehensive preferences and various tasks, for instance UTA (UTilités Additives) (Jacquet-Lagrèze and Siskos 1982), Pairwise comparisons UTA (Doumpos 2012), UTADIS (UTilités Additives DIScriminantes) (Devaut et al. 1980), fuzzy UTASTAR (
Patin-iotakis et al. 2011) and many others (Doumpos 2012;Kliegr 2009). Most of these methods
relationship between brand perception and colour attributes, for example colour hue, is not necessarily monotone, we introduce a new method based on UTASTAR, that is applicable in non-monotonic settings.
The paper is organised as follows. A brief introduction on colour measurement is provided in the next section. An overview of the theoretical framework of preference disaggregation is then presented. Because we are focusing on the ranking problem, the section contains a review of the most widely used UTA variant, UTASTAR, and some of the non-monotonic UTA-like methodologies for the ranking problem. In Section 2.4, the proposed methodology is introduced, followed by an illustrative example to make a comparison with the UTA-NM method. In Section 2.5 the method is applied to a comprehensive set of brand image attributes, in order to explore the impact of brand colour on brand image. Finally, we conclude the paper and present possible future directions.
2.2
Colour coordinates and colour spaces
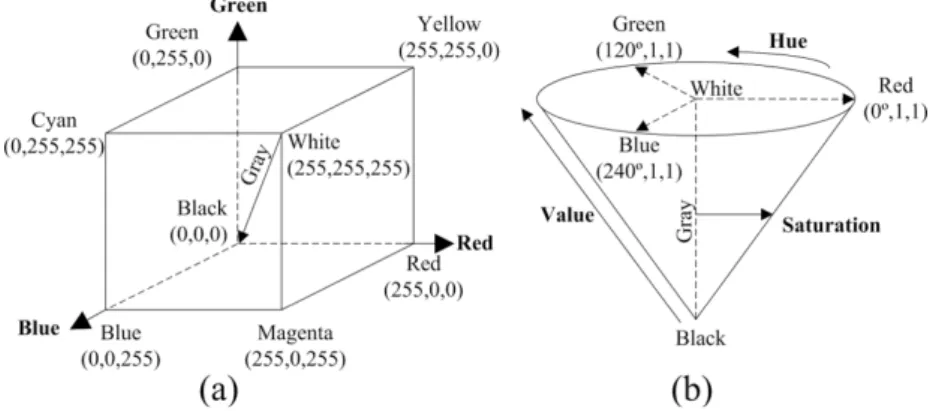
Several numeric specifications for colour definition can be found in the literature. We refer the interested reader to the recent study in (Falomir et al. 2015). The most classic and internation-ally accepted of these are based on tristimulus values or coordinates. The most known of these is RGB, proposed by theCommission International de l’Eclairage(CIE) in1931. RGB uses addi-tive colour mixing and describes what type of light (red, green or blue) needs to be emitted to produce a given colour. The RGB colour model is implemented in different ways, depending on the capabilities of the system used. By far the most common is the24-bit implementation. This model is thus limited to a range of256×256×256 ≈16.7million colours. It is a convenient
colour model for computer graphics, but it can be unintuitive in practice. The specification of a desired colour can be difficult for untrained people (for example, selecting brown using an RGB
vector can be difficult). HSV is another colour space which was developed to approximate the way humans perceive colours. For this reason, in marketing studies HSV colour space is widely used. In this single-hexcone model of colour space, hue (H) of a colour refers the pure colour it resembles and demonstrates its position on the colour wheel, where it starts from0for red, and continues to60for yellow,120for green, and ends up at360or the starting position. Saturation (S) refers to the intensity of the pure colour. In other words, it describes the purity of the colour with respect to white. The value of100means a very vivid colour, while0means the least purity, where too much white dominates the colour. Value (V) measures the brightness of the colour where100 means a totally bright and0 means a totally dark colour. Most colour researchers in marketing focus only on colour hue and usually do not consider the other two attributes. Geometrical representation of the two colour systems RGB and HSV is presented in Fig. 2.2.1.
Figure 2.2.1: RGB (a) and HSV (b) coordinates
2.3 Preference disaggregation methodologies
UTA (Utilités Additives) is one of the most representative preference disaggregation methods. It was first introduced by Jacquet-Lagrèze and Siskos as a linear programming (LP) model to capture the preferential system of the decision maker (DM) through nonlinear (piecewise linear) monotonic additive value functions (Jacquet-Lagrèze and Siskos 1982). The aim of
the UTA method is to reproduce, through a set of value functions, the ranking made by the DM over the set of alternatives by minimising the level of ranking errors. Ranking errors are generally defined as the distance between the global values of two consecutive alternatives that are ranked incorrectly. However, the definition of the error slightly differs in the variants of UTA. The method leads to a simple LP model where the optimal solution can be easily obtained.
Several extensions of UTA method have been introduced in the MCDA literature since then, incorporating variations on the original algorithm and considering different forms of global preference and optimality criteria. In most of the extensions of UTA method, the input at-tributes are normally expected to be monotone with respect to the preferences. The assumption of monotonicity is widely used, and it seems reasonable for many criteria, such as price, risk level, security, safety, comfort, required time, and effort. However, this is not the case for many other attributes, such as colour coordinates. In this paper, we propose an extension for UTA method to handle non-monotone preferences suitable for addressing the problem of understanding the impact of brand colour on brand image. In the following subsections, we present the most representative UTA method for ranking (UTASTAR) and briefly introduce some variants of the method which attempts to consider non-monotonic attributes.
2.3.1 UTASTAR method
Suppose thatG ={g1,g2,· · · ,gm}is a set of criteria to evaluate a set of preordered alternatives
A = {a1,a2,· · · ,aN}in which a1 is the most andaN is the least preferred alternative in the
ranking list. Each criterion is defined as a functiongi : A → R, where gi(an) = xni. The
value xni is the performance of the alternativeanover the criterion gi. Given a weak ordering
(ranking) over the set of alternatives specified by the DM, the aim of the UTASTAR algorithm is to represent the underlying preference model of the given ranking through estimating a set of
monotonic additive value functions (as consistent as possible with the preferential structure of the DM). Specifically, the UTA method estimates a set of marginal value functionsvi : gi →
[0,1] to be aggregated in an additive manner in order to estimate the comprehensive value
associated with each alternative. Finally, alternatives are ranked based on the comprehensive values. The formulation of the UTASTAR method involves definingαicharacteristic points and
henceforthαi−1subintervals[g0i,g1i],[g1i,g2i],· · · ,[gαii−2,giαi−1]on theithcriterion, in whichg0i
andgαi−1
i are the minimum and maximum performance levels over theithscale, respectively. The
marginal value at a characteristic pointgl
ion criterioniis expressed as in equation (2.1).
vi(gli) = l ∑ j=1 (vi(gji)−vi(gji−1)) = l ∑ j=1 vij (2.1)
wherevij ≡vi(gji)−vi(gji−1)≥0due to the monotonicity of the criteria.
The marginal value for an alternativeanwhose performance on theithscale isxin∈[gli,gl
+1
i ]is
obtained by linear interpolation betweenvi(gli)andvi(gli+1)as follows:
vi(xni) = l ∑ j=1 vij+ xni −gli gli+1−gli ·vi,l+1 (2.2)
The comprehensive value of an alternativeanis obtained by the sum of all the marginal values,
as in equation (2.3). V(an) = m ∑ i=1 vi(xni) (2.3)
The UTASTAR linear programming problem is provided in (2.4). min z=∑Nn=1(σ+( an) +σ−(an)) subject to V′(an)−V′(an+1)≥δiffan ≻an+1,∀n =1,2,· · · ,N−1 V′(an)−V′(an+1) =0iffan∼an+1,∀n=1,2,· · ·,N−1 ∑m i=1 ∑αi−1 j=1 vij =1 V′(an) =V(an)−σ+(an) +σ−(an) vij,σ+(an),σ−(an)≥0,∀i,j,n (2.4)
in whichσ+(an)and σ−(an)are the overestimation and underestimation error terms,
respec-tively. The term δ is a parameter (a small value), and the first two constraints represent the preorder relations provided by the DM. The third constraint ensures that the maximal shares of the criteria in the comprehensive value of the alternatives sum up to1, and the objective function minimises the deviation of the estimated value function from the preferential model of the DM. By solving this model, the marginal value function over each criterion scale will be constructed based on the expression in (2.1).
2.3.2 Non-monotonic UTA-like algorithms
The input attributes in the UTASTAR method are normally expected to be monotone with respect to the preferences. However, this is not a reasonable requirement for colourimetric components. Obviously, no one can expect a monotonic relationship between a colour prefer-ence degree and its degree of greenness, or hue. Therefore, an improvement in the UTASTAR algorithm for handling non-monotonic preferences is of a great importance in this setting.
Although several attempts have been made in the literature to overcome the mentioned shortcoming (Despotis and Zopounidis 1995; Doumpos 2012; Eckhardt and Kliegr 2012;
Kliegr 2009), all are computationally intensive, or require extra information from the DM. One way to address non-monotone preferences is to divide the range of the criteria into intervals so that the preferences are monotonic in each interval, and then treat each interval separately. Fol-lowing this idea, in the approach of Despotis and Zopounidis, it is assumed that each marginal value function is non-decreasing from the starting point of the range to a middle point, and it is non-increasing from this middle point to the end of the range (Despotis and Zopounidis 1995). This middle point corresponds to the most preferable value of the criterion. The main drawback of this method is that the exact value function shape and the most preferable value need to be known beforehand. Kliegr proposed another non-monotone methodology called UTA-NM, which relaxes the monotonicity condition of the UTASTAR algorithm, that in the-ory allows any shape for the marginal value function (Kliegr 2009). To avoid the over-fitting problem, UTA-NM simultaneously minimise the sum of the errors and the complexity of the model expressed by the number of changes in the sign of the marginal value functions. The method suffers from severe performance issues. Even for very small toy problems, tens of binary variables were involved, causing the method to be computationally infeasible for real-world problems. In another paper, Eckhardt and Kliegr proposelocal preferences transformation, a heuristic attribute preprocessing algorithm that transforms arbitrary input attributes into a space approximately monotone with respect to user preferences, thus making it suitable for UTA (Eckhardt and Kliegr 2012). Finally, non-monotonic additive value functions, introduced by Doumpos in 2012 (Doumpos 2012), consider a broader class of non-monotonic value func-tions that leads to a nonlinear integer programming problem, which is difficult to solve with data sets of realistic size. Thus, an evolutionary approach is employed, based on the differential evolution algorithm.
2.4
Proposed methodology
The method we introduce here, inspired by the UTA methodology, is fast and tractable. The general idea is to relax sign constraint in the decision variables that represent difference of value levels between two consecutive breakpoints. Therefore, marginal value function can change the monotonicity at any breakpoint.
This may lead to two problems: the first is the over-fitting problem in the case that mono-tonicity changes arbitrarily many times. This potential problem is handled simultaneously in two ways. Firstly, we defined a small, but reasonable, number of breakpoints. The break-points are constructed so that each sub-interval contains the same number of data break-points and hence the same amount of information. Secondly, the slope of the marginal value function in each sub-interval is controlled by defining upper and lower bounds for the associated decision variables. The bounds for each decision variable is defined with respect to the length of the cor-responding sub-interval. The longer the sub-interval, the wider the bound. This constraint not only controls the over-fitting problem, but also increase interpretability of the extracted value functions.
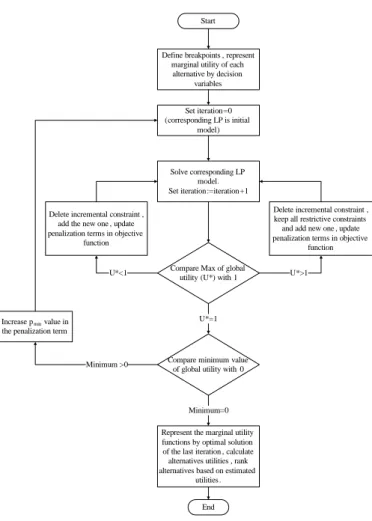
The second problem is about normalisation. By normalisation, we mean that the minimum and maximum global values must be equal to zero and one, respectively. Fixing the minimum and maximum global values is essential for obtaining the relative importance of the criteria. The challenge is that we cannot predict where the maximum value will be achieved on each criterion scale in order to force the sum to be one. Furthermore, we do not know the attribute level corresponding to the minimum marginal value on each criterion to set them equal to zero. To solve this problem, an iterative approach is followed. Whenever the maximum global value is less than one, its value is forced to be increased in the next iteration, by adding a new constraint considering the performance level corresponding to the highest marginal value in the
current stage. The added constraint is applied in the next iteration, and will be removed from the LP model in the following iterations, because it does not have to be necessarily satisfied in the final solution. Whenever the maximum global utility is greater than one, a restrictive constraint is imposed to ensure that the global utility of the attribute levels corresponding to the highest marginal utility in the current stage will not have a value greater than one in all the following iterations. Furthermore, to satisfy another condition of normalisation (namely, minimum global utility being zero), a penalisation term is added to the objective function to penalise any deviation.
2.4.1 Characteristic points definition
Defining the breakpoints is an important step in all the UTA-like methodologies as it directly affects the number of decision variables. We define the breakpoints based on the idea of equal frequency intervals. This means that we expect equal numbers of distinct performance values in each sub-interval of the criterion, except for the two ends of the criterion scale. Let us denote by hi the number of distinct performance levels of alternatives over the ith criterion,
and byci the desired frequency in each sub-interval of the ith scale. It is easy to show that
the number of decision variables corresponding to theith criterion is equal to [hi/ci] +1, in
which[x]is the largest integer number less than or equal to x. Considering that the number
of distinct performance levels might be much higher for some criteria than others, defining the same value for all thecivariables leads to associating many decision variables with the former,
and few with the latter. This leads to over-fitting on the former criteria and inaccurate results on the latter, resulting in dramatically different degrees of freedom for the different estimated value functions. To overcome this issue, we suggest thatcibe a function ofhi, and we propose
ci =
[√ hi
]
. Following this method, we expect that all the criteria will have almost the same degree of freedom.
2.4.2 Initial solution
Following UTASTAR notation, the marginal utilities for each criterioni ∈ {1,2,· · · ,m}are
represented as in equation (2.1), except for a new type of decision variable that has been added,
vi,0, which allows any level of value within the range[0,1]for the lowest possible performance over the criterion scale. The marginal value at a breakpointgl
ion criterioniis expressed as:
vi(gli) = vi,0+ l ∑ j=1 (vi(gji)−vi(gji−1)) = l ∑ j=0 vij (2.5)
and the marginal value for an alternativeanwhose performance on theithscale isxin ∈[gli,gl
+1
i ]
is obtained by linear interpolation betweenvi(gli)andvi(gli+1), as follows:
vi(xni) = l ∑ j=0 vij+ xn i −gli gli+1−gli ·vi,l+1 (2.6)
The comprehensive value is obtained by the formula in (2.3). No normalisation constraint is imposed in the initial solution, and sign constraint over decision variables are relaxed. However, some constraints are imposed to obtain a solution as close as possible to the feasible solution. The first issue to be considered here is having a non-negative estimated marginal value over any characteristic point. Suppose that vectorVi= (vi,0,vi1,· · · ,vi,αi−1)demonstrates the
constraints then guarantees that the estimated marginal value at any point on a criterion scale is non-negative: vi,0≥0 vi,0+vi1≥0 vi,0+vi1+vi2≥0 · · · · · · · · · vi,0+vi1+vi2+· · ·+vi,αi−1≥0 fori=1,2,· · · ,m (2.7)
The following set of constraints also guarantees that the estimated marginal value at any point on a criterion scale is less than 1:
vi,0≤1 vi,0+vi1≤1 vi,0+vi1+vi2≤1 · · · · · · · · · vi,0+vi1+vi2+· · ·+vi,αi−1≤1 fori=1,2,· · · ,m (2.8)
Note that (2.7) and (2.8) can be written in a more compact way using the αi × αi lower
triangular matrixAi with akp = 1 for elements where k ≥ p. Then (2.7) and (2.8) can be
written as:
AiVi ≤1,∀i (2.10)
It is important to bear in mind that the normalisation condition is not guaranteed in the initial solution because the maximum of the estimated comprehensive value is not necessarily equal to 1.
Finally, the following set of constraint limits the slope of the value function at any interval. vij gji−g j−1 i ≤ 1 g0 i −g αi−1 i ,∀i=1,2,· · · ,m,∀j =1,2,· · · ,αi−1 (2.11) The linear format of the above constraints is presented as follows.
vij ≤ g j i−g j−1 i g0 i−gαii−1 −vij ≤ g j i−g j−1 i g0i−gαii−1 ∀i =1,2,· · · ,m,∀j=1,2,· · ·,αi−1 (2.12) The LP model of the initial solution is presented in (2.13).
min z=∑Nn=1(σ+(a n) +σ−(an)) subject to V′(an)−V′(an+1)≥δiffan ≻an+1,∀n =1,2,· · · ,N−1 V′(an)−V′(an+1) =0iffan∼an+1,∀n=1,2,· · ·,N−1 set of constraints in (2.7) set of constraints in (2.8) set of constraints in (2.12) V′(an) =V(an)−σ+(an) +σ−(an) vijURS,i =1,2,· · · ,m,j=0,1,· · · ,αi−1 σ+(a n),σ−(an)≥0,n =1,2,· · · ,N (2.13)
in which URS means UnRestricted in Sign variable.
In the outcome achieved by solving the model in (2.13), let the breakpoints with maximum and minimum marginal value on theithcriterion scale beg∗i andgi∗, respectively.
g∗i =arg max j vi(g j i) (2.14) gi∗ =arg min j vi(g j i) (2.15)
Furthermore, let us assume thatf∗ denotes the sum of the overestimation and underestima-tion errors in the optimal soluunderestima-tion of the model in (2.13). By storing this informaunderestima-tion, the iterative part of the algorithm can be started as explained in the following section.
2.4.3 Iterative part
The missing piece in the aforementioned model is the normalisation to ensure that the maxi-mum achievable comprehensive value is equal to 1. Because the comprehensive value is the sum ofmmarginal values and the maximum marginal value of each criterion might occur at any breakpoint of the criterion scale,∏iαipossible combinations of decision variables exist to
con-stitute the maximum comprehensive value. The general idea is to detect the combinations of decision variables that have the potential to cause the maximum comprehensive value to exceed 1and restrict them by adding a new constraint. Another possibility is that the maximum afford-able comprehensive value is less than1. In this case, we impose a new constraint to enforce an increase in the maximum comprehensive value by a small number,ε, in the next iteration and subsequently remove this constraint. The contribution in the objective function is to introduce two types of penalisation for deviating from the normalised solution. Suppose that we already