Breast Cancer Prediction and Detection Using Data Mining Classification Algorithms: A
Comparative Study
Mümine KAYA KELEŞ
Abstract: Today, cancer has become a common disease that can afflict the life of one of every three people. Breast cancer is also one of the cancer types for which early diagnosis and detection is especially important. The earlier breast cancer is detected, the higher the chances of the patient being treated. Therefore, many early detection or prediction methods are being investigated and used in the fight against breast cancer. In this paper, the aim was to predict and detect breast cancer early with non -invasive and painless methods that use data mining algorithms. All the data mining classification algorithms in Weka were run and compared against a data set obtained from the measurements of an antenna consisting of frequency bandwidth, dielectric constant of the antenna’s substrate, electric field and tumor information for breast cancer detection and prediction. Results indicate that Bagging, IBk, Random Committee, Random Forest, and SimpleCART algorithms were the most successful algorithms, with over 90% accuracy in detection. This comparative study of several classification algorithms for breast cancer diagnosis using a data set from the measurements of an antenna with a 10-fold cross-validation method provided a perspective into the data mining methods’ ability of relative prediction. From data obtained in this study it can be said that if a patient has a breast cancer tumor, detection of the tumor is possible.
Keywords: breast cancer; classification; data mining; detection and prediction of tumor; supervised machine learning algorithms
1 INTRODUCTION
Cancer is a malignant tumor in an organ or in tissue cells that divides and multiplies irregularly. There are more than 100 types of cancer [1]. Studies predict that, by the year 2020, the number of cancer patients in the world will be 20 million [2]. Although the symptoms and treatment methods of the various types of cancer differ, many types of cancer can be prevented by 90-95% with early diagnosis and preventive measures.
The most common type of cancer is breast cancer [3]. The most common symptom of breast cancer is the presence of a painless, hard mass in the breast. However, about 10% of patients feel pain in the absence of such a mass. As with other types of cancer, breast cancer can be more effectively treated when it is diagnosed early. Indeed, early diagnosis of breast cancer significantly increases not only the number of treatment options available, but also the chance of success and survival of treatment [4, 5]. For early detection, three methods are typically recommended and used in conjunction with each other – personal (self-made) breast exams, clinical (done by the doctor) breast exams, and mammograms [6]. X-ray mammography is recently one of the most common detection methods [7, 8]. This imaging tool is used to both: diagnose and screen the diseases. However, sensitivity and specificity constraints are encountered when X-ray mammography is used. While between 4% and 34% of breast cancers cannot be detected by mammography, about 70% of benign tumors are detected using this technique. With this detection method, the patient is exposed to ionizing radiation, so this method is not frequently preferred for screening. This imaging tool alone is not sufficient for cancer detection because this method makes unsuccessful estimates at high percentiles.
Given the challenges associated with X-ray mammography, different methods of cancer detection are being developed, many of which are affordable and painless. In recent years, a number of methods have been able to differentiate small malignant tumors from normal mammary tissue using different microwave frequencies [9, 10]. For this reason, the tumor detection methods are being
investigated that use painless microwave frequencies. Recently, Ultra-Wideband (UWB) radar-based approach systems with antenna design have been used in the detection of tumors. The bandwidth, shape, and dipole configurations are very important for proper antenna design.
Cancer analysis is one of the most significant topics in the field of health. For breast cancer recognition, many studies covering those on artificial intelligence, machine learning and data mining, have been consulted [11-25]. Some of these studies have discussed the importance of microwaves in cancer detection. For instance, Avşar Aydın
[11] showed that artificial intelligent algorithms could identify both cancerous and healthy breast tissue. Additionally, in order to detect cancerous cells in the
breast, Avşar Aydın and Serbest [12] studied new methods that use microwave frequencies, which exploit the fact that the electrical properties of cancer cells differ markedly from those of healthy cells. Using the data obtained from these two studies, a data set was generated for this paper.
A variety of studies on the use of data mining methods in the detection of cancer have been performed. Gökbay [13] investigated the behaviour of the Median filter at various scales and proposed a system that could detect malignant masses in mammograms and help radiologists in mammographic screening. Delen [14] used three well-known data mining methods, i.e., decision trees, artificial neural networks and support vector machines, and one traditional statistical model, logistic regression, to predict models for prostate cancer survivability using the SEER data. The 10-fold cross-validation method was used in model building to measure the evaluation of prediction. Results indicated that the most successful classifier was the support vector machine model. In a study conducted by
Danacı et al. [15], after short information about breast cancer was given in the Introduction section, general data about the tissue was obtained with the help of the Xcyt program, which is used for pattern recognition. Breast cancer cells were diagnosed using one of the decision tree algorithms, namely the C4.5 algorithm in the Waikato Environment for Knowledge Analysis (Weka) tool. Gupta
150 Technical Gazette 26, 1(2019),149-155 et al. [16] provided an overview of cancer research on the
use of data mining classification techniques to diagnose breast cancer. They concluded that applying data mining classification methods was acceptable, and that it could
help diagnose cancer early and avoid biopsy. Güllüoğlu
[17] conducted preliminary work on diagnosis of cancer with data mining. The aim was to gain another point of view on decision-making processes by providing information on how experts in the field of health should use data mining in the health sector. Kharya [18] reviewed research on the diagnosis of breast cancer using data mining methods, such as decision trees, association rule mining, artificial neural network, naive bayes, bayesian network, and support vector machine classifiers. Decision trees were found to be the most successful classifier. In a study conducted by Poyraz [19], a Breast cancer Wisconsin dataset taken from UCI, which was related to breast cancer, was examined using the Weka tool. The success levels of J48, the KStar (K*) algorithm, Logistic regression, and Naive-Bayes data mining algorithms were compared. The logistic regression algorithm was found to be the most accurate with a result of 96.92%. Majali et al. [20] presented a system for the diagnosis and prognosis of cancer using data mining methods. In their paper, the FP Growth algorithm, which is one of the association rule mining algorithms, and the ID3 algorithm, which is one of the decision tree algorithms, were used to detect cancer in its early stages. Amutha and Savithri [21] conducted a study investigating early diagnosis of breast cancer using data mining techniques. Their work focused on Decision Trees, IBk, Support Vector Machine, Sequential Minimal Optimization (SMO), and Neural Networks algorithms. According to Amutha and Savithri, various classification methods can be used to accurately diagnose early cancer. In their paper, Kaur and Singh [22] included a detailed study about the cause of breast cancer and reviewed research on the use of data mining approaches in the detection of breast cancer. Kim et al. [23] developed a novel prediction model for breast cancer recurrence that uses a support vector machine (SVM). The SVM was compared with the artificial neural network and the Cox-proportional hazard regression model. Results indicated that the proposed model for breast cancer recurrence prediction based on SVM (BCRSVM) was useful in the prediction of breast cancer recurrence with high sensitivity (0.89), specificity (0.73), positive predictive values (0.75),
and negative predictive values (0.89). Avşar Aydın and Kaya Keleş [24] used a dataset obtained from an antenna to detect breast cancer using the K-Nearest Neighbor Algorithm with 10-fold cross-validation. The KNN method, which is a data mining algorithm, was found to give results with an accuracy of 90.0%.
The current work focuses on the use of data mining methods in the detection of breast cancer, an important topic in data mining research. The aim is to make a comparison between classification algorithms by applying all data mining classification methods within Weka Data Mining software to the dataset used in this study. To summarize the results, which will be given in more detail
in the Results and Discussion section, this study has
demonstrated an approximate 90% success rate in predicting breast cancer using data mining algorithms.
2 METHODS
This section contains two sub-sections. In the first subsection, data mining is described, and in the second subsection, classification algorithms are explained.
2.1 Data Mining
Data mining is a statistical process whereby data is taken from a data warehouse and compiled, organized and interpreted. The purpose of data mining is to search in large amounts of data for valuable information and to understand the results. Data mining is the process of using data from a wide variety of data warehouses to uncover previously unexplored data and to make decisions. Researchers who wish to conduct data mining studies can choose from a number of computer programs, some of which require payment before use, while others are free. Examination of the relevant literature [15, 24-26] has revealed that Weka software, a free data mining tool, is frequently used. Weka, which was developed by Waikato University in New Zealand, applies data mining algorithms using Java. This open-source software is a collection of machine learning algorithms for data mining tasks. Weka basically applies algorithms for data pre-processing, data visualization, classification, clustering, regression, and association rules. Classification algorithms are the most commonly applied data mining method [24].
Recent studies have shown that data mining algorithms are frequently used in medicine. Some machine learning and data mining algorithms can be applied in the field of medicine as a second opinion diagnostic tool and as a tool for the information extraction stage of the knowledge discovery process in databases.
The main reason why Weka was chosen is that it is frequently used according to the literature. Because of the previously mentioned reasons, the use of Weka software in the current work was deemed more appropriate than the other data mining tools. In the data pre-processing stage, the dataset from other sources was merged under a single data set and transformed to arff format - Weka’s file format. Following these procedures, classification algorithms were run in Weka software to determine whether patients had breast cancer/tumors.
2.2 Classification Algorithms
Classification algorithms predict one or more discrete variables, based on the other attributes in the dataset. Data mining software is needed to run the classification algorithms. In Weka, there are 8 classes, namely bayes, functions, lazy, meta, mi, misc, rules and trees. In our study, the class, mi, did not run and produce any results because of the data format.
In this section, the definitions of the classification algorithms which were successful as well as an explanation of how they work, are presented. In other words, the Weka classes and algorithms that produced the most successful results which are Bagging, IBk, Random Committee, Random Forest, and Simple Classification and Regression Tree algorithms were identified, and are described below.
2.2.1 Bagging Algorithm
The Bagging Algorithm is a machine learning ensemble algorithm [27], proposed by Breiman in 1994, that enhances the accuracy of statistical classification methods. The Bagging Algorithm is derived from the "Bootstrap Aggregating" and has been applied frequently in fields such as biostatistics and remote sensing. It is used for information acquisition in artificial intelligence techniques. This algorithm helps to prevent over-learning because it reduces variance. Basically, it creates more than one training sample by generating different combinations of training data.
The Bagging algorithm works with the small dimensions of the training datasets. The original training set is divided into N sub-clusters. Each of these sub-clusters is used as a training set and generates a classifier. These classifiers are combined by a unifying classifier. For this reason, this method has been termed, Bagging. To simplify, if we assume that the training data consists of N items, then a training data with N samples is replaced by a random selection of data from the training set. In this case, some of the samples are not included in some of the training data, while other samples are included in more than one training data. Each decision tree is trained with training data containing different samples produced in this way, and the result is determined by a majority vote. Fig. 1 shows the working principle of this algorithm.
Figure 1 The working principle of Bagging algorithm 2.2.2 IBk Algorithm
In Weka, the K-Nearest Neighbors (KNN) Algorithm is called the IBk Algorithm. IBk means instance-based learning with parameter k and is considered a classification algorithm. It can solve the classification problem [28] by using lazy classification techniques. In this algorithm, the distance between observations is determined [28] based on a local average calculation. This KNN algorithm is one of the supervised learning algorithms that uses learning techniques based on similarity. This non-parametric algorithm is a widely used instance-based learning algorithm and generates a prediction for a test case right on time [24].
In the K-Nearest Neighbor Algorithm, a new class of samples is determined by calculating the distance from the
samples in the current sample (k-nearest neighbors) to a
given k value of the sample. It uses distance measures,
including Euclidean, Manhattan, Chebyshev, and Levenshtein (Edit Distance) distance functions to find k "close" samples. Because of its efficiency and productivity, Euclidian distance [29] was used in this study with the IBk Algorithm in Weka, as shown in Eq. (1).
2
1 2 1 1 2
( , ) ni ( i i)
dist X X =
∑
= x −x (1) In classification with the K-Nearest Neighbor Algorithm, k, the KNN parameter, specifies the number of closest neighbors to be used when classifying a test sample and the result is determined by a majority vote, as shown in Fig. 2. Weka uses the "cross-validation" option to automatically select the best value. If the cross-validation option is not used, the selected k parameter might be too small or too large. Because of this, the k parameter is important to guard the KNN algorithm against a noisy dataset.Figure 2 The working principle of IBk algorithm 2.2.3 Random Committee Algorithm
The Random Committee Algorithm is a meta-learning algorithm. This metaheuristic, ensemble learning algorithm generates predictions by averaging probability estimates over classification trees [30]. In other words, the Random Committee Algorithm creates a group of base classifiers and averages their predictions. Each base classifier is based on the same data, however uses several numbers of random seed [31]. This is clear only if the base classifier is chosen at random; on the other hand, all classifiers would be the same. The final prediction is an average of the predictions produced by the individual base classifiers, not a vote. The aim of the Random Committee Algorithm is to improve classification accuracy. The Random Committee algorithm is in the Meta Classifier under the Weka tool.
2.2.4 Random Forest (RF) Algorithm
The Random Forest Algorithm can be defined as a collection of tree type classifiers. Random forests were first presented in a proper study by Leo Breiman [32]. In his work, he describes a method for creating a forest of unrelated trees using a Classification and Regression Tree-like (CART-Tree-like) procedure that is combined with
152 Technical Gazette 26, 1(2019),149-155 randomized node optimization and bagging. In this
algorithm, which was developed by Breiman [32], the goal is to combine the decisions of many multivariate trees, each of which is trained in different training clusters, rather than producing a single decision tree. During the classification process, the Random Forest (RF) Algorithm aims to find the classification value using more than one decision tree. Instead of dividing each node into branches by using the best branch among all the variables, the Random Forest Algorithm divides each node by using the best variable among the randomly selected variables in each node.
Each dataset is generated with displacement from the original dataset. Then, trees are developed using a random selection feature, but are not pruned [32]. This strategy makes the RF Algorithm unique and highly accurate. The RF Algorithm is also very fast, resistant to extreme adaptability, and can work with as many trees as desired.
The classification accuracy of the RF Algorithm depends on user-defined parameters such as N (number of trees) and m (number of variables / parameters used in each node). Therefore, the choice of the most appropriate parameter for the data increases the accuracy of classification. According to Breiman [32], the number of m variables taken as equal to the square root of the total
number of M (number of overall variable) variables,
generally gives a result that is closest to the optimal one. The RF Algorithm uses the Classification and Regression Tree (CART) algorithm to generate trees [32]. In each node, branches are created according to the criteria of the CART algorithm (for example, the Gini index). The Gini Coefficient method is used to determine branching criteria [33]. Fig. 3 shows the working principle of the Random Forest Algorithm [32, 34].
Figure 3 The working principle of Random Forest algorithm [32, 34] 2.2.5 Simple Classification and Regression Tree
(SimpleCART) Algorithm
The Simple Classification and Regression Tree (SimpleCART) algorithm is an algorithm with similarities and differences in node partitioning, which is a combination of classification and regression trees. The class of the estimator is the classification analysis, which is defined as the regression analysis if the estimator is a real number, such as the duration of a patient's hospital stay [35].
The Simple Classification and Regression Tree (SimpleCART) Algorithm is a classification technique that
generates a binary decision tree. The SimpleCART algorithm is used for data exploration and prediction. To select the best splitting attribute, entropy can be used. The SimpleCART algorithm deals and handles the missing values by ignoring those records. When dealing with missing values, the fractional instances method is used instead of the surrogate split method. The SimpleCART algorithm is best for training data. While this non-parametric algorithm is flexible and can easily handle outliers, it can have unstable decision trees.
3 RESULTS AND DISCUSSION
The purpose of this paper was to predict and detect breast cancer early - even if the tumor size is smaller - with non-invasive and painless methods that use data mining classification algorithms. As such, a comparison of data mining classification algorithms was made with the Weka tool.
In this paper, the Weka data mining tool was applied to an antenna dataset so as to examine the efficacy of data mining methods in the detection of breast cancer. This antenna dataset consisted of data obtained from studies
conducted by Avşar Aydın [11, 12]. In these studies, an antenna was designed to operate in the 3-12 GHz UWB frequency range and a 3D breast structure consisting of skin layer, fat layer and fibro glandular layer was designed. A separate model was also designed by adding a tumor layer to the breast structure. To find out whether there is a tumor or not, some properties were obtained from the antenna. So, the dataset used in this study was created with these properties.
In this dataset, there are 4 attributes, including the presence or absence information of tumor - the class attribute – and the information of dielectric constant of the antenna’s substrate, frequency bandwidth, and electric field – the other attributes – in the dataset used. This class attribute which is tumor information was used to compare with results obtained using data mining classification algorithms. Thus, the aim of the paper – to predict whether the patient has a tumor or not with the help of an antenna according to the features coming from the antenna – will be provided.
The dataset that was created had 6006 rows/values, 5405 of which were used as the training dataset, while 601 were used as the test data set. The dataset was then converted to the arff format, which is the file type used by the Weka tool. The 10-fold cross-validation technique was then used to obtain the most accurate results using the Knowledge Extraction based on Evolutionary Learning (Keel) data mining software tool. The k-fold cross validation method was used in order to obtain the most accurate measure of performance. In the k-fold cross validation method, after the data is randomized, the randomized original data set is divided into k equal parts. In our paper, the k value was selected as 10, meaning that one fold was taken out in each iteration, and each fold was used once for testing and nine times for training. This is because, in k-fold cross validation, when one part is set aside, then it performs training over the rest k-1 parts and the performance is measured. This process is repeated k times, with a various part taken out each time. So, at the end of the process the score of 10 results – obtained from
10 training and 10 test data– (the value of k) was averaged
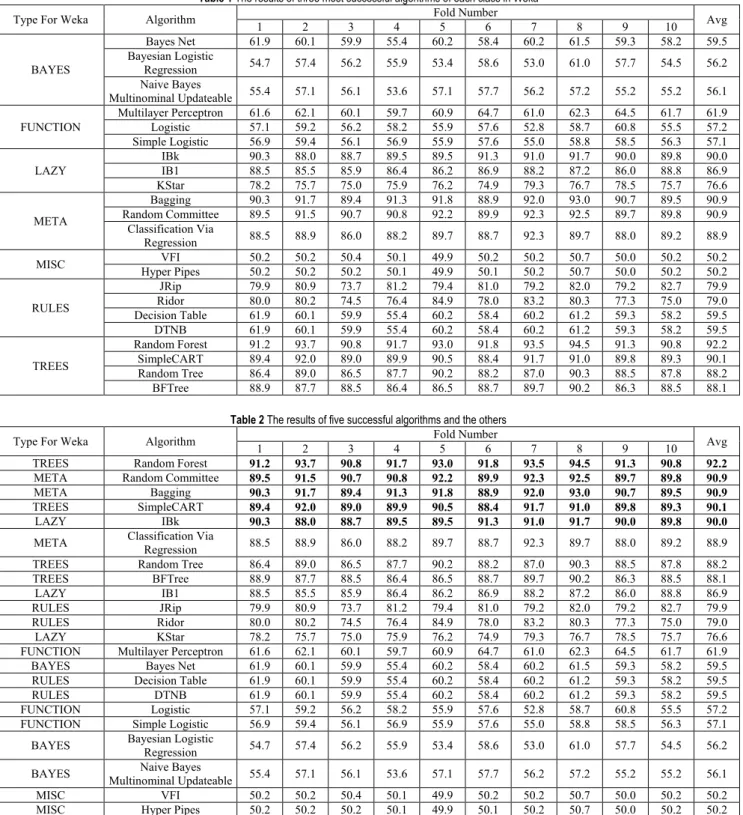
to produce a single prediction and by taking these averages of these 10 results the real result was obtained. These obtained 10 results and their averages are shown in Tab. 1. Table 1 The results of three most successful algorithms of each class in Weka
Type For Weka Algorithm 1 2 3 4 Fold Number 5 6 7 8 9 10 Avg
BAYES Bayes Net 61.9 60.1 59.9 55.4 60.2 58.4 60.2 61.5 59.3 58.2 59.5 Bayesian Logistic Regression 54.7 57.4 56.2 55.9 53.4 58.6 53.0 61.0 57.7 54.5 56.2 Naive Bayes Multinominal Updateable 55.4 57.1 56.1 53.6 57.1 57.7 56.2 57.2 55.2 55.2 56.1
FUNCTION Multilayer Perceptron Logistic 61.6 57.1 62.1 59.2 60.1 56.2 59.7 58.2 55.9 60.9 57.6 64.7 52.8 61.0 58.7 62.3 60.8 64.5 55.5 61.7 61.9 57.2
Simple Logistic 56.9 59.4 56.1 56.9 55.9 57.6 55.0 58.8 58.5 56.3 57.1
LAZY IBk IB1 90.3 88.5 88.0 85.5 88.7 85.9 89.5 86.4 86.2 89.5 86.9 91.3 88.2 91.0 87.2 91.7 86.0 90.0 88.8 89.8 90.0 86.9
KStar 78.2 75.7 75.0 75.9 76.2 74.9 79.3 76.7 78.5 75.7 76.6 META Bagging 90.3 91.7 89.4 91.3 91.8 88.9 92.0 93.0 90.7 89.5 90.9 Random Committee 89.5 91.5 90.7 90.8 92.2 89.9 92.3 92.5 89.7 89.8 90.9 Classification Via Regression 88.5 88.9 86.0 88.2 89.7 88.7 92.3 89.7 88.0 89.2 88.9
MISC Hyper Pipes VFI 50.2 50.2 50.2 50.2 50.4 50.2 50.1 50.1 49.9 49.9 50.1 50.2 50.2 50.2 50.7 50.7 50.0 50.0 50.2 50.2 50.2 50.2 RULES JRip 79.9 80.9 73.7 81.2 79.4 81.0 79.2 82.0 79.2 82.7 79.9 Ridor 80.0 80.2 74.5 76.4 84.9 78.0 83.2 80.3 77.3 75.0 79.0 Decision Table 61.9 60.1 59.9 55.4 60.2 58.4 60.2 61.2 59.3 58.2 59.5 DTNB 61.9 60.1 59.9 55.4 60.2 58.4 60.2 61.2 59.3 58.2 59.5 TREES Random Forest 91.2 93.7 90.8 91.7 93.0 91.8 93.5 94.5 91.3 90.8 92.2 SimpleCART 89.4 92.0 89.0 89.9 90.5 88.4 91.7 91.0 89.8 89.3 90.1 Random Tree 86.4 89.0 86.5 87.7 90.2 88.2 87.0 90.3 88.5 87.8 88.2 BFTree 88.9 87.7 88.5 86.4 86.5 88.7 89.7 90.2 86.3 88.5 88.1
Table 2 The results of five successful algorithms and the others
Type For Weka Algorithm 1 2 3 4 Fold Number 5 6 7 8 9 10 Avg
TREES Random Forest 91.2 93.7 90.8 91.7 93.0 91.8 93.5 94.5 91.3 90.8 92.2
META Random Committee 89.5 91.5 90.7 90.8 92.2 89.9 92.3 92.5 89.7 89.8 90.9
META Bagging 90.3 91.7 89.4 91.3 91.8 88.9 92.0 93.0 90.7 89.5 90.9
TREES SimpleCART 89.4 92.0 89.0 89.9 90.5 88.4 91.7 91.0 89.8 89.3 90.1
LAZY IBk 90.3 88.0 88.7 89.5 89.5 91.3 91.0 91.7 90.0 89.8 90.0
META Classification Via Regression 88.5 88.9 86.0 88.2 89.7 88.7 92.3 89.7 88.0 89.2 88.9
TREES Random Tree 86.4 89.0 86.5 87.7 90.2 88.2 87.0 90.3 88.5 87.8 88.2
TREES BFTree 88.9 87.7 88.5 86.4 86.5 88.7 89.7 90.2 86.3 88.5 88.1
LAZY IB1 88.5 85.5 85.9 86.4 86.2 86.9 88.2 87.2 86.0 88.8 86.9
RULES JRip 79.9 80.9 73.7 81.2 79.4 81.0 79.2 82.0 79.2 82.7 79.9
RULES Ridor 80.0 80.2 74.5 76.4 84.9 78.0 83.2 80.3 77.3 75.0 79.0
LAZY KStar 78.2 75.7 75.0 75.9 76.2 74.9 79.3 76.7 78.5 75.7 76.6
FUNCTION Multilayer Perceptron 61.6 62.1 60.1 59.7 60.9 64.7 61.0 62.3 64.5 61.7 61.9
BAYES Bayes Net 61.9 60.1 59.9 55.4 60.2 58.4 60.2 61.5 59.3 58.2 59.5
RULES Decision Table 61.9 60.1 59.9 55.4 60.2 58.4 60.2 61.2 59.3 58.2 59.5
RULES DTNB 61.9 60.1 59.9 55.4 60.2 58.4 60.2 61.2 59.3 58.2 59.5
FUNCTION Logistic 57.1 59.2 56.2 58.2 55.9 57.6 52.8 58.7 60.8 55.5 57.2
FUNCTION Simple Logistic 56.9 59.4 56.1 56.9 55.9 57.6 55.0 58.8 58.5 56.3 57.1
BAYES Bayesian Logistic Regression 54.7 57.4 56.2 55.9 53.4 58.6 53.0 61.0 57.7 54.5 56.2
BAYES Multinominal Updateable 55.4 Naive Bayes 57.1 56.1 53.6 57.1 57.7 56.2 57.2 55.2 55.2 56.1
MISC VFI 50.2 50.2 50.4 50.1 49.9 50.2 50.2 50.7 50.0 50.2 50.2
MISC Hyper Pipes 50.2 50.2 50.2 50.1 49.9 50.1 50.2 50.7 50.0 50.2 50.2
All the classifiers in Weka were run and the 3 most successful algorithms in each class were selected. Since accuracy is the most preferred measure of performance, the accuracy results of these algorithms are shown in Tab. 1 and the accuracy measurement is shown in Eq. (2) [14]. TP, TN, FP, FN mean True Positive, True Negative, False
Positive, and False Negative, respectively. TP is a test
result where the model correctly identified the positive class while TN is a test result where the model correctly
identified the negative class. FP is a test result where the
model incorrectly identified the positive class, while FN is
a test result where the model incorrectly identified the negative class. So, in that case, accuracy is the proportion of predictions the model got right and is calculated by dividing the number of correct predictions to total number of predictions. TP TN Accuracy TP TN FP FN + = + + + (2) As seen in Tab. 1, the algorithms of the lazy, meta and tree classes were more successful than the algorithms of the
154 Technical Gazette 26, 1(2019),149-155 other classes. Therefore, the algorithms with the highest
accuracy were ranked without consideration of their classes. Those classification algorithms with an accuracy rate higher than 90% were considered successful at detection of the breast cancer with non-invasive and painless methods in this paper. Five algorithms, shown in Tab. 2, – Random Forest, Random Committee, Bagging, SimpleCART, and IBk algorithms – were found to have an accuracy rate higher than 90%. In the IBk algorithm, the default value of k was selected as 3.
As shown in Tab. 2, the most successful algorithm, i.e., the Random Forest algorithm, belongs to the tree class and has a 92.2% accuracy rate. The algorithms of the meta class, i.e., the Random Committee and Bagging algorithms, are the second and third most successful algorithms with a 90.9% accuracy rate, as shown in Table 2. The accuracy rates of SimpleCART, a tree based algorithm, and IBk, a lazy learning algorithm, are close to each other with 90.1% and 90.0%, respectively. Although the accuracy of the other algorithms of the lazy, meta, and tree classes were close to 90%, they were not selected because they did not meet the criteria for success used in the current work, which was 90% accuracy.
When the study is examined in general terms, due to the fact that the data set used in the study was prepared as class-balanced, it was observed that the accuracy method used as a popular performance measurement method was successful in this paper. Referring to the dataset, there is no significant disparity, discrepancy or difference between the number of positive and negative labels. Also, referring to the results, for the first fold, of the 601 examples, 301
examples are tumors (277 TPs and 24 FNs) and 300
examples are non-tumors (271 TNs and 29 FPs). Of the 300 tumors, the model correctly identifies 271 as non-tumor, while of the 301 tumors, the model correctly identifies 277 as tumor. The same situation is true for the other folds. This means that the accuracy method can be as successful for such class-balanced data sets as other performance measurement methods (precision, recall, F-Measure, ROC Area, etc.), especially successful in class-imbalanced datasets.
4 CONCLUSION
In recent years, alternatives to techniques such as X-ray mammography, which exposes patients to too much radiation, have been sought for the diagnosis of breast cancer. The aim of this paper, was to contribute to these efforts by examining a painless and harmless method for diagnosing breast cancer early. For this reason, a dataset obtained from the measurements of antenna was created to detect breast tumors. This dataset consisted of frequency bandwidth, the dielectric constant of the antenna’s substrate, electric field and tumor information.
Research in recent years has shown that data mining methods play an important role in breast cancer diagnosis. The Weka data mining tool is used to detect breast cancer using data mining classification algorithms obtained from these attributes mentioned in the Results and Discussion section. All classification algorithms were tested and the most successful algorithms were determined based on accuracy rates.
The high accuracy rates of these algorithms suggest that breast cancer tumors can indeed be identified non-invasively, at low cost and without exposing patients to harmful radiation, by using data mining classification algorithms, such as Bagging, IBk, Random Committee, Random Forest, and SimpleCART, with higher than 90.0 percent accuracy rate. Thus, if a patient has a breast cancer tumor, it is possible to detect and diagnose the tumor early by different methods such as the UWB radar-based approach systems with antenna design, data mining, and classification methods described in this paper except the well-known traditional methods known as breast exams and X-ray Mammography.
Acknowledgements
This research was partially supported by Adana Science and Technology University Scientific Research Projects Commission. Project Number: MÜHDBF.BM.2015-11 and Project Number: 17103018.
5 REFERENCES
[1] Hejmadi, M. (2010). Introduction to cancer biology. Momna Hejmadi & Ventus Publishing ApS.
[2] Eaton, L. (2003). World cancer rates set to double by 2020.
BMJ : British Medical Journal, 326(7392), 728. https://doi.org/10.1136/bmj.326.7392.728/a
[3] Sharma, G. N., Dave, R., Sanadya, J., Sharma, P., & Sharma, K. K. (2010). Various Types and Management of Breast Cancer: An Overview. Journal of Advanced Pharmaceutical Technology & Research, 1(2), 109-126.
[4] Laronga, C., Chagpar, A. B., & Vora, S. R. (2016). Patient education: breast cancer guide to diagnosis and treatment (beyond the basics). UpToDate. Waltham. https://www.uptodate.com/contents/breast-cancer-guide-to-diagnosis-and-treatment-beyond-the-basics. Accessed, 7-1-2017.
[5] Scharl, A., Kühn, T., Papathemelis, T., & Salterberg, A. (2015). The Right Treatment for the Right Patient – Personalised Treatment of Breast Cancer. Geburtshilfe Und Frauenheilkunde, 75(7), 683-691.
https://doi.org/10.1055/s-0035-1546270
[6] Fuller, M. S., Lee, C. I., & Elmore, J. G. (2015). Breast Cancer Screening: An Evidence-Based Update. The Medical Clinics of North America, 99(3), 451-468.
https://doi.org/10.1016/j.mcna.2015.01.002
[7] Nilavalan, R., Craddock, I., Preece, A., Leendertz, J., & Benjamin, R. (2007). Wideband microstrip patch antenna design for breast cancer tumour detection. IET Microwaves,
Antennas & Propagation,1(2), 277.
https://doi.org/10.1049/iet-map:20050189
[8] Gefen, S., Tretiak, O., Piccoli, C., Donohue, K., Petropulu, A., Shankar, P., et al. (2003). ROC analysis of ultrasound tissue characterization classifiers for breast cancer diagnosis.
IEEE Transactions on Medical Imaging, 22(2), 170-177.
https://doi.org/10.1109/tmi.2002.808361
[9] Hassan, A. M. & El-Shenawee, M. (2011). Review of electromagnetic techniques for breast cancer detection. IEEE
Reviews in Biomedical Engineering, 4, 103-118.
https://doi.org/10.1109/RBME.2011.2169780
[10] Cheng, Y. & Fu, M. (2018). Dielectric Properties for Differentiating Normal and Malignant Thyroid Tissues.
Medical Science Monitor : International Medical Journal of
Experimental and Clinical Research, 24, 1276-1281.
[11] Avşar Aydın, E. (2014). The importance of microwaves in the detection of breast cancer and the identifıcation of
cancer/healthy breast tissues by artificial intelligence algorithms. Journal of Çukurova University Faculty of
Engineering-Architecture, 29, 27-38.
[12] Avşar Aydın, E. & Serbest, H. (2014). The importance of microwaves in the detection of breast cancer and the
identifıcation of cancer/healthy breast tissues by artificial
intelligence algorithms. Ursi-Turkey’2014 VII. Scientific
Congress, Elazığ, Turkey.
[13] Gökbay, İ. Z. (2007). Machine learning techniques in breast
cancer detection. MSc, Bahçeşehir University Institute of
Science and Technology, İstanbul, Turkey.
[14] Delen, D. (2009). Analysis of cancer data: a data mining approach. Expert Syst, 26, 100-112.
https://doi.org/10.1111/j.1468-0394.2008.00480.x
[15] Danacı, M., Çelik, M., & Akkaya, A. E. (2010). Prediction and diagnosis of breast cancer cells using data mining methods. ASYU’2010, Kayseri, Turkey, 9-12.
[16] Gupta, S., Dharminder, K., & Anand, S. (2011). Data mining classification techniques applied for breast cancer diagnosis and prognosis. Indian J ComputSci and Engineer, 2, 188-195.
[17] Güllüoğlu, S. S. (2011). Data Mining Studies in Medical and
Healthcare: A Preliminary Study for Cancer Diagnosis.
AJIT-e: Online Academic Journal of Information
Technology, 2, 355-360.
[18] Kharya, S. (2012). Using data mining techniques for diagnosis and prognosis of cancer disease. Int J ComputSci, Engineer and Inf Tech, 2, 55-66.
https://doi.org/10.5121/ijcseit.2012.2206
[19] Poyraz, O. (2012). Data mining aplications in medicine: Breast cancer data set analysis. MSc, Trakya University Institute of Science and Technology, Edirne, Turkey. [20] Majali, J., Niranjan, R., Phatak, V., & Tadakhe, O. (2014).
Data Mining Techniques for Diagnosis and Prognosis of Breast Cancer. Int J ComputSci and Inf Tech, 5, 6487-6490. [21] Amutha, R. & Savithri, M. (2015). Diagnosis and Prognosis of Breast Cancer Using Data Mining Techniques. Paripex - Indian J Res, 4, 6-8.
[22] Kaur, S. & Singh, R. (2016). A Review of Data Mining Based Breast Cancer Detection and Risk Assessment Techniques. Int J ComputSci and Inform Secur, 14, 241-251. [23] Kim, W., Kim, K. S., Lee, J. E., Noh, D. Y., Kim, S. W., Jung, Y. S., et al. (2012). Development of Novel Breast Cancer Recurrence Prediction Model Using Support Vector Machine. J Breast Canc, 15, 230-238.
https://doi.org/10.4048/jbc.2012.15.2.230
[24] Aydın, E. A. &Keleş, M. K. (2017). Breast cancer detection
using K-nearest neighbors data mining method obtained from the bow-tie antenna dataset. International Journal of
RF and Microwave Computer-Aided Engineering, 27(6). https://doi.org/10.1002/mmce.21098
[25] Kaya Keleş, M. (2016). A Comparison of Statistical Methods
and Data Mining Methods. Papers on Social Science, ICOMEP Special Issue, 20-24.
[26] Kaya, M., Keleş, A. E., & Oral, E. L. (2014). Construction
Crew Productivity Prediction by Using Data Mining Methods. Procedia - Social and Behavioral Sciences, 141, 1249-1253. https://doi.org/10.1016/j.sbspro.2014.05.215 [27] Breiman, L. (1996). Bagging predictors. Machine Learning,
24(2), 123-140. https://doi.org/10.1007/bf00058655
[28] Altman, N. S. (1992). An Introduction to Kernel and Nearest-Neighbor Nonparametric Regression. The American
Statistician, 46(3), 175. https://doi.org/10.2307/2685209 [29] Deza, E. & Deza, M. M. (2009). Encyclopedia of Distances.
Springer-Verlag, Berlin.
https://doi.org/10.1007/978-3-642-00234-2
[30] Guo, L. (2006). Constructing Molecular Classifiers for the Accurate Prognosis of Lung Adenocarcinoma. Clinical
Cancer Research,12(11), 3344-3354. https://doi.org/10.1158/1078-0432.ccr-05-2336
[31] Tatsis, V. A., Tjortjis, C., & Tzirakis, P. (2013). Evaluating data mining algorithms using molecular dynamics trajectories. International Journal of Data Mining and Bioinformatics, 8(2), 169-187.
https://doi.org/10.1504/ijdmb.2013.055499
[32] Breiman, L. (2001). Random forests. Mach Learn, 45, 5-32. https://doi.org/10.1023/A:1010933404324
[33] Mather, P. M. (2004). Computer processing of remotely sensed images: An introduction. West Sussex: Joh Wiley & Sons.
[34] Geurts, P., Ernst, D., & Wehenkel, L. (2006). Extremely randomized trees. Mach Learn, 63, 3-42.
https://doi.org/10.1007/s10994-006-6226-1
[35] Breiman, L., Friedman, J. H., Olshen, R. A., & Stone, C. J. (1984). Classification and regression trees. Wadsworth, Monterey.
Contact information:
Mümine KAYA KELEŞ, Asst. Prof. Dr. (Corresponding author)
Department of Computer Engineering, Adana Science and Technology University Balcalı Mahallesi, Çatalan Caddesi No: 201/1 01250 Sarıçam/Adana, Turkey
+90 3224550000-2042
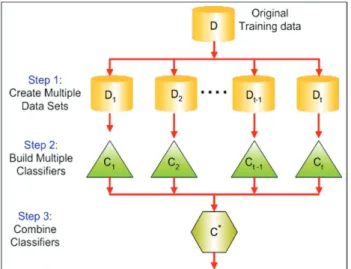
![Figure 3 The working principle of Random Forest algorithm [32, 34]](https://thumb-us.123doks.com/thumbv2/123dok_us/1358293.2681722/4.892.67.411.670.916/figure-working-principle-random-forest-algorithm.webp)