University of Chicago Law School
Chicago Unbound
Coase-Sandor Working Paper Series in Law and
Economics Coase-Sandor Institute for Law and Economics
2008
Scienter Disclosure
Karl Muller Alan Jagolinzer M. Todd Henderson
Follow this and additional works at:https://chicagounbound.uchicago.edu/law_and_economics Part of theLaw Commons
This Working Paper is brought to you for free and open access by the Coase-Sandor Institute for Law and Economics at Chicago Unbound. It has been accepted for inclusion in Coase-Sandor Working Paper Series in Law and Economics by an authorized administrator of Chicago Unbound. For more information, please [email protected].
Recommended Citation
Karl Muller, Alan Jagolinzer & M. Todd Henderson, "Scienter Disclosure" ( John M. Olin Program in Law and Economics Working Paper No. 411, 2008).
C
H I C A G O
JOHN M. OLIN LAW & ECONOMICS WORKING PAPER NO. 411
(2D SERIES)
Scienter
Disclosure
M.
Todd
Henderson,
Alan
D.
Jagolinzer,
and
Karl
A.
Muller,
III
THE LAW SCHOOL
THE UNIVERSITY OF CHICAGO
June 2008
This paper can be downloaded without charge at:
The Chicago Working Paper Series Index: http://www.law.uchicago.edu/Lawecon/index.html and at the Social Science Research Network Electronic Paper Collection:
Scienter Disclosure
M. Todd HendersonThe University of Chicago Law School
1111 East 60th Street
Chicago, IL 60637 [email protected]
Alan D. Jagolinzer
Stanford University Graduate School of Business
518 Memorial Way Stanford, CA 94305 [email protected]
Karl A. Muller, III
The Pennsylvania State University Smeal College of Business
384 Business Building University Park, PA 16802
[email protected] May 27, 2008
Abstract: This study examines implications of “scienter disclosure” through an analysis of voluntary disclosures regarding insiders’ Rule 10b5-1 trading plans. Prior theory suggests that disclosing informed traders’ intent to trade is not strategically advantageous, but this theory does not account for litigation risk reduction resulting from disclosure. Legal precedent regarding Rule 10b5-1 affords legal risk reduction to disclosure, therefore voluntary disclosure offers an interesting theoretical test. Evidence indicates that Rule 10b5-1 disclosure increases with firm litigation risk and insider strategic trade potential. Evidence also indicates that Rule 10b5-1 disclosure is associated with greater abnormal returns to insiders’ trades, especially for firms disclosing specific plan details. This evidence suggests that legal risk can compel firms to depart from a non-disclosure strategy and that disclosure might enhance strategic trade. Evidence also suggests that non-disclosing firms are least associated with strategic trade; therefore proposed mandatory Rule 10b5-1 disclosure might not mitigate strategic behavior.
Keywords: Rule 10b5-1; voluntary disclosure; insider trading
JEL Classification: D82; G38; K22; M52
We thank David Abrams, Chris Armstrong, Anne Beyer, Zahn Bozanic, Paul Fischer, Tom Miles, Andy Van Buskirk, Ro Verrecchia, and workshop participants at Wharton and the Yale Law School for helpful feedback. We also thank Ilya Beylin, Thomas R. Marks, II, and Ruben Rodrigues for helpful research assistance. Henderson acknowledges financial support from the George J. Phocus Fund. Jagolinzer acknowledges financial support from the James and Doris McNamara Faculty Fellowship for 2007-2008. Muller acknowledges financial support from the Smeal Faculty Fellowship for 2007-2008.
Introduction
A clear inference from prior theoretical research is that firm insiders with private information about firm performance would garner no strategic advantage by disclosing either their information or their intention to act on their information in advance of actually acting on it (Baiman and Verrecchia, 1996; Huddart, Hughes and Williams, 2004). This research, however, characteristically ignores the reduction in litigation risk associated with disclosures in advance of any insider wrongdoing. When disclosure has the potential to reduce litigation risk, firms and/or firm insiders trade off litigation risk reduction against the loss in strategic advantage that results from greater transparency, in choosing an optimal disclosure policy. We refer to the voluntary disclosure of either information or the intention to act on the information in advance of acting on it as “scienter disclosure.” In other words, scienter disclosure describes disclosure that attempts to mitigate litigation risks associated with any potential wrongdoing.
This study posits that the disclosure of insiders’ participation within Rule 10b5-1 trading plans is an example of scienter disclosure, and examines the determinants and implications of firms’ decisions to disclose these plans. The Rule 10b5-1 setting offers a natural opportunity to investigate the influence of litigation risk on insiders’ propensity to disclose private information, because legal precedent indicates that Rule 10b5-1 participation disclosure provides clear, legal risk-reduction benefits.
Rule 10b5-1 enables insiders to diversify firm-specific holdings with reduced legal risk if they plan trades while not in possession of material nonpublic information. Despite an April 2002 proposal to mandate 8-K disclosure of insiders’ participation in the Rule, the
SEC currently does not require public reporting of insiders’ trade plans.1 Many firms, however, opt to voluntarily disclose information regarding insiders’ participation within Rule 10b5-1 trading plans. This disclosure choice is interesting because one would not expect pre-trade voluntary disclosure when there is potential for strategic trade within 10b5-1 plans (Jagolinzer, 2008) and the disclosure may reveal privately held information. It is possible, however, that pre-disclosure of trade may be strategic in the face of high legal risk if it mitigates legal risk and does not fully reveal privately held information.
Our evidence indicates that voluntary Rule 10b5-1 disclosure is associated with the level of firm legal risk and a proxy for insiders’ potential strategic trade. Our evidence also indicates that Rule 10b5-1 disclosure is associated with greater abnormal returns to insiders’ trades, especially for firms disclosing specific plan details. Finally, our evidence indicates that investors do not respond negatively to Rule 10b5-1 participation disclosure. Collectively, our work has three salient implications for voluntary disclosure: 1) litigation risk can play a key role in the propensity to disclose information prior to strategic trade; 2) Rule 10b5-1 participation disclosure does not fully reveal insiders’ private information; and 3) disclosure in this setting may actually enhance insiders’ strategic trade opportunities, which is seemingly inconsistent with the SEC’s intent for the Rule.
These findings have important implications with regard to the link between voluntary disclosure and litigation risk. A large body of accounting research has investigated managers’ incentives to voluntary disclose information when facing high litigation risk (e.g., Skinner, 1994; Francis, Philbrick, and Schipper, 1994; Kasznik and Lev, 1995; Skinner, 1997; Baginski, Hassell, and Kimbrough, 2002; Field, Lowry, and Shu, 2005; Rogers and Van Buskirk, 2008). The literature does not consider, however,
1
SEC Release No. 33-8090, Proposed Rule: Form 8-K Disclosure of Certain Management Transactions.
managers’ incentives to voluntary disclose information prior to strategic trade. Our study is significant, therefore, because it provides the first evidence that firms and/or firm insiders trade off the benefit of litigation risk reduction against the loss of strategic trading opportunities as a result of greater transparency when choosing an optimal disclosure policy.
These findings also have important implications regarding Rule 10b5-1 governance. Courts, for example, might more carefully consider whether 10b5-1 disclosure mitigates scienter, because strategic trade appears to be associated with enhanced disclosure. The SEC should also consider that a mandate to disclose 10b5-1 participation might not mitigate strategic trade within the Rule. If evidence in this study is reflective of Rule 10b5-1 use, then firms that currently do not disclose participation (i.e., those most apt to be affected by a disclosure mandate) are likely those that already have the lowest potential for insiders’ strategic trade.
The study proceeds as follows. Section 1 provides background information regarding Rule 10b5-1 and outlines expectations regarding disclosure choice determinants and implications. Section 2 outlines sample selection procedures. Section 3 outlines empirical tests and results. Finally, section 4 summarizes results and discusses potential governance implications.
1. Rule 10b5-1 background, disclosure choice, and disclosure implications
1.1. Rule 10b5-1 background
U.S. corporate insiders face legal risk (both civil and criminal) when trading their firms’ securities because they frequently possess material nonpublic (or “inside”)
information about pending future firm performance and it is generally unlawful to trade without first disclosing this information.2
The SEC promulgated Rule 10b5-1 in October, 2000, in part, to provide a vehicle through which insiders could more readily diversify their firm-specific holdings.3 The Rule provides an affirmative defense that reduces trade-related litigation risk for insiders who enter into trade plans when they do not possess material nonpublic information. This affirmative defense allows more trade flexibility because it absolves insiders from having to cancel pre-planned trades or disclose subsequently obtained material nonpublic information before pre-planned trades execute.
Rule 10b5-1’s guidance suggests that regulators expect uninformed diversification trade from insiders’ trade plans. Specifically,the Rule applies if the insider can show that “before becoming aware of the information” the insider: (1) “entered into a binding contract to purchase or sell the security; instructed another person to purchase or sell the security for the [insider’s] account, or adopted a written plan for trading securities”; (2) put in the plan “. . . the amount of securities to be purchased or sold and the price at which and the date on which the securities were to be purchased or sold; . . . a written formula or algorithm . . . for determining the amount of securities to be purchased or sold and the price at which and the date on which the securities were to be purchased or sold; or [did] not permit the [insider] to exercise any subsequent influence over [transactions]”; and (3) did not “alter[] or deviate[] from the contract, instruction, or plan to purchase or sell securities (whether by changing the amount, price, or timing of the purchase or sale), or enter[] into
2
See Bainbridge (2000) for a detailed discussion regarding insider trading law.
3
Linda Chatman Thomsen, SEC Director, Division of Enforcement stated recently that “the idea [of Rule 10b5-1] was to give executives opportunities to diversify or become more liquid through the use of plans with prearranged trades without facing the prospect of an insider trading investigation.” (Speech by SEC Staff: Opening Remarks Before the 15th Annual NASPP Conference, October 10, 2007).
or altered a corresponding or hedging transaction or position with respect to those securities.”4
There is evidence, however, that Rule 10b5-1 may provide insiders with strategic trade opportunities that generate abnormal trade returns.5 Insiders may, for example, pre-plan trade based on longer-term nonpublic information because of perceived lower legal risk.6 Insiders may also strategically modify the content or timing of disclosure to increase profitability of previously planned trades.7 Finally, insiders may also terminate Rule 10b5-1 plans when they possess material nonpublic information that indicates that a hold strategy would be more profitable than allowing pre-planned sales to continue.8 Jagolinzer (2008) shows that insiders’ 10b5-1 sales are, on average, associated with declines in future firm performance, suggesting there is some strategic behavior within Rule 10b5-1.
1.2. Disclosure choice
In April, 2002, The SEC proposed mandatory disclosure, through 8-K filings, of insiders’ use of Rule 10b5-1 trading plans.9 Specifically, the proposal suggested disclosure of the name and title of the director or executive officer, the date on which the director or
4
17 CFR § 240.10b5-1(c)(1)(C).
5
This contrasts the affect of other insider trade regulation and case law that has been shown to mitigate the degree to which insiders’ time strategic trade [Seyhun (1992) and Garfinkel (1997)].
6
Insiders may perceive lower legal risk when initiating plans while in possession of long term nonpublic information because the possession standard is applied at the plan initiation date. It is likely more difficult for plaintiffs to demonstrate possession as the distance grows between the plan initiation date and the information revelation date.
7
Aboody and Kasznik (2000) provide evidence that disclosures are strategically timed to minimize new option grant strike prices.
8
Abstaining from trade while in possession of material nonpublic information is not deemed unlawful [see Fried (2003) for a policy discussion]. Therefore, terminating a plan while in possession of material nonpublic information is not deemed unlawful [SEC Division of Corporation Finance, Manual of Publicly Available Telephone Interpretations, Fourth Supplement, Rule 10b5-1, Question 15 (issued May 2001)]. The argument is based on a limit in the statute that fraud be “in connection with the purchase or sale of a security,” and since there is neither when a plan is terminated, there is no securities fraud. The SEC did suggest, however, that early plan termination might raise questions about the good faith of the plan.
9
executive officer entered into the 10b5-1 plan, and a description of the contract, including duration, the aggregate number of securities to be purchased or sold, and the name of the counterparty or agent. The proposal also suggested disclosure if the director or executive officer later terminated or modified a plan.10 The proposal was tabled indefinitely, so there is currently no requirement for firms or insiders to provide detail regarding whether or how they participate within their trading plans. Many firms, however, choose to disclose information regarding insiders’ trade plans and there is substantive variation in disclosure detail regarding insiders’ trade plan structures. These disclosure choices are inherently interesting because they potentially offer insight into firms’ and insiders’ utilization of the Rule.
Firms likely disclose Rule 10b5-1 details to reduce legal risk. The affirmative defense provides some risk reduction without disclosure; however, disclosure can further enhance legal protection by increasing the likelihood of early dismissal for securities class action suits. Private class action suits represent a major component of firms’ overall legal risk. If sued, firms face potentially large defense and settlement costs.11 Since class action lawsuits can be “won” or “lost” at the motion to dismiss phase of litigation, firms have incentives to utilize methods, such as 10b5-1 disclosure, that enhance the likelihood of dismissal.
10
Specifically, firms would disclose the date of the termination or modification and a description of the modification, including duration, the aggregate number of securities to be purchased or sold, the interval at which securities are to be purchased or sold, the number of securities to be purchased or sold in each interval, the price at which securities are to be purchased or sold, and the identity of the counterparty or agent.
11
“[C]ompanies are paying the legal costs of…executives defending themselves against fraud allegations. The amount of money being paid…totals hundreds of millions, or even billions of dollars. A company’s average cost of defending against shareholder suits last year was $2.2 million according to Tillinghast-Towers Perrin.” Laurie P. Cohen, “Adding Insult to Injury: Firms Pay Wrongdoers’ Legal Fees”, The Wall Street Journal, February 17, 2004. Average firm settlements are approximately $30 million per suit. More than ten suits settled between $300 million and $6 billion in 2005 alone (PWC 2005; Buckberg 2005).
To dismiss suits involving insider trading allegations, firms may present evidence of Rule 10b5-1 trading plans as an affirmative defense. At the motion to dismiss phase, however, only previously disclosed plans are admissible because courts do not consider materials other than the plaintiff’s pleadings when considering the motion, and defendants are not typically allowed to rebut factual allegations.12 Courts may, however, consider publicly available documents that are not a part of the complaint, for example, taking judicial notice of SEC filings, prospectuses, analysts’ reports, and other publicly reported data.13 Therefore, a publicly disclosed 10b5-1 plan has a greater likelihood of influencing a motion to dismiss than a plan that is not publicly disclosed.14 This view is shared by corporate advisors. For example, Institutional Shareholder Services, the largest proxy advising firm for institutional shareholders, concludes, “such plans should be filed in some form with the SEC so that [they] . . . can be considered at the motion to dismiss stage.”15 Lawyers advising firms on securities fraud litigation matters also think disclosure is a prerequisite to risk reduction: “[t]he adoption of the Rule 10b5-1 trading plans . . . should
12
See, e.g., Weiner v. Klais & Co., 108 F.3d 86, 88-89 (6th Cir.1997).
13
See, e.g., In re Royal Appliance Sec. Litig., 1995 WL 490131, at *2 (6th Cir. Aug.15, 1995).
14
Precedent cases suggest that disclosure is needed to mount a defense at the motion to dismiss stage. For example, Fener v. Belo Corp.425 F.Supp.2d 788 (N.D. Tex. 2006) notes that plaintiffs have an obligation to address in their complaint whether a trading plan was in effect, and if so, “why . . . this does not undercut a strong inference of scienter.” Friedman v. Rayovac Corp., 291 F. Supp. 2d 845 (WD. Wis. 2003) notes that it would generally not consider the trading plan or any other document appended to the motion to dismiss, but it would in this case since the plan was “publicly available on the SEC's website and was filed as an exhibit to numerous reports Rayovac filed with the SEC.” In re Netflix, Inc. Sec. Litig., 2005 WL 1562858 (N.D. Cal. June 28, 2005) and Weitschner v. Monterey Pasta Company, 2003 WL 22889372, No. C 03-0632 (N.D. Cal. Nov. 4, 2003) the courts consider publicly disclosed trading plans at the motion to dismiss stage to find no strong inference of scienter. S.E.C. v. Healthsouth Corp., 261 F.Supp.2d 1298, 1322-3 (N.D.Ala., 2003) notes the existence and disclosure of a trading plan to rebut the SEC’s allegations of the requisite scienter for securities fraud.
15
See White, T., “More on Trading Plans/Restrictions and Motions to Dismiss: Monterey Pasta Co. and Rayovac Corp.” November 24, 2003, RiskMetrics Group, available at
be publicly disclosed” to reduce the risk of litigation (Roberts and Porritt, 2004; Siegel and Lenahan, 2002).16
Since courts consider publicly available data at the motion to dismiss phase, the degree of disclosed detail regarding insiders’ Rule 10b5-1 plans likely impacts the probability of dismissal. If only the existence of a plan is disclosed, a court may not have sufficient detail to ascertain whether the insider sufficiently complied with the Rule and whether the allegedly fraudulent trades are covered by an existing plan. If the full plan details are disclosed, a court may better ascertain whether the allegedly fraudulent trades fall within the Rule’s affirmative defense, thereby increasing the probability of a low-cost dismissal.
The preceding discussion suggests that firms and insiders likely obtain litigation benefits from Rule 10b5-1 plan disclosures, and that the benefits are increasing in the specificity of the public disclosures. If so, then one would expect firms with greater ex ante litigation risk to be more apt to disclose the existence and details of Rule 10b5-1 plans.
Insiders bear costs to 10b5-1 disclosures, however, if investors infer a price relevant signal from disclosure or if disclosure enhances investors’ monitoring of insiders’ trade plan commitment. If investors infer a price relevant signal from disclosure then disclosure may induce investor front-running, which can reduce insiders’ pending trade profitability (Huddart, Hughes, and Williams, 2004).17 If disclosure provides investors with insiders’ 10b5-1 plan details, then it allows for ex post reconciliation of plan commitment. Reconciliation would entail matching data reported in insiders’ transaction reports (e.g.,
16
“While public disclosure of a trading plan is not required, such disclosure often helps to minimize the market impact and negative implications of insider sales.” (Siegel & Lenahan, 2002).
17
Counselors and financial advisors suggested in interviews that front-running concerns factored into the decision to not disclose or to disclose little detail regarding 10b5-1 participation.
SEC Form 4), with details provided with 10b5-1 disclosures. Reconciliation could reveal insiders’ use of the strategic early plan termination option, potentially increasing regulatory scrutiny of insiders’ good faith compliance with the Rule.18 Therefore, specific disclosure reduces insiders’ value of the early termination option. Ceteris paribus, then, insiders should generally not prefer disclosure; therefore disclosure probability should be lower when insiders have more firm control.
Insiders infer 10b5-1 disclosure benefits, however, if they perceive that disclosure provides incremental litigation protection for strategic trade. If this is the case, then insiders’ preference for disclosure should be increasing with their strategic trade potential. In models of insiders’ strategic trade (e.g., Kyle 1985; Huddart and Ke 2007), insiders’ information advantage is determined by: (1) prior stock price variance and (2) the precision of insiders’ private information. Specifically, low investor uncertainty—i.e., low prior stock price variance—provides little scope for profitable insider trade, even if the insider possesses perfect private information. For a given level of private information, then, insiders’ strategic trade potential is increasing in prior stock price variance. If insiders infer that disclosure provides litigation protection benefits regarding potential strategic trade then disclosure probability should be greater when insiders have more firm control and there is higher investor uncertainty.19
Outside shareholders might infer 10b5-1 disclosure benefits if disclosure provides for better monitoring of or greater insider commitment to disclosed trade plans. Outside
18
The SEC states that “[t]ermination of a plan, or the cancellation of one or more plan transactions, could affect the availability of the Rule 10b5-1(c) defense for prior plan transactions [SEC Division of Corporation Finance, Manual of Publicly Available Telephone Interpretations, Fourth Supplement, Rule 10b5-1, Question 15(b) (issued May 2001)].”
19
Disclosure probability should also be greater when insiders have more precise private information. We cannot empirically test this prediction since insiders’ private information about pending performance is unobservable.
shareholders might also infer disclosure benefits if disclosure provides a signal regarding insiders’ private information, and provides firm-level litigation protection if insiders trade strategically. These benefits likely increase when insiders have greater strategic trade potential, since governance is likely more relevant, insiders’ signals are likely more informative, and firm-level litigation risk is likely greater. If this is the case, then disclosure probability should be greater with high outside investor firm control and should be even greater when investors concurrently have more uncertainty—i.e., when prior stock price variance is high.
1.3. Disclosure implications
1.3.1. Realized trade and firm performance
If the probability of Rule 10b5-1 disclosure is increasing in insiders’ strategic trade potential, then disclosure should be associated with greater observed strategic trade. Strategic trade can be inferred ex post from an association between insiders’ sales transactions and subsequent declines in fundamental economic and returns performance. Further, if strategic trade litigation protection is increasing in disclosure specificity, then the degree of observed strategic trade should also increase with disclosure specificity.
Consider, for example, three disclosure groups: non-disclosure, limited disclosure, and specific disclosure. The non-disclosure group likely represents firms that infer low litigation, monitoring, plan commitment, or information signal benefits from disclosure because insiders have low strategic trade potential. If this is the case, then this group is likely not associated with strategic trade. The limited disclosure group likely represents firms that infer some litigation, monitoring, plan commitment, or information signal benefits from disclosure because insiders have some strategic trade potential. This group
would likely contain, for example, insiders who possess less precise private information and therefore place greater value in the strategic early termination option. Limited disclosure affords some legal protection, yet still retains the early termination option since ex post reconciliation is not feasible.20 If this is the case, then this group is likely associated with modest strategic trade. The specific disclosure group likely represents firms that infer substantive litigation, monitoring, plan commitment, or information signal benefits from disclosure because insiders have high strategic trade potential. This group would likely contain, for example, insiders who possess more precise private information and are therefore less concerned with foregoing the strategic early termination option. If this is the case, then this group is likely associated with the greatest degree of strategic trade.
1.3.2. Investors’ disclosure response
If disclosure is associated with insiders’ strategic trade potential, then disclosure may provide a price relevant signal to investors. Investors may respond negatively to limited disclosures regarding 10b5-1 participation, for example, if they infer that insiders have some strategic trade potential for which they seek litigation protection. Investors may choose to delay their response to limited disclosure, however, if they recognize that the participation disclosure implies that insiders’ private information has low precision. Investors may choose, instead, to respond when insiders update their private information signal with a subsequent sale (Lie, 2005). Similarly, investors should respond negatively to specific disclosures regarding 10b5-1 participation, if they infer that insiders have high strategic trade potential for which they seek high litigation protection.
20
Since limited disclosure does not provide sufficient plan detail, one cannot infer, ex post, whether an absence of trade results from early termination, non-execution due to failure to meet limit orders, or natural plan termination.
2. Sample
The sample of participation disclosures are collected from keyword searches for variants of the expression “10b5-1” through 8-K filings, business wire reports, and press releases between October 2000 and December 2006.21 This keyword search nets 773 firm observations. Additional disclosure observations are collected from keyword searches for variants of the expression “10b5-1” through SEC Form 4 filings between October 2000 and December 2006.22 This keyword search nets an additional 894 firm observations. Estimation samples are further constrained by the availability of price and returns data from CRSP, insider transaction data from Thomson Financial, institutional ownership data from CDA/Spectrum, governance data from Equilar, and earnings performance data from Compustat.
Sample disclosures of 10b5-1 plan participation are categorized by each author into limited or specific partitions. If the disclosure delineates the specific terms underlying the plan, the disclosure is classified as specific. Figure 1, Panel A provides one example of a disclosure that is classified as specific. If the disclosure does not delineate the specific terms underlying the plan, the disclosure is categorized as limited. Figure 1, Panel B provides two examples of disclosures that are classified as limited. All Form 4 disclosures are classified as limited since they generally state that a particular transaction is Rule
21
Commonly reported variants of the keyword expression include “10-b-5-1” and “10b5-1(c)”.
22
The SEC mandated electronic Form 4 filings as of June 30, 2003. Unlike previously reported paper filings (which are available electronically as image scans), the electronic filings enable global keyword searches. As a result, a substantive proportion of the Form 4-generated sample comes from the period subsequent to June 2003.
1 compliant, yet provide no specific details regarding the underlying plan.23 This classification procedure yields 94 specific and 1,573 limited firm observations that are further constrained for estimation by data availability.
Some analyses require identifying a sample of firms where insiders’ participation in Rule 10b5-1 is not disclosed.24 The non-disclosure sample is inferred from firms where there is no Rule 10b5-1 participation disclosure and where insiders execute sales transactions within thirty-calendar-day periods that precede quarterly earnings announcements. This inference relies on the assumption that most firms generally blackout insiders’ trades before earnings announcements, yet allow Rule 10b5-1 transactions to bypass blackout restrictions.25, 26
Firms across disclosure specificity groups appear generally similar in size and performance, and are modestly larger and more profitable than the general Compustat population during the estimation period. For example, median market value of equity (untabulated) is $625, $745, $603, and $163 million and return on assets is 3%, 4%, 1.3%,
23
Form 4 disclosures may provide different inferences than other participation disclosures since they follow trades made within 10b5-1 plans. Form 4 disclosures are similar to other limited disclosures, however, in that they convey that an insider has initiated a plan and that the insider is likely to execute further trade within the plan.
24
Jagolinzer (2008) corroborates the existence of firms that choose to not disclose 10b5-1 plan participation, through a survey of nearly 2,700 Nasdaq firms. Nearly 18% of the 378 respondent firms report that they had at least one insider participate within Rule 10b5-1 between October 2000 and December 2002, yet the firm chose to not disclose this information.
25
Jagolinzer, Larcker, and Taylor (2008) report that, from their sample of firm-specific insider trading policies, the average blackout window preceding earnings announcements is 45.81 days. Bettis, Coles, and Lemmon (2000) show that fewer than 15% of sample firms authorize insiders’ trades in the 30 days that precede earnings announcements.
26
At least two errors can occur from this inference algorithm. The first is that the non-disclosure sample does not include firms where insiders participate but their transactions are not realized within short proximity to earnings announcements. The second is that the sample includes firms where insiders do not participate but their transactions are authorized within short proximity to earnings either because the firm does not constrain trade during these windows or because the firm authorizes alternative blackout waivers (e.g., Jagolinzer, Larcker, and Taylor (2008) report that some firms authorize the general counsel to grant blackout window waivers). Approximately 19% of the inferred non-disclosure sample shows evidence of insiders’ sales transactions within thirty-day windows preceding earnings during the year 2000, before Rule 10b5-1 promulgation. This is consistent with alternative blackout waivers. Results are not sensitive to excluding these observations.
and 1.4% for the no-disclosure, limited-disclosure, specific-disclosure, and Compustat population samples, respectively.
3. Empirical Analyses
We are interested in better understanding the determinants and implications of voluntary disclosure of 10b5-1 plan participation. Our empirical tests, therefore, analyze firms’ decisions to voluntary disclose participation in 10b5-1 plans, the association between voluntary disclosure and subsequent firm returns and earnings performance, and investors’ response to disclosure.
3.1. Disclosure choice
Our first empirical analysis investigates whether the voluntary disclosure of 10b5-1 plan participation is more prevalent for firms with high litigation risk and with high potential for insiders’ strategic trade. We investigate firms’ decisions to disclose participation within Rule 10b5-1 trading plans using the following logistic regression model:
Pr
(
Discl=1)
=α0+α1LitR isk+α2InstitOwn+α3InsideDirs+α4V olat+α5⎡⎣V olat*InstitOwn⎤⎦ +α6⎡⎣V olat*InsideDirs⎤⎦ +ε (1)
where Discl is a dichotomous variable that equals one if the firm discloses Rule 10b5-1 participation details, and zero otherwise; LitRisk is the firm’s expected class action litigation probability estimated in the year prior to 10b5-1 participation disclosure;27
27
Specifically, LitRisk is estimated from the following annual cross-sectional logistic regression (similar to Rogers and Stocken, 2005): Pr (DMGPd = 1) = α0+ α1MinReturn + α2StdDevReturn + α3 Turnover + α4 MVE + α5BHReturn + α6Beta + α7BiotechInd + α8CompHWInd + α9CompSWInd + α10ElecInd + α11 RetailInd + ε, where DMGPd equals one if the fiscal year falls within an alleged class action damage period (data provided by Woodruff Sawyer and Co.) and equals zero otherwise; MinReturn is the minimum single day firm return during the fiscal year; StdDevReturn is the standard deviation of daily returns during the fiscal year; Turnover is the average daily trade volume scaled by shares outstanding during the fiscal year; MVE is the average market value of equity during the fiscal year; BHReturn is the prior fiscal year’s buy and hold return; Beta is the firm’s beta coefficient from a regression of daily firm returns on daily market returns; and
InstitOwn is the percentage of institutional firm ownership (CDA/Spectrum) in the year prior to disclosure; InsideDirs is the ratio of officer directors to total board directors in the year prior to disclosure (Equilar); and Volat is the standard deviation of residuals from a regression of firm daily returns on the daily returns to the value-weighted CRSP portfolio in the year prior to disclosure (CRSP).
If firms expect the net benefit from disclosure to be increasing in the expected litigation risk then the coefficient for LitRisk should be positive. If outside investors expect monitoring, plan commitment, litigation, or information signaling benefits from disclosure then the coefficient for InstitOwn should be positive. If insiders expect front-running or plan commitment costs from disclosure then the coefficient for InsideDirs should be negative. If firms, insiders, and outside investors expect higher litigation risk benefits from disclosure when insiders’ strategic trade potential is greater then the coefficients for Volat, [Volat * InstitOwn], and [Volat *InsideDirs] should be positive.
Equation (1) is estimated using disclosure observations, both specific and limited, where the fiscal year is the first year in which disclosure is observed between 2001 and 2006, and non-disclosure observations where the fiscal year is the first year in which inferred Rule 10b5-1 participation is observed between 2001 and 2006. We estimate equation (1) using two specifications. The first is a logistic regression that includes all firm-year observations, which compares the disclosure firms against all non-disclosure firms in the initial plan adoption year. In this specification, we include industry and year BiotechInd, CompHWInd, CompSWInd, ElecInd, and RetailInd are dichotomous variables that equal one if the firm represents the biotechnology, computer hardware, computer software, electric, or retail industries, and equal zero otherwise. For descriptive purposes, pooled estimated coefficients and z-statistics are
MinReturn (coeff = −4.24, z = −10.78), StdDevReturn (coeff = −16.56, z = −5.97), Turnover (coeff = 6.42, z = 6.67), MVE (coeff = −0.01, z = −1.02), BHReturn (coeff = 0.00, z = 1.15), Beta (coeff = 0.67, z = 14.36),
BiotechInd (coeff = 0.80, z = 5.44), CompHWInd (coeff = 0.75, z = 3.39), CompSWInd (coeff = 0.61, z = 4.37), ElecInd (coeff = 0.22, z = 1.29), and RetailInd (coeff = 0.57, z = 3.03). Coefficient estimates differ from those reported by Rogers and Stocken (2005) due to some differences in variable measurement.
fixed effects to control for prevailing industry and market conditions. The second is a conditional logistic that includes each disclosure observation and a matched non-disclosure observation from the same fiscal year, 2-digit industry code, and with the closest market value of equity. This specification potentially reduces the power of the tests, however, it better controls for industry and size related factors that might be associated with disclosure choice.
The first two panels of Table 1 report descriptive statistics for the determinants of voluntary disclosure of 10b5-1 participation. Panel B, which reports univariate statistics within disclosure groups, provides evidence that voluntary disclosure of plan participation is more common for high litigation risk firms. Specifically, average LitRisk is relatively greater for both the specific and limited firms than for the non-disclosure firms (difference = 0.009 and 0.007, t-statistics = 4.37 and 12.00, respectively). Panel B also provides evidence that voluntary disclosure of plan participation is more common for high stock price volatility firms. Specifically, average Volat is relatively greater for both the specific and limited firms than for the non-disclosure firms (difference = 0.011 and 0.002, t -statistics = 4.98 and 4.09, respectively). In addition, average Volat is relatively greater for the specific firms than the limited firms (difference = 0.009, t-statistic = 3.86).
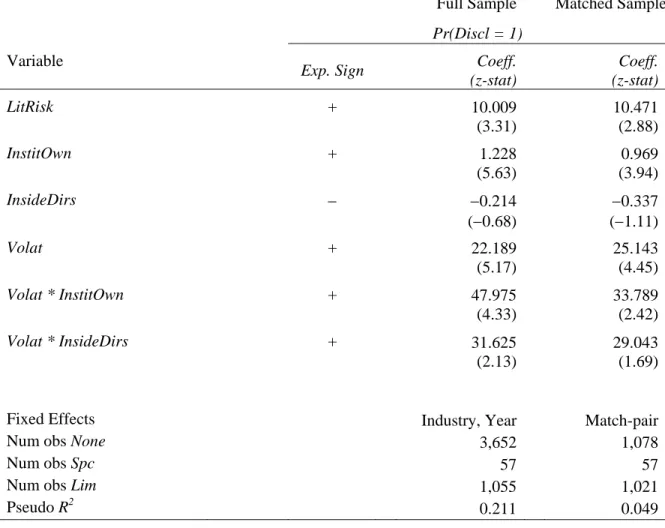
The logistic and conditional logistic estimation results are presented in Panel C of Table 1.28 Consistent with evidence reported in Panel B, the results indicate that higher litigation risk firms are associated with greater disclosure probability of 10b5-1 plan participation (LitRisk coeffs. = 10.009 and 10.471; z-statistics = 3.31 and 2.88). The results also indicate that firms with higher insider strategic trade potential are more likely to
28
Volat, InstitOwn and InsideDirs are recentered to their average values (i.e., the average of each variable has been subtracted from each variable) to provide interpretation of the main effects at their average value.
disclose 10b5-1 participation (Volat coeffs. = 22.189 and 25.143; z-statistics = 5.17 and 4.45). This suggests that firms with higher litigation risk expect benefits from disclosure. The results also indicate that firms with higher institutional ownership are more likely to disclose 10b5-1 plan participation (InstitOwn coeffs. = 1.228 and 0.969; z-statistics = 5.63 and 3.94) and that this association is stronger when there is higher insider strategic trade potential (Volat * InstitOwn coeffs. = 47.975 and 33.789; z-statistics = 4.33 and 2.42). This suggests that institutional investors infer disclosure-related monitoring, plan commitment, information signaling, or legal protection benefits. Results also indicate that officers prefer disclosure only when there is higher insider strategic trade potential (Volat * InsideDirs
coeffs. = 31.625 and 29.043; z-statistics = 2.13 and 1.69). This suggests that insiders prefer greater disclosure to mitigate litigation risk regarding potential strategic trade.
3.2. Realized trade and subsequent performance 3.2.1. Returns performance
The next analyses investigate whether Rule 10b5-1 plan participation disclosure is associated with realized strategic trade by insiders. Figure 2 plots the cumulative abnormal return relative to the timing of insiders’ sales that are executed after the first disclosure of insiders’ participation within the Rule. Returns analyses focus exclusively on insiders’ sales transactions since sales comprise nearly all transactions executed within Rule 10b5-1 (Jagolinzer, 2008) and because there are no specific disclosure observations associated with pending insider purchases. Specifically, Figure 2 cumulates the market adjusted firm returns (daily firm return – the daily return to the value-weighted CRSP portfolio) from day – 30 to day + 30 relative to each sales transaction (executed on day 0) during the one-year
period that follows the insider’s first participation disclosure.29 For non-disclosure firms, a first-pseudo-disclosure date is identified as the sixtieth calendar day that precedes the first observed within-blackout-window transaction.30
Figure 2, Panel A shows that sales trades that follow specific disclosure are associated with positive market-adjusted returns preceding the transaction and negative market-adjusted returns subsequent to the transaction. Relatedly, Figure 2, Panel B shows that sales trades that follow limited disclosure are also associated with positive market-adjusted returns preceding the transaction and negative market-market-adjusted returns subsequent to the transaction. Finally, Figure 2, Panel C shows that sales trades that follow non-disclosure are associated with positive market-adjusted returns preceding the transaction. However, these transactions do not appear to be associated with negative subsequent market-adjusted returns. A comparison of post-trade returns slopes across Figure 2 panels suggests that the degree to which sales transactions are associated with negative performance is increasing in Rule 10b5-1 disclosure specificity.
To more formally test the association between trade returns and disclosure specificity, Table 2, Panel B presents univariate comparisons of abnormal trade returns across disclosure partitions. Specifically, Table 2 reports insider-specific dollar-weighted average buy-and-hold abnormal trade returns for each insider’s sales transactions that
29
For all non-disclosure and most limited disclosure observations, it is not possible to discern the length of 10b5-1 plans. A typical disclosed plan length is 12 months, so we assume that trades made within 12 months following plan disclosure are pursuant to the Rule. Misclassification of observed trades likely induces noise to inferences regarding the association between trades and performance.
30
For disclosure firms (excluding Form 4 disclosures), the average number of days between disclosure and the first observed trade is 53. The median number of days is 17. Results are not sensitive to denoting the first-pseudo-disclosure date as the thirtieth calendar day that precedes the first observed within-blackout-window transaction.
execute during the year that follows disclosure.31 Consistent with evidence reported in Figure 2, Table 2 Panel B indicates that post-trade abnormal returns become more negative as disclosure of participation becomes more specific. For example, Panel B shows that the average six-month post-trade abnormal return is −12.3%, −5.6%, and −0.3% (t-statistics =
−2.91, −13.56, and −1.00) for specific, limited, and non-disclosed trades, respectively. To control for other factors that might explain differences in post-trade returns, Table 3 provides evidence from a calendar-month portfolio estimation of monthly returns regressed on factors known to explain monthly returns (Fama and French, 1993; Carhart, 1997). Our approach follows the portfolio estimation method suggested by Mitchell and Stafford (2000), to control for potential contemporaneous cross-sectional correlation. Specifically, within each disclosure category, monthly portfolios are formed between January 2001 and July 2007 if a 10b5-1 sales transaction is observed in the preceding calendar month. For each calendar month in which at least three firms are available to form a portfolio, the following regression is estimated:
Rport −Rf
(
)
=β0+β1(
Rm −Rf)
+β2SMB+β3HML+β4UMD+u (2)where Rport is the equally-weighted monthly portfolio return, Rf is the one-month treasury bill rate, Rm is the value-weighted monthly market return, and SMB, HML, and UMD are the monthly small-minus-big, high-minus-low, and momentum factors that explain monthly stock returns (Fama and French, 1993; Carhart, 1997).
31
Weighted average abnormal returns are computed as
, ) ( 1 1 j J j J j j j VWBHRw BHRw DollarVol DollarVol − ∑= ∑ = where
DollarVol is the trade dollar volume, BHRw is the trade’s w-month buy and hold return, VWBHRw is the w -month buy and hold return to the CRSP value-weighted portfolio, and j is a subscript for each trade executed.
Consistent with evidence presented in Figure 2 and Table 2, results from Table 3 indicate that more specific 10b5-1 plan disclosures are associated with more negative post-trade abnormal returns. Specifically, abnormal returns to the non-disclosure portfolio (0.001, t-statistic = 0.46) from column 1 of Table 3 are not statistically negative. Abnormal returns to the limited-disclosure portfolio (−0.010, t-statistic = −2.25) from column 2 of Table 3, however, are statistically negative. Abnormal returns to the specific-disclosure portfolio (−0.047, t-statistic = −2.94) from column 3 are also statistically negative. Finally, column 4 of Table 3 indicates that post-trade abnormal returns are statistically more negative as disclosure becomes more specific. Formal tests comparing portfolio returns indicate that post-trade abnormal returns are statistically more negative for the limited-disclosure portfolio relative to the non-limited-disclosure portfolio (−0.010, t-statistic = −1.86), for the specific-disclosure portfolio relative to the non-disclosure portfolio (−0.041, t-statistic =
−4.08), and for the specific-disclosure portfolio relative to the limited-disclosure portfolio (−0.031, t-statistic = −3.04).
We also present results using a firm-level calendar-time regression for robustness. The Mitchell and Stafford (2000) portfolio method can result in relatively low power tests due to observation aggregation at the month portfolio level (see Loughran and Ritter (2000), Mitchell and Stafford (2000), and Cheng, Nagar, and Rajan (2007) for a discussion). Following Cheng, Nagar and Rajan (2007), the following regression model is estimated:
Rj −Rm
(
)
=δ0+δ1None+δ2Lim ited+δ3Specific+δ4Ln(BT M)+δ5PriorReturn+δ6PriorVolatility+z
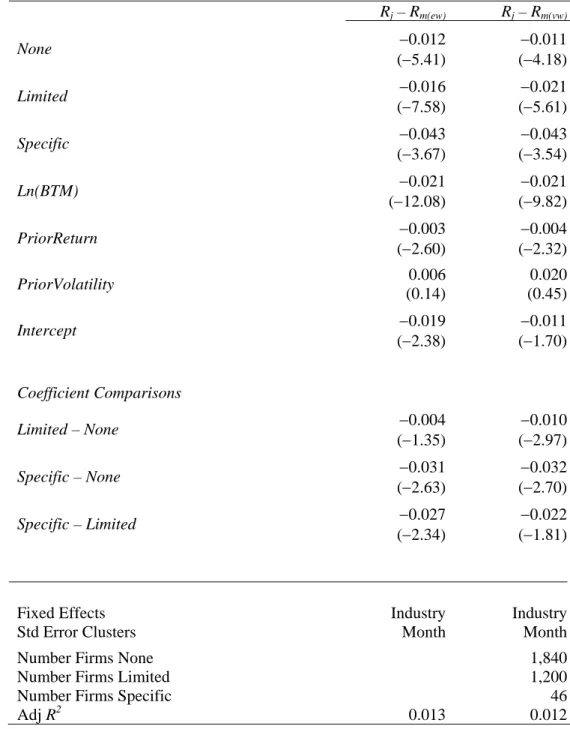
where Rj is the monthly firm return, Rm is the equal-weighted or value-weighted monthly CRSP portfolio market return, None is a dichotomous variable that equals one during the month following a non-disclosed inferred Rule 10b5-1 sales transaction and equals zero otherwise, Limited is a dichotomous variable that equals one during the month following a limited-disclosed Rule 10b5-1 sales transaction and equals zero otherwise, Specific is a dichotomous variable that equals one during the month following a specific-disclosed Rule 10b5-1 sales transaction and equals zero otherwise, BTM is the book-to-market ratio measured at the end of the previous month, PriorReturn is the buy-and-hold firm return over the preceding 12 months, and PriorVolatility is the standard deviation of monthly stock returns over the preceding 36 months. We control for common events within industries using 2-digit industry code fixed effects. We also control for potential dependency in firm returns within months through the use of month-clustered standard errors (Gow, Ormazabal, and Taylor, 2008).32
Consistent with earlier results, Table 4 provides evidence that the association between sales transactions and subsequent negative performance is increasing in disclosure specificity, after controlling for other factors that are associated with firm returns. Specifically, when the dependent variable equals the equal-weighted-market adjusted firm monthly return, results indicate that abnormal returns following trade months are 1.2%, 1.6% and 4.3% lower than returns in other months for non-, limited-, and specific-disclosure firms, respectively. When the dependent variable equals the value-weighted-market adjusted firm monthly return, results indicate that abnormal returns following trade
32
Lakonishok and Lee (2001) provide evidence that abnormal returns accrue to insiders’ sales at firms with high book to market ratios and low market value of equity. This estimation explicitly controls for differences in book to market ratios across firms. Market value of equity is implicitly controlled for because firms in the different disclosure partitions are of similar size (untabulated).
months are 1.1%, 2.1% and 4.3% lower than returns in other months for non-, limited-, and specific-disclosure firms, respectively. Formal tests indicate that post-trade abnormal returns are generally statistically more negative as disclosure specificity increases.
3.2.2. Earnings and price relevant news
To better understand what may economically underlie the association between disclosed Rule 10b5-1 trades and subsequent return performance, Table 5 presents results regarding investors’ response to releases of earnings news, both before and after the first observed trades that follow voluntary Rule 10b5-1 disclosures. Specifically, Table 5 reports three-day market adjusted returns, centered on the quarterly announcement date (RDQE from Compustat), for the four quarters that precede and that follow the quarter in which the first insider trade is observed following disclosure. Returns are adjusted by subtracting the same period return to the value-weighted CRSP portfolio.
Table 5 provides evidence of positive earnings announcement surprises for the four quarters prior to insiders’ first sales for firms providing limited and specific disclosure (pooled t-statistics = 5.57 and 2.24, respectively). This evidence is consistent with positive earnings performance relative to investors’ expectations prior to insiders’ sales. Table 5 also provides some evidence of negative earnings announcement surprises for the four quarters following insiders’ first sales for firms providing limited disclosure (pooled t -statistic = −2.23). This evidence is consistent with overall negative earnings performance shifts from the period before to after insiders’ sales. Evidence for firms providing specific disclosure indicates a similar decline in earnings performance across the periods, however, there is no evidence of negative post-sales earnings performance perhaps because of low power or because specific disclosure trades are associated with price relevant events that
may not be impounded in short-term earnings. To explore this further, we analyze whether specific disclosures are associated with subsequent news events that may not be impounded in short-term earnings. We find that approximately 25% of the specific disclosure sample exhibits a single news event, not related to earnings, for which the three-day market adjusted return falls between −10% and −75%, within an average 140 calendar days of disclosure.33 We also find that approximately 33% of the remaining specific disclosure sample exhibit sustained returns declines (between –20% and −80%), for which there is no obvious associated information event, during the 180 calendar days that follow disclosure,.
Collectively, this evidence suggests that Rule 10b5-1 trades tend to be associated with fundamental firm economic shifts. This mitigates the likelihood that observed returns patterns result from investors’ response to 10b5-1 trade signals.
3.2.3. Investors’ response to 10b5-1 disclosure
We assess whether investors respond to 10b5-1 disclosure by estimating three day market-adjusted returns centered on the initial participation disclosure date and on the subsequent report date for the first trade execution. We market-adjust returns by subtracting the same period return to the value-weighted CRSP portfolio. Table 6 provides evidence regarding returns to initial participation disclosures (Announcement) and to first transaction disclosures (Transaction), which represent the transactions’ Form 4 SEC reporting date (Thomson Financial). Results do not indicate that investors respond negatively to 10b5-1 disclosure or the disclosure of first trades executed within 10b5-1. The lack of negative investor response to 10b5-1 disclosures may indicate that there are frictions to implementing strategies based on 10b5-1 disclosure signals or that investors’ do
33
News event examples include exchange-imposed stock trade suspension, drug trial failure, and announcement of the intent to acquire another firm.
not understand 10b5-1 disclosure implications, which is possible if our sample period reflects the transition period regarding 10b5-1 use.34 It may also indicate that the reported estimation method is misspecified or has low power.
4. Conclusions
This study examines implications of “scienter disclosure” through an analysis of voluntary disclosures regarding insiders’ Rule 10b5-1 trading plans. In contrast to theory that suggests there is no strategic advantage to disclosing an informed insider’s intent to trade (Baiman and Verrecchia, 1996; Huddart, Hughes and Williams, 2004), evidence suggests that disclosure related legal risk mitigation can compel firms to depart from a non-disclosure strategy. Specifically, evidence indicates that participation non-disclosure is increasing in firm litigation risk and in insiders’ strategic trade potential, suggesting that firms and/or firm insiders infer legal benefits from disclosure. Evidence also indicates that risk-mitigating disclosure may enhance insiders’ strategic trade profit potential. Specifically, evidence indicates that disclosed 10b5-1 insiders’ sales transactions are associated with fundamental firm economic shifts that relate to significant declines in returns performance. Evidence also indicates that post-trade returns performance declines are increasing in disclosure specificity. Collectively, this suggests that 10b5-1 disclosure may provide legal protection for strategic trade, which is seemingly inconsistent with regulatory intent.
Several governance implications may be drawn from these results. First, courts might more carefully consider whether 10b5-1 disclosure mitigates scienter, since strategic
34
Anecdotally, some regulators, legal counselors, and institutional investors have noted that they have only recently begun to understand the implications of Rule 10b5-1. Some have noted that their understanding has improved with the increasing availability of historical data.
trade patterns appear more in firms with enhanced disclosure. Second, firms should consider whether specific disclosure reduces or enhances insiders’ strategic trade options. In some cases, it may reduce the value insiders’ options since it allows for ex post revelation of early plan termination. However, it may enhance the value of other options, such as planning trade in anticipation of longer-term negative news, since specific disclosure may increase the likelihood of early legal case dismissal. Finally, the SEC should consider that a mandate to disclose 10b5-1 participation might not mitigate strategic trade within the Rule. If evidence in this study is reflective of Rule 10b5-1 use, then firms that currently do not disclose participation (i.e., those most apt to be affected by a disclosure mandate) are likely those that already have the lowest potential strategic trade.
References
Alexander, J.C. 1996. Rethinking Damages in Securities Class Actions. Stanford Law Rev.
(48) 1487-1499.
Asquith, P. and D. W. Mullins, Jr. 1986. Equity Issues and Offering Dilution. Journal of Financial Economics (15) 61-89.
Bainbridge, S. M. 2000. Insider Trading. Encycl. Law & Econ. (3) 772-812.
Bettis, J. C., J. L. Coles, and M. L. Lemmon, 2000. Corporate policies restricting trading by insiders. J. Financial Econ. (57) 191-220.
Carhart, M. M. 1997.On Persistence in Mutual Fund Performance. J. Finance (52) 57.
Cheng, S., V. Nagar, and M. V. Rajan 2007. Insider Trades and Private Information: The Special Case of Delayed-Disclosure Trades. Review of Financial Studies (20) 1833-1864. Conover, W. J. 1999. Practical Nonparametric Statistics. New York.
Dunbar, F. C., T. S. Foster, V. M. Juneja, and D. M. Martin 1995. Recent Trends III: What Explains Settlements in Shareholder Class Actions? (National Economic Research Associates, Inc.).
Fama, E. F., K. R. French. 1993. Common Risk Factors in the Returns on Stocks and Bonds. J. Financial Econ. (33)3.
Fried, J. M. 2003. Insider Abstention. Yale Law Journal (13) 455.
Garfinkel, J. A. 1997. New Evidence on the Effects of Federal Regulations on Insider Trading: The Insider Trading and Securities Fraud Enforcement Act (ITSFEA). Journal of Corporate Fin. (3) 89.
Gow, I. D., G. Ormazabal, and D. J. Taylor 2008. Correcting for Cross-Sectional and Time-Series Dependence in Accounting Research, Stanford Graduate School of Business working paper.
Huddart, S., J. S. Hughes, and M. Williams 2004. Pre-Announcement of Insiders’ Trades, working paper, the Pennsylvania State University.
Huddart, S., B. Ke 2007. Information Asymmetry and Cross-sectional Variation in Insider Trading. Contemporary Accounting Research (24) 195-232.
Jagolinzer, A. D. 2008. SEC Rule 10b5-1 and Insiders’ Strategic Trade. Working Paper, Stanford Graduate School of Business.
Jagolinzer, A. D., D. F. Larcker, and D. J. Taylor, 2008. The Impact of the General Counsel in Corporate Governance. Working Paper, Stanford Graduate School of Business. Kyle, A. S. 1985. Continuous Auctions and Insider Trading. Econometrica (53): 1315-1335.
Lakonishok, J., and I. Lee, 2001. Are Insider Trades Informative? Review of Financial Studies (14): 79-111.
Loughran, T., and J. Ritter, 2000. Uniformly Least Powerful Tests of Market Efficiency.
Journal of Financial Economics 55: 361-89.
Miller, R. I., Foster, T., and E. Buckberg (2006). NERA Economic Consulting: Recent Trends in Shareholder Class Action Litigation: Beyond the Mega-Settlements, is Stabilization Ahead?
Mitchell, M., and E. Stafford. 2000. Managerial Decisions and Long-Term Stock Price Performance. Journal of Business 73: 287-329.
Roberts, L., and Porritt, N., 2004. Individual Trading Plans Can Help Defend Securities Fraud Claims. Compliance Week.
Rogers, J. L. and P. C. Stocken, 2005. Credibility of Management Forecasts. Accounting Review 80: 1233-1260.
Seyhun, H. 1992. Why Does Aggregate Insider Trading Predict Future Stock Returns?
Quarterly Journal of Economics 107: 1303-31.
Siegel, B. J. and K. Lenahan, 2002. Rule 10b5-1 Trading Plans: Planned Liquidity for Insiders. Technology Times.
Vermaelen, T. 1981. Common Stock Repurchases and Market Signalling, an Empirical Study. Journal of Financial Economics (9) 139-183.
Figure 1
Example 10b5-1 Plan Disclosures Panel A: Specific
Figure 1 (continued)
Example 10b5-1 Plan Disclosures Panel B: Limited
Excerpt from Ariba Inc. Form 8-K, Filed June 16, 2006
∑
− = − d d VWCRSP f R R 30 ) ( disclosure. Figure 2Cumulative abnormal return relative to sales transactions
This figure plots the average cumulative abnormal return relative to insiders’ sales transactions within Rule 10b5-1. Each firm’s cumulative abnormal return is computed as CARt =
t
, where Rf is the firm’s daily return,RVWCRSP is the daily return to the CRSP value weighted portfolio, and t denotes a specific day relative to the transaction date. Trade-day observations = 1,108 specific, 23,040 limited, and 20,818
non-Panel A. Specific-disclosure sales
-0.03 -0.02 -0.01 0 0.01 0.02 0.03 0.04 0.05 -3 0 -2 7 -2 4 -2 1 -1 8 -1 5 -1 2 -9 -6 -3 0 3 6 9 12 15 18 21 24 27 30
Days relative to transaction
CA
R
Panel B. Limited-disclosure sales
0 0.01 0.02 0.03 0.04 0.05 0.06 -3 0 -2 7 -2 4 -2 1 -1 8 -1 5 -1 2 -9 -6 -3 0 3 6 9 12 15 18 21 24 27 30
Days relative to transaction
CA
R
Panel C. Non-disclosure sales
0 0.01 0.02 0.03 0.04 0.05 0.06 0.07 0.08 -3 0 -2 7 -2 4 -2 1 -1 8 -1 5 -1 2 -9 -6 -3 0 3 6 9 12 15 18 21 24 27 30
Days relative to transaction
CA
Table 1
Disclosure of 10b5-1 plan participation determinants
Panel A: Summary statistics
Variable Mean Std. Dev. 25% 50% 75%
LitRisk 0.014 0.017 0.006 0.009 0.015
InsideDirs 0.363 0.167 0.242 0.353 0.460
InstitOwn 0.497 0.272 0.263 0.521 0.727
Volat 0.029 0.017 0.017 0.024 0.036
Panel B. Statistics by disclosure type
Variable None Lim Spc Spc - None Lim - None Spc - Lim
Mean Mean Mean Mean
(t-stat) Mean (t-stat) Mean (t-stat) LitRisk 0.013 0.020 0.022 0.009 (4.37) 0.007 (12.00) 0.002 (0.85) InsideDirs 0.366 0.354 0.372 0.006 (0.30) −0.012 (−2.09) 0.018 (0.83) InstitOwn 0.472 0.583 0.532 0.060 (1.62) 0.111 (11.80) −0.051 (−1.40) Volat 0.027 0.029 0.038 0.011 (4.98) 0.002 (4.09) 0.009 (3.86)
Table 1 continued
Disclosure of 10b5-1 plan participation determinants Panel C: Logistic regression
Matched Sample
Pr(Discl = 1)
Full Sample
Variable
Exp. Sign Coeff. (z-stat) Coeff. (z-stat) LitRisk 9 ) 10.471 (2.88) InstitOwn + 1.228 (5.63) 0.969 (3.94) InsideDirs − −0.214 − (−−0.3371.11) Volat 9 ) 25.143 (4.45) Volat * InstitOw + 47.975 (4.33) 33.789 (2.42) Volat * InsideDirs + 31.625 (2.13) 29.043 (1.69)
Fixed Effects Industry, Year Match-pair
Num obs None 3,652 1,078
Num obs Sp 57 57 N Li 055 1,021 Pseudo R2 211 0.049 + 10 (3 .00 .31 ( 0.68) 22 (5 + .18 .17 n c m um obs 1, 0.
Th le provides summary statistics (Panel A), univariate comparisons (Panel B), and logistic regressions (Pa ) of th rms’ d to s ci i 5-1 plans. Comparisons are ma the ye or di firm d i fir ar ferred 10b5-1 trade for non-dis ng firms. Panel C provides results fro stim g: Dis 1) + α1LitRisk + α2InstitOwn + ideDirs + α4 Volat + α5 Volat * InstitOwn + α6 Volat * InsideDirs + +ε, where Discl is a dic mous variable that equals f the firm discloses Rule 10b5-1 participation details, and zero oth se; LitRisk is the firm’s expected class action litigation probability estimated in the year prior to 10b5-1 p ipation disclosure; InstitOwn e percentage of institutional firm ownership (CDA/Spectrum) in the ye or isclosure; InsideDirs i of officer directors to total board directors in the year prior to dis re uilar); and Volat is the dard deviation of residuals from a regression of daily firm returns on da lu ighted CRSP portfolio rns in the year prior to disclosure (CRSP). LitRisk is estimated from the w annual cross-sectional stic regression [similar to Rogers and Stocken (2005)]: Pr (DMGPd
= 1) = α α1 MinReturn + α2St Return + α3 Turnover + α4 MVE + α5 BHReturn + α6Beta + α7 Bio In α8CompHWInd + α9C SWInd + α10ElecInd + α11RetailInd + ε, where DMGPd equals one if sc ar falls within an alle lass action damage period (data provided by Woodruff Sawyer and Co d ro e; Mi is the minimum gle firm return during the fiscal year;
e iat ily retur uri e fiscal year; Turnover is the average daily lu sta ring the al y MV th rage market value of equity th i or fisca r’s an old rn; Beta is the firm’s beta is tab nel C de in closi α3 Ins hoto erwi artic ar pri closu ily va follo tech the fi .) an DevR e vo ing e de ar of term fir ina st d nts iscl of fi osure f ecisi sclos ons ing m e disclo s an atin e parti n the Pr ( pation st ye cl = n 10b of in =α0 one i is th s the ratio stan retu logi dDev omp ged c nRet ion o ndin s the to d (Eq e-we ing 0+ d + al ye equa turn me s e fis ls ze is th cale cal y othe and sh ; B rwis ard d are HR urn f da g du pri sin ng th ear; buy day E is d h Std trad dur e st d by ear ev s out eturn ns d fisc l yea e ave retu
ssion of daily firm returns on daily market returns; and BiotechInd, CompHWInd, at equal one if the firm represents the
ail industries, and equal zero otherwise. stic regression results using all available observations and fixed industry an l C presents conditional logistic regression results for the sample where e h disclosure firm is matched with a non-disclosure rm from the s d
closest market value of equity. coefficient from a regre
CompSWInd, ElecInd, and RetailInd are dichotomous variables th iotechnology, computer hardware, computer software, electric, or ret b
Column 1 of Panel C presents logi d year effects. Column 2 of Pane
Table 2
Weighted average abnormal returns
Panel A. Insider specific statistics by disclosure type
Variable None Lim Spc Spc - None Lim - None Spc - Lim
Mean Mean Mean Mean
(t-stat) Mean (t-stat) Mean (t-stat) Cumulative Sales ($M) 6.589 8.206 5.618 −0.971 (−0.39) 1.617 (1.62) Transaction Days 4.878 10.720 25.065 20.187 (3.59) 5.843 (16.54) CEO 0.126 0.240 0.541 0.415 (6.43) 0.114 (13.57) CFO 0.079 0.126 0.148 0.069 (1.50) 0.047 (7.13) President 0.129 0.220 0.443 0.314 (4.88) 0.091 (10.89) Director 0.559 0.471 0.820 0.261 (4.09) −0.088 (−7.73) Chairman 0.096 0.149 0.410 0.314 −2.588 (−1.01) 14.345 (5.84) 0.301 (5.44) 0.022 (0.47) 0.223 (4.15) 0.349 (5.42) (4.93) 0.053 (7.26) 0.261 (5.62) Officer 0.724 0.874 0.836 0.112 (1.95) 0.150 (16.21) ( Num Insiders 5,362 3,049 61 Num Firms 1,833 1,199 49 −0.038 −0.89)
Table 2 (continued)
Panel B: Weighted Average Abnormal Returns
Horizon Statistic None Lim Spc Lim – None Spc – None Spc - Lim
6-m ders 4,94 2 Firms 1,736 1 Mean −0.003 −1.00) −0.056 (−1 −0.123 (− −0 053 72) − (− − (− −0.003 (0.027) −0 47 − (0 − ( o Insi 6 ,921 60 ,151 47 (t-statistic) ( 3.56) 2.91) . (−9. 0.120 2.82) 0.067 4.53) Median (p-value) .050 (0.000) −0.074 (0.002) −0.0 (0.000) 0.071 .001) 0.024 0.027) 3-m Insiders 5,18 60 Firms 1,794 1,177 47 Mean atistic) −0.004 (−1.68) −0.036 (−1 −0.082 (− −0.032 73) −0 (−2 − (− Median value) −0.003 (0.039) −0.024 (−0 −0.024 (0 −0 021 00) −0 (0. ( o 6 2,982 (t-st 3.32) 2.41) (−8. .078 .29) 0.046 2.29) (p- .000) .030) . (0.0 .021 020) 0.000 0.154) 1-m ers 5,362 3 s 1,833 49 Mean (t-statistic) −0.006 (−5.11) − (−10.94) − (−3.32) 0.008 (-4.18) −0 (− − ( −0.003 (0.000) −0 − 005 −0.012 (0.011) −0.007 (0.043) o Insid Firm ,049 1,199 61 0.014 0.058 − .052 2.95) 0.044 −2.26) an Medi (p-value) .008 (0.000) 0.015 (0.005) −0. (0.000)