Rochester Institute of Technology
RIT Scholar Works
Theses Thesis/Dissertation Collections
1-26-2015
Infrared Drying Parameter Optimization
Matthew R. JacksonFollow this and additional works at:http://scholarworks.rit.edu/theses
This Thesis is brought to you for free and open access by the Thesis/Dissertation Collections at RIT Scholar Works. It has been accepted for inclusion in Theses by an authorized administrator of RIT Scholar Works. For more information, please [email protected].
Recommended Citation
Infrared Drying Parameter
Optimization
Matthew R. Jackson
Thesis submitted to the Faculty of the
Rochester Institute of Technology
In partial fulfillment of the requirements for the degree of
Master of Science
in
Industrial Engineering
Thesis Committee
Dr. Denis Cormier
Dr. Brian Thorn
Department of Industrial and Systems Engineering
DEPARTMENT OF INDUSTRIAL AND SYSTEMS ENGINEERING
KATE GLEASON COLLEGE OF ENGINEERING
ROCHESTER INSTITUTE OF TECHNOLOGY
ROCHESTER, NEW YORK
CERTIFICATE OF APPROVAL
January 26, 2015
M.S. DEGREE THESIS
The M.S. Degree Thesis of Matthew Jackson
has been examined and approved by the
Thesis committee as satisfactory for the
Thesis requirement for the
Master of Science degree
Approved by:
Dr. Denis Cormier, Thesis Advisor
i
Abstract
In recent years, much research has been done to explore direct printing methods,
such as screen and inkjet printing, as alternatives to the traditional lithographic process.
The primary motivation is reduction of the material costs associated with producing
common electronic devices. Much of this research has focused on developing inkjet or
screen paste formulations that can be printed on a variety of substrates, and which have
similar conductivity performance to the materials currently used in the manufacturing of
circuit boards and other electronic devices. Very little research has been done to develop
a process that would use direct printing methods to manufacture electronic devices in
high volumes.
This study focuses on developing and optimizing a drying process for conductive
copper ink in a high volume manufacturing setting. Using an infrared (IR) dryer, it was
determined that conductive copper prints could be dried in seconds or minutes as opposed
to tens of minutes or hours that it would take with other drying devices, such as a vacuum
oven. In addition, this study also identifies significant parameters that can affect the
conductivity of IR dried prints. Using designed experiments and statistical analysis; the
dryer parameters were optimized to produce the best conductivity performance for a
specific ink formulation and substrate combination. It was determined that for an
ethylene glycol, butanol, 1-methoxy 2- propanol ink formulation printed on Kapton, the
optimal drying parameters consisted of a dryer height of 4 inches, a temperature setting
between 190 - 200°C, and a dry time of 50-65 seconds depending on the printed film
thickness as determined by the number of print passes.
It is important to note that these parameters are optimized specifically for the ink
formulation and substrate used in this study. There is still much research that needs to be
done into optimizing the IR dryer for different ink substrate combinations, as well as
developing a control system to ensure that prints continuously dry the same way. In
addition to the repeatability study, experimenting with the feasibility of using single pass
prints with repeatable performance would also be a worthwhile study. A single print pass
will reduce cycle time, and will reduce ink consumption when compared with double
ii Contents
1 Introduction ... 1
2 Literature Review ... 3
3 Methodology ... 14
3.1 Screening Experiments ... 14
3.2 Final Designed Experiment ... 18
4 Results ... 25
4.1 Feasibility of IR Drying ... 25
4.2 Characterization of Vastex Dryer ... 36
4.3 Designed Experiment and Statistical Analysis ... 41
5 Conclusions and Future Work ... 57
6 References ... 59
7 Appendix ... 61
A. Minitab output for double pass four inch dryer height prints ... 61
iii List of Tables
Table 1: Summary of initial experimental space explored ... 17
Table 2: IR dryer parameter used in experiment to characterize heat setting ... 19
Table 3: IR dryer parameters for prints dried at a height of 2 inches ... 22
Table 4: IR dryer parameters for prints dried at a height of 4 inches ... 22
Table 5: Settings for IR dryer and Xenon sintering system used in the final experiment ... 24
Table 6: Thermal conductivity properties of common materials ... 29
Table 7: P-values for 4 inch 2 pass factorial analysis ... 43
Table 8: P-values for 4 inch 2 pass response surface analysis... 46
Table 9: P-values for 3 inch 1 pass factorial analysis ... 51
iv List of Figures
Figure 1: Subtractive lithographic process vs. additive direct printing process [2] --- 2
Figure 2: Piezoelectric drop ejection [1] --- 3
Figure 3: Example of a screen printer --- 4
Figure 4: Example of a vacuum oven --- 5
Figure 5: Example of a tube furnace --- 6
Figure 6: Example of an infrared (IR) dryer --- 6
Figure 7: Novacentrix pulseforge system --- 8
Figure 8: Xenon flash system --- 8
Figure 9: Intrinsiq LAPS-60 laser sintering system --- 9
Figure 10: Afford-A-Flash infrared dryer --- 14
Figure 11: Inkjet print on kapton --- 15
Figure 12: Fishbone diagram to identify sources of within experiment variability --- 17
Figure 13: Vastex IR drying system --- 18
Figure 14: Belt speed settings as a function of time --- 19
Figure 15a,b,c,d: Substrate temperature for glass and kapton at specific dryer heights and heat settings --- 20
Figure 16a,b: Thermal map at the highest heat setting at height of 2 (a) and 4 (b) inches --- 21
Figure 17: Resistance values ranging between 17 and 30Ω were achieved using low dryer heights and short dry times --- 25
Figure 18: Similar resistance values were achieved using high dryer heights, less dryer power and longer dry times --- 26
Figure 19: Example of an over-dried IR print --- 27
Figure 20: IR dried prints preformed slightly better than vacuum oven dried prints --- 27
Figure 21: Hypothesis test comparing the average resistance of IR dried prints to oven dried prints --- 28
Figure 22: Resistance data for prints sintered within 30 minutes of drying --- 30
Figure 23: Resistance data for prints sintered 3 hours after drying --- 30
Figure 24: Hypothesis test comparing the average resistance of prints sintered immediately after drying to prints sintered three hours after drying --- 31
v Figure 26: Oven dried prints made with standard dots per inch (1270) and higher dots per inch
(1693) --- 32
Figure 27: Resistance range for IR dried prints with two different dots per inch settings --- 33
Figure 28: Resistance range for oven dried prints with two different dots per inch settings --- 34
Figure 29: The temperature in the center of the IR dryer is higher since it caused more discoloration --- 35
Figure 30: Resistance data for IR and oven dried prints at 2 inches --- 36
Figure 31: Resistance data for IR dried and oven dried prints at 4 inches --- 36
Figure 32: Hypothesis test for 1 pass prints dried at 2 inches with the new IR dryer and the oven --- 38
Figure 33: Hypothesis test for 1 pass prints dried at 4 inches with the new IR dryer and the oven --- 38
Figure 34: Resistance data for double pass IR and oven dried prints at 4 inches --- 39
Figure 35: Hypothesis test for 2 pass prints dried at 4 inches with new IR dryer and oven --- 40
Figure 36: Factorial analysis main effects plots for 4 inch 2 pass prints --- 42
Figure 37: Factorial analysis interactions plots for 4 inch 2 pass prints --- 42
Figure 38: Factorial analysis residuals plots for 4 inch 2 pass prints --- 44
Figure 39: Response variable vs. fitted values for 4 inch 2 pass prints --- 44
Figure 40: Contour plots for double pass 4 inch dried prints--- 45
Figure 41: Residual plots for response surface analysis of double pass 4 inch dried prints --- 47
Figure 42: Response variable vs. fitted values for 4 inch 2 pass prints --- 47
Figure 43: Sintered and unsintered IR dried two pass print at a height of 4 inches --- 48
Figure 44: Sintered and unsintered IR dried single pass print at a height of 3 inches --- 49
Figure 45: Factorial analysis main effects plots for 3 inch 1 pass prints --- 50
Figure 46: Factorial analysis interactions plots for 3 inch single pass prints --- 50
Figure 47: Factorial analysis residual plots for 3 inch single pass prints --- 52
Figure 48: Response variable vs. fitted values for 3 inch single pass prints --- 52
Figure 49: Contour plots for 3 inch single pass prints --- 53
Figure 50: Response surface residual plots for 3 inch single pass prints --- 54
Figure 51: Response variable vs. fitted values for 3 inch single pass prints --- 55
1
1
Introduction
In the world of electronic devices, controlling the location and amount of material
coated onto a substrate has always been important. Lithographic processes are typically
used to make circuit boards, semiconductors, and other electronic devices. These
processes require several steps, which involve coating a given substrate with a layer of
photosensitive material to be patterned, and then using a mask and chemicals to remove
selected material from the layer. If the resulting pattern is correct, additional chemical
processing transfers the pattern to the layer beneath the photosensitive material. The
photo resist material is then stripped away and the sample cleaned. This process serves
the purpose of controlling where and how much conductive material remains on the
substrate. This process is referred to as a subtractive process, since it involves taking
material away. It results in a significant amount of wasted material, it has pattern design
limitations, and there may be difficulty aligning congruent images if either the mask or
the substrate expands or shrinks during drying [1].
As a result of these challenges with traditional lithographic processes, other coating
techniques have been explored to see if it was possible to develop a method that only
deposited material where it was needed. Printing methods such as inkjet and screen
printing quickly became areas of focus, as these methods would allow those designing
various electronic devices, such as circuit boards and other electronic devices, to only put
material where it was needed, and eliminate several other steps from the traditional
lithographic process. A comparison of the two methods can be found in Figure 1. Direct
printing methods, such as inkjet and screen printing, reduce the waste of material,
chemicals, and photoresist from the etching process. In addition, these methods eliminate
design restrictions and difficulty aligning images. However, inkjet and screen printing
methods require the development of electronic materials in the form of inks and pastes so
that they can be printed onto a given substrate. As a result conductive inks and pastes
have become a major area of research within the last decade. The focus of this work is on
copper inks, since they offer a cheaper alternative to silver based inks, and could be
2 Figure 1: Subtractive lithographic process vs. additive direct printing process [2]
Lithographic Process
3
2
Literature Review
Conductive inks and pastes are much different than just simple metal conductors.
Specifically, inks consist of metal particles, in some cases an organic polymer, and
solvent [3]. Inks are typically made with spherical nano-sized particles, and usually have
a low viscosity so that they can be printed easily. This requires a relatively low solid
loading fraction (the amount of conductive particles) in order to keep the viscosity low.
These inks are usually printed through piezoelectric print heads in an industrial setting.
Piezoelectric print heads contain micro-machined chambers with one or more walls
fabricated from a ceramic, such lead-zirconate-titanate (PZT). The piezoelectric expands
or contracts when a voltage is placed on it. This mechanical deflection creates a volume
change within the chamber and an acoustic wave, which drives a droplet of liquid
through the hole in the nozzle plate of the print head [1]. This process can be seen in
Figure 2.
Figure 2: Piezoelectric drop ejection [1]
Pastes, on the other hand, use mostly micron size particles with a mix of
nano-sized particles in order to maximize packing density. The shape of the micron-nano-sized
+
-a) Voltage flexes membrane expanding volume
4
particles, for example flakes or spheres, can also be varied to increase packing density.
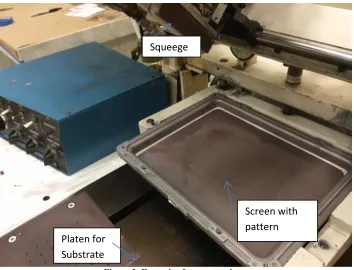
Pastes are typically printed using a screen printer, which can be seen in Figure 3. A
screen printer consists of a screen, which has a designed pattern, and a squeegee that is
controlled automatically. The screen paste is placed directly on the screen, and the
substrate that is to be coated with the paste is placed on a platen underneath the screen.
The squeegee then moves across the screen and forces the paste through the holes in
[image:12.612.130.484.214.484.2]screen and onto the substrate.
Figure 3: Example of a screen printer
After the inks and pastes are printed, they are usually dried using heat provided by
some type of an oven or a furnace. All materials have basic properties, one of which is
their melting point. These properties are usually cited for bulk materials, which are
processed to obtain a maximum density. Thin films are often less dense than bulk
materials, and therefore may exhibit different properties. For conductive inks, it has been
reported that when the size of the metal particles decreases below 100 nm, their thermal
processing temperature is much lower [4]. As a result there are several different types of
ovens and furnaces that can be used to dry conductive inks and pastes.
Squeege e
Platen for Substrate
5
In the processing of conductive inks, it is important to understand that there is a
difference between drying and sintering. The drying process refers mainly to solvent
removal from the printed pattern. Sintering is where the distance between the particles
decrease to the point where the particles touch and are fused together forming and infinite
network, thus making the ink or paste conductive [2]. For some inks, drying and sintering
can happen in the same step. However, this is not necessarily the case for all inks.
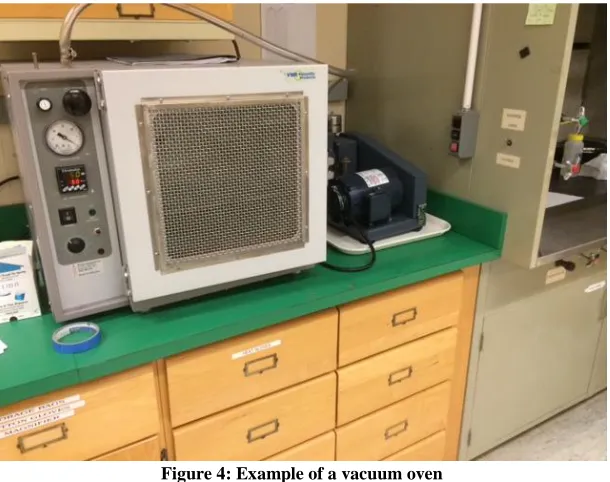
One of the most common drying tools currently being used is a vacuum oven, seen in
Figure 4. Because this tool dries inks and pastes under vacuum, solvent volatilization can
happen at very low temperatures and allows for clean burn-off and evaporation of
solvents. However, if a low drying temperature is used, the drying time will need to be
[image:13.612.155.460.298.539.2]increased in order to remove all the solvent.
Figure 4: Example of a vacuum oven
Another common drying tool is a tube furnace, which can be seen in Figure 5. A tube
furnace allows users to dry inks and pastes at much higher temperatures than a vacuum
oven. It allows users to program specific drying conditions that control the rate at which
the furnace heats, which can be very important for certain substrates. The tube furnace
can have a controlled atmosphere, such as Argon, as opposed to vacuum or air. Since
tube furnaces are readily available, they are also used to evaporate solvents from
6 Figure 5: Example of a tube furnace
While vacuum ovens and tube furnaces are commonly used in laboratories and
research settings, they may not be practical for high volume manufacturing lines, such as
those used in roll to roll printing. One of the more common techniques used in roll to roll
printing is infrared (IR) drying, which can be seen in Figure 6. This dryer transfers
energy through electromagnetic radiation and can be used in either atmosphere or
vacuum. It is preferred for roll to roll printing processes because it is a noncontact form
of drying. Also, the drying time for conductive inks and pastes is seconds or minutes as
opposed tens of minutes or hours required for vacuum ovens.
Figure 6: Example of an infrared (IR) dryer
During the drying process, the solvent is volatized and removed from the print. This
may result in a reduction in the distance between the metal particles. Depending on
7
sintering process may also happen during the drying step. For example, silver inks and
pastes can be dried and sintered simultaneously. This is due in part to the fact the
nano-size silver is relatively easy to produce, and because the melting point of silver is
significantly reduced when it is less than 100 nm in size, which results in minimal energy
being needed to sinter it [4]. The melting point of bulk silver is typically 960°C.
However, the melting point drops to around 150°C for silver nanoparticles under
approximately 100 nm. Silver can also be sintered and dried simultaneously since silver
oxide is conductive.
Copper inks and pastes, on the other hand, require separate drying and sintering steps.
This is partially due to the fact that copper requires significantly more energy to sinter
than silver does. The melting point of bulk copper is 1085°C, roughly 125°C higher than
that of silver. This difference in melting point holds true for these two materials even
when they are of a size smaller than 100 nm. Furthermore, nano-size copper is difficult to
produce. The biggest reason a separate sintering step is required for copper is because
copper oxide forms when it is handled in air for an extended period of time. This
significantly hinders conductivity [4]. In order to prevent oxidation of the copper
particles, they are usually coated with a polymer. This also helps with dispersion of the
particles in a solvent system. In order for these inks and pastes to become conductive, the
polymer must be removed from the particles so they can fuse together. This happens
during the separate sintering step. One method involves exposing the copper prints to a
quick pulse of UV light, which removes the polymer from the particles, reduces any
oxide on the particles, and fuses them together. The most common pieces of equipment
on the market specifically made for sintering materials with UV light, such as copper, are
the Xenon Flash system and the Novacentrix Pulse Forge system.
Both systems operate on the principle that using shorter duration pulses results in a
higher peak power of energy being delivered to the material. This higher peak power
means that more energy can be put into the material, which enhances its ability to sinter.
8
sintered in air as opposed to an inert environment. This type of sintering step is
compatible with a roll to roll printing operation [4].
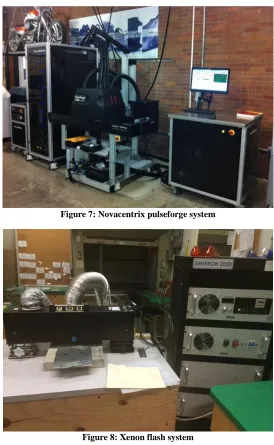
In a high volume printing operation, a flash lamp configuration with a conveyor belt,
such as the Novacentrix system shown in Figure 7, is preferred. This Novacentrix system
allows the user to control pulse width, pulse energy, and wavelength. A bench top Xenon
[image:16.612.168.442.190.635.2]Flash System more suited for laboratory experimentation is shown in Figure 8.
Figure 7: Novacentrix pulseforge system
Figure 8: Xenon flash system
While either the Novacentrix or Xenon systems can be used to sinter both inks and
screen pastes, laser sintering has recently emerged as yet another promising method for
sintering patterns with narrow lines, high metal density, and heat absorbing substrates.
9
together. It is important, when sintering copper with a laser, to move the laser at a speed
slow enough for it to penetrate the material, but rapidly enough so that it sinters the entire
pattern before the copper can oxidize [5]. An example of a laser sintering system can be
seen in Figure 9.
Figure 9: Intrinsiq LAPS-60 laser sintering system
After the sintering step is complete, there are sometimes visible defects in the printed
pattern. Some common defects in both inkjet and screen printed patterns are cracks and
adhesion failures. Cracking occurs due the larger volume reduction that may happen
when prints are being sintered and the protective organic polymer is being removed to
make the structure more dense and conductive. As a result of cracking, the print has poor
adhesion to the substrate, and very poor electrical conductivity [6]. In order to achieve
good electrical conductivity, poor adhesion and cracking must be eliminated. One
possible solution to limiting cracking and getting better substrate adhesion is using
nano-sized glass frit. If a glass frit can be selected such that it melts during sintering and can
form a stable dispersion with the metallic nanoparticles without clogging the print head
nozzles, resistivities of 2.52 * 10-2 Ω-m have been achieved with silver inks [7]. By
comparison, the bulk resistivity of silver is 1.59 *10−8Ω-m.
After learning about the additional steps and equipment needed to sinter copper
materials, one may ask the question “Why use copper when silver is so much easier to work with?” What makes copper attractive for applications where silver is currently
being used, such as Organic Light Emitting Diodes (OLEDs), Photovoltaics, Radio
Frequency Identifiers (RFID’s), etc., is the significant cost savings that comes from using
10
which makes them impractical to use in high volume, low cost applications [8]. This
makes copper an attractive alternative.
While the market for printed electronics has started to materialize, the focus of
research has begun to shift to developing cost effective solutions for printed electronics
applications. Ian Clark, marketing and sales director for Intrinsiq Materials, said
“Although there are few commercial applications for copper inks so far, it is likely that
this will change in the next one to three years as the various development programs
designed to integrate more cost effective copper inks into the manufacturing processes for
electronic devices come to fruition. There is a lot of development activity in the area, not
only from the ink suppliers like ourselves, but also from the print head makers and the
manufacturers of laser and broad band flash curing equipment” [9]. As copper continues
to be an area of focus for researchers, it is important that they take into consideration the
manufacturability of their final product. This means ensuring that their final product will
perform well when using equipment that is well suited for high volume production, such
as a roll to roll printing process. In depth understanding and testing of the product must
be done with equipment that will be used in a high volume printing operation.
A study was done with silver ink, comparing prints on glass that were dried in a
conventional heat oven and an IR dryer. Since silver can be dried and sintered in the
same step, both conventional and IR drying can produce conductive prints. The oven
dried print was dried at 200°C for 5 minutes and produced a sheet resistance of 1.2 Ω/□,
while an identical print was dried under the IR dryer for 3 minutes and produced a similar
sheet resistance of 1.0 Ω/□. The study also provided evidence that the substrate is a
critical parameter in determining drying time, as it significantly affects sintering
efficiency. Two prints, one on glass and one on paper were dried under the IR dryer at a
height of 6 cm for 2 minutes. The glass substrate print heated to 140°C, and had a sheet
resistance of 351.2 Ω/□, while the paper substrate print reached 210°C and had a sheet
resistance of 1.97 Ω/□ [10].
Another study suggested using a hybrid drying process of hot air first, followed by IR
11
were printed on polyethylene terephthalate (PET). It was found that using only IR to dry
these prints resulted in wrinkling of the PET and variation in the sheet resistance values.
Alternatively, drying with only hot air resulted in stable sheet resistances, but required a
long time. In order to try to get the best of both processes, the two were combined, and it
was determined that hot air must be used prior to the IR dryer. When the IR dryer was
used first, it started to sinter the top layer of the print before all the solvent had been
removed, thus leaving solvent trapped in the print and degrading electrical conductivity.
When the sequence used hot air drying followed by an IR curing step, a final sheet
resistance value of 0.5 Ω/□ was achieved [11].
While the majority of conductive material research papers focus on silver, some
papers are starting to focus on copper screen paste. One such study was performed to
compare copper paste to silver paste in order to determine if there was any difference in
sintering performance between the two. The copper paste was cured on a hot plate at
150°C in an Argon atmosphere for 60 minutes. Argon shielding was necessary, since
curing of the copper in air resulted in poor conductivity due to the oxidation of uncoated
copper particles. The silver paste was cured in air also at 150°C for 15 minutes. The
copper paste produced a resistivity of 0.75 ∗ 10−4Ω ∗ cm, while the silver paste had a
resistivity of 0.87 ∗ 10−4Ω ∗ cm [8].The authors concluded that copper pastes were able
to provide comparable results to silver pastes.
An interesting related IR study of a copper screen paste actually suggested that
sintering copper pastes in an oxygen free environment was undesirable. The study
suggested that without oxygen, carbon based polymers, which are used to coat copper
particles, are not oxidized, meaning that they cannot reduce any oxide that is on the
particles. As a result one would see sooting, which are deposits on the surface on the
copper particles that can compromise quality of the sintering connections. An oxygen
free environment also means that pastes which contain glass frit, which is used as an
adhesion promoter, does not achieve the necessary bonding interface between the copper
print and the substrate. This results in poor adhesion and increased resistivity. One idea
12
drying atmosphere. This helped eliminate the sooting problem, and as a result, improved
adhesion and conductivity [12].
After reviewing a significant portion of the available literature on IR drying of
conductive inks and pastes, it is clear that most of the research has focused on silver inks
and pastes, since they can be sintered under the IR dryer. While there is some research
about IR drying of copper pastes, there is not a lot regarding copper inks. It is
understandable that since copper cannot be sintered under the IR dryer, that it would not
be researched as much as other inks that can be IR sintered. However, copper inks and
pastes still need to be dried in a high volume roll-to-roll printing process. IR drying is
compatible with such a process and should be explored further as a possible drying tool
for copper inks and pastes. In addition, it may be possible that use of an IR dryer for
copper inks and pastes might improve their sintering ability.
It was also apparent after reviewing the literature that there have been very few
studies done that use any sort of statistical analysis to determine the significant
parameters of an IR dryer used to dry any type of conductive material. While one study
used statistics and a mathematical model to determine the parameters for an IR dryer, it
was for drying a cotton web instead of conductive ink. It was found that drying of the
fabric was strongly affected by parameters such as the temperature of the dryer, the
dryer’s height, and speed at which the fabric moved through the dryer [13]. It may be
possible that these factors are significant in drying certain substrates that conductive ink
is printed on. The purpose of this particular study is use statistical analysis to evaluate the
significant parameters of an IR dryer used to dry copper ink and screen paste. This study
should help provide insights into a specific area of conductive ink research where there is
currently a gap in the literature.
This work focuses on exploring the possibility of using an infrared (IR) dryer to
process copper ink that is manufactured by Intrinsiq Materials for inkjet applications. The
objective is to determine which parameters on the IR dryer have a significant effect on
the drying of the inks and their performance on various substrates. Statistical analysis will
13
determine if the IR dryer will result in equal or better sintering performance when
compared with prints dried in a vacuum oven. If IR dried prints perform equally as well
as those that were oven dried, it will allow the IR dryer to replace the vacuum oven as the
preferred drying tool, thus significantly shortening the drying time, and allowing it to be
compatible with a high volume manufacturing process.
Currently, very few research papers have been written about using IR drying with
conductive inks. This is due in part to the fact that, as mentioned previously, conductive
inks are still a developing technology. Until recently, there has not been a strong focus on
using equipment that was compatible with a high volume manufacturing process. What
research has been on IR drying and conductive materials has mostly been done with
silver inks and pastes, with a few studies looking at copper screen paste. These studies
suggest that IR drying can be used successfully to sinter conductive materials, with
14
3
Methodology
3.1 Screening Experiments
Preliminary experiments were run in order to identify possibly significant IR
dryer parameters as well as sources of external variability that impact the resistance of
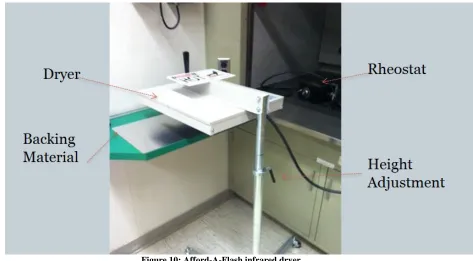
copper prints. Initial experiments were performed using an Afford-A-Flash Infrared dryer
from the Black Body Corporation. In some cases a Black Body Corporation Rheostat was
used to control the temperature of the IR dryer. Resistance performance of prints dried in
the Afford- A – Flash dryer, seen in Figure 10, was measured against benchmark oven
prints, which were dried using a VWR Scientific Products vacuum oven seen earlier in
[image:22.612.85.558.307.568.2]Figure 4.
Figure 10: Afford-A-Flash infrared dryer
The basic process flow for these experiments began with the printing step. During
the printing step, conductivity bar traces were printed on PEL Paper, Kapton, or Glass
substrates with the same dimensions for each experiment. The pads on each end of the
trace were 3 millimeters by 3 millimeters, while the line connecting the pads was 1
millimeter wide, by 91 millimeters long. Each trace was between 1 and 2 microns thick.
Each print during these experiments was made using a 3 solvent ink formulation with a
1-15
methoxy 2-propanol. All samples were printed using a Dimatix DMP-2831 inkjet
materials printer. All but one of the initial experiments was done using a drop spacing of
20 μm, with one experiment using both 15 and 20 μm in order to study laydown
variability. All prints also consisted of conductivity bars that were printed horizontally on
the substrate. For all samples printed on Kapton and Glass, prior to printing, each piece
was cleaned with IPA and then dried using a heat gun.
After the printing step, all of the prints were dried in either the vacuum oven or
the IR dryer. For all experiments prints dried in the vacuum oven were dried at a
temperature of 50°C for a duration of 1 hour. Prints were IR dried at a wide variety of
times and heights, resulting in several different temperatures that differed from one
experiment to the next. These specific parameters are shown in more detail in Table 1.
All of the prints were then sintered using the Xenon Sintron 2000 system. Each of the
conductivity bars was exposed to a different sintering voltage, which controlled the
amount of UV light energy the trace was exposed to, and ranged from 460-1400 Joules.
After each conductivity bar was sintered, resistance measurements were taken from pad
to pad using a Fluke 77 IV Multimeter in order to determine the optimal sintering point
and to understand the size of the “sintering window.” An example of a print is shown in
Figure 11.
Figure 11: Inkjet print on kapton
The initial experiments were conducted to determine which IR dryer parameters
had a significant effect on resistance performance. The IR dryer parameters of dryer
height, dry time, dryer power, and the backing material used underneath the substrate
16
material, and the IR dryer was moved over top of the print at a pre-set height. Then using
a stopwatch, the desired dry time was measured. When the time had been reached, the
dryer was moved off the print. In some cases, the temperature of the dryer was decreased
using the rheostat. The rheostat was used to decrease the power to the IR dryer in order to
reduce temperature of dryer and to see if there was an advantage to drying at a lower
temperature for a longer time.
From the first few experiments, it was found that all four of these factors were
significant. However it was observed that there was a significant amount of
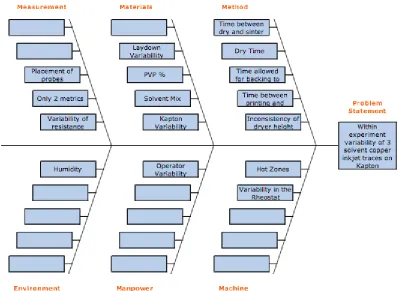
within-experiment variability. As a result, a fishbone diagram was created as shown in Figure 12
in order to brainstorm potential causes of the observed variability. It was decided that the
Machine, Method, and Materials sections should be the focus of further study, since they
were the most likely sources of variability. Additional preliminary experiments were
conducted to study time between drying and sintering, variability in the amount of ink
being put down by the Dimatix printer, and hot zones in the IR dryer, in order to
determine if any of those sources could be the cause of within experiment variability. A
summary of the experimental space explored using the Afford- A- Flash IR dryer can be
found in Table 1. The purpose of this table is to show the ranges of the various
17 Figure 12: Fishbone diagram to identify sources of within experiment variability
Table 1: Summary of initial experimental space explored
Dryer Height (inches)
Dry Time
(seconds) Substrate Rheostat (%)
Time between dry and sinter
Laydown Variability (drop spacing)
Hot
Zones? Backing Type Inks 10,20,40 PEL 30,40,45,60 Kapton 20,40 PEL 40,60 Kapton 20,40 PEL 40,60 Kapton 10,20,30,40 PEL 30,40,45,60,75,90,1 20, (3,4,5,6,7 mins) Kapton
3,4,5 minutes Glass 80 ~ 1 hour 20 µm NA Aluminum LAS-2013-5-45 Aluminum and Acrylic LAS-2012-02, LAS-2013-43 LAS-2012-02, LAS-2013-43 LAS-2012-02, LAS-2012-24, LAS-2013-43, LAS-2013-5-45 1 inch 2 inches 3 inches LAS-2012-02, LAS-2013-43 NA,100, 80 <30 mins, ~1 hour 20 µm NA
Aluminum Aluminum Parameters NA NA 1 hour 1 hour 20 µm Aluminum and Acrylic Co n d iti o n s 4 inches 20 µm 15µm,20 µm NA NA Yes NA,100, 80, 60, 40
18
In Table 1 where it says “NA” for hot zones it is important to note that hot zones
still existed at those conditions, but were not accounted for when running experiments.
Once it was discovered that hot zones were present they were only taken into account
when running experiments at a dryer height of 4 inches. No additional experiments were
run to study hot zones at lower dryer heights. It is also important to note that all the inks
listed in the table had the same solid loading fraction and 3 solvent formulation described
previously, with the main difference between each of the inks being the amount of
polymer coating on each of the copper particles.
3.2 Final Designed Experiment
While preliminary experiments were conducted using the Afford-A-Flash IR
drying system in order to demonstrate proof of concept, optimization of IR drying
parameters was done on a pilot high volume Vastex D-100 Infrared Curing System, seen
in Figure 13.
Figure 13: Vastex IR drying system
In order to be able to transfer what was learned from the Afford- A-Flash system
to the Vastex system, several characterization experiments were performed on the Vastex
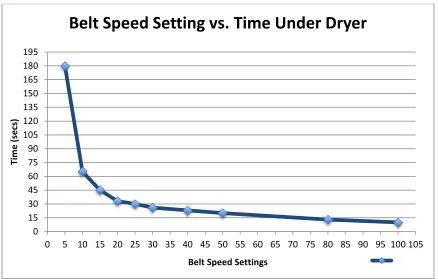
system so that the robustness of initial conclusions could be tested. The first experiment
was designed to characterize belt speed setting as a function of the time the print
remained under the dryer. In order to characterize belt speed setting, pieces of glass were
placed on the conveyor belt, and a stopwatch was used to time how long it took the pieces
of glass to pass through the dryer for a given belt speed setting. The data shown below in
Belt Speed Setting Heat Setting
19
Figure 14 provides residence times for the corresponding belt speed settings. From this
data, it was concluded that small changes at lower belt speed settings resulted in a large
difference in residence time, with the opposite being the case at higher belt speed
[image:27.612.88.526.151.430.2]settings.
Figure 14: Belt speed settings as a function of time
The second characterization experiment was designed to help determine the actual
temperature that different heat settings corresponded to. The belt speed settings and heat
settings for this experiment can be found in Table 2. All of these settings were tested at
both the 2 inch and 4 inch dryer heights.
Table 2: IR dryer parameter used in experiment to characterize heat setting
Belt Speed Setting: 5 10 15
Temperature:
4 1 print 1 print 1 print
Maximum Heat Setting
1 print 1 print 1 print
0 15 30 45 60 75 90 105 120 135 150 165 180 195
0 5 10 15 20 25 30 35 40 45 50 55 60 65 70 75 80 85 90 95 100 105
Ti
m
e
(
sec
s)
Belt Speed Settings
20
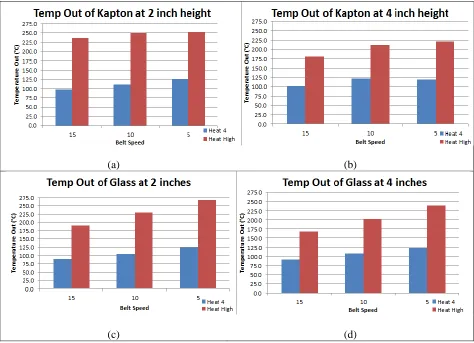
In addition to testing these settings at different dryer heights, two different
substrates, Glass and Kapton, were used at both dryer heights to test each combination of
belt speed and heat setting. Using a Fluke 62 IR thermometer, temperature data was
collected on each piece of Kapton and Glass as they exited the dryer. The results of this
experiment can be found in Figures 15(a) through 15(d). From this data, it can be
concluded that substrates reach significantly higher temperatures at lower dryer heights
and slower belt speed settings than they do at higher heights and faster belt speed
settings. It appears that both belt speed and dryer height have a significant effect on the
exit temperature of the substrate.
(a) (b)
[image:28.612.72.546.270.613.2](c) (d)
Figure 15a,b,c,d: Substrate temperature for glass and kapton at specific dryer heights and heat settings
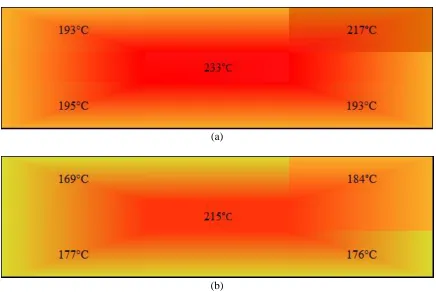
An additional experiment was run to better understand the relationship between
heat setting and temperature. After taping a thermocouple to a piece of Kapton with the
dryer height set to four inches, belt speed set to zero, and the heat setting set to its
21
dryer. The piece of Kapton was then placed under the dryer in all 4 corners and the
middle of the dryer for one minute, and the maximum temperature that was reached was
recorded. The Kapton was cooled to below 30°C in between each measurement. This
procedure was then repeated at a dryer height of two inches. Using the data from this
experiment, thermal heat maps were created at each of the two dryer heights to better
characterize the relationship between heat setting and temperature. These heat maps can
be seen in Figures 16(a) and 16(b).
(a)
[image:29.612.89.525.210.502.2](b)
Figure 16a,b: Thermal map at the highest heat setting at height of 2 (a) and 4 (b) inches
Once the characterization experiments for the Vastex system were completed,
several experiments were conducted to determine how the new IR system compared to
the vacuum oven, as well as what the optimal operating space was for the IR system. The
prints used during each of these experiments were of the same dimensions as the one
used in the preliminary experiments, shown previously in Figure 11. The process flow
for the prints in these experiments was identical to the one followed in preliminary
experiments, with a print going through the printing, drying, and sintering steps.
22
The purpose of the first experiment was to determine if a set of conditions similar
to the ones used on the Afford-A-Flash IR system could be used in the new Vastex IR
system, in order to match the resistance performance of oven dried prints. In addition to
the conditions displayed Tables 3 and 4, prints were also dried in the vacuum oven for an
hour at 50°C to be used for comparison to the IR prints.
Table 3: IR dryer parameters for prints dried at a height of 2 inches
Belt Speed Setting: 5 10 15
Temperature:
Minimum Heat Setting 1 print 1 print 1 print
4 1 print 1 print 1 print
Maximum Heat Setting 1 print 1 print 1 print
Table 4: IR dryer parameters for prints dried at a height of 4 inches
Belt Speed Setting: 5 10 15
Temperature:
4 1 print 1 print 1 print
Maximum Setting 1 print 1 print 1 print
Once it was demonstrated that the Vastex IR drying system was capable of
matching the performance of oven-dried prints, additional experiments were conducted in
order to identify the limit on the drying parameters for a specific ink and substrate
combination. The purpose of these experiments was to better define the operating space
for Intrinsiq’s ink so that the IR dryer parameters could be optimized through the use of a
designed experiment (DOE). Specifically, these experiments helped to determine the
maximum belt speed setting that the dryer could be run at by determining the setting at
which prints were no longer coming out of the dryer dry, even with the maximum energy
input. Maximum energy input was defined by setting the dryer at its lowest height and its
highest heat setting. The experiment then involved increasing the belt speed setting until
a setting was reached where the prints visibly were no longer being fully dried. By
defining the limits for each of the dryer parameters, it helped narrow the operating space
of the dryer and made designing the experiment for optimizing the dryer parameters
23
After completing the characterization and parameter limiting experiments, a final
experiment was designed to identify the optimal IR drying parameters for a specific
substrate and ink system. This experiment was conducted using a the same 3-solvent ink
formulation, of ethylene glycol, butonal, 1-methoxy 2-propanol with a 12% solid loading
fraction, and a fresh Dimatix 10 pico liter print cartridge. When transferring the ink from
its storage jar into the Dimatix print cartridge, it was stirred for 1 minute and then passed
through a 5-µm filter. All the prints for a specific height setting and specified number of
print pass were made on the same day with the same cartridge in order to eliminate
cartridge age or ink age as potential sources of variability in the experiment. A new
cartridge was then used the following day for a different height and number of printed
passes combination. Standard cartridge settings, meaning a cartridge temperature of 45°C
with a voltage setting of 34, and a drop spacing of 20μm were used for all the prints. All
prints were printed on the inside roll face of 5 mil thick Kapton, and were either single or
double pass. The time between printing and drying was held constant at 10 minutes for
each print.
Once the prints were dried, they were then sintered within a few hours using the
Xenon system with PFN 2 settings, meaning a UV light pulse 1 millisecond in duration,
on a white acrylic backing and a lamp height of 1.5 inches. Prior to the sintering of each
trace, the lamp was preflashed to ensure the prints were being exposed at the desired
sintering voltage. After each print was sintered, a lint free rag was used to wipe down the
lamp to ensure no blow off was stuck to the lamp which could cause scattering of the UV
sintering light leading to variable curing intensity on subsequent flashes. The Fluke
voltmeter was again used to measure the resistance of sintered traces, which was the
response variable for this experiment. Table 5 shows the conditions for each parameter
24 Table 5: Settings for IR dryer and Xenon sintering system used in the final experiment
Height (inches) Conveyor Speed (setting)
Heat (setting) Voltage (kv)
3 10,15, 20 5,6,High 2.7, 2.9, 3.1
4 10,15, 20 5,6,High 2.7, 2.9, 3.1
The prints were run and sintered in the following random order for both single
and double pass prints. Factor a= height, Factor b= speed, Factor c= heat, Factor d=
voltage. For Factors b,c, and d, lower case letters indicate the lowest parameter setting,
while uppercase indicates the middle setting, and uppercase and underlined indicates the
highest setting. For “A” lower case indicates a height of 3 inches, and uppercase indicates
a height of 4 inches.
1) aBcdDD = 3in, 15, 5, 2.7, 2.9, 3.1
2) abcdDD = 3in, 10, 5, 2.7, 2.9, 3.1
3) aBcdDD = 3in, 20, 5, 2.7, 2.9, 3.1
4) abCdDD = 3in, 10, 6, 2.7, 2.9, 3.1
5) aBCdDD = 3in, 15, 6, 2.7, 2.9, 3.1
6) aBCdDD = 3in, 20, 6, 2.7, 2.9, 3.1
7) aBCdDD = 3in, 20, High, 2.7, 2.9, 3.1
8) abCdDD = 3in, 10, High, 2.7, 2.9, 3.1
9) aBCdDD = 3in, 15,High, 2.7, 2.9, 3.1
The above conditions were completed a total of 3 times. Once the above conditions had
been repeated 3 times, the height was increased from three to four inches, meaning all “a”
s became “A” s, and then the cycle repeated again. Once the second cycle was complete,
25
4
Results
4.1 Feasibility of IR Drying
After the initial experiments were performed, a basic understanding of the
Afford-A-Flash IR Drying system had been achieved. The effects of dryer height, dry time and
dryer power on sintering performance had been evaluated. It was determined that these
parameters created a “drying continuum”, meaning that a similar amount of energy could
be put into prints at significantly different sets of conditions. For example, Figures 17 and
18 show the sintering curves for two different experiments. The x-axis of the two graphs
shows the voltage that was sent to the UV lamp to sinter each conductivity bar, and the
y-axis shows the resulting resistance of that bar. The main difference between the two
graphs is that Figure 17 shows results of the prints done using full dryer power, 1 inch
dryer height, and short dry times, while prints in Figure 18 were dried for much longer
times at a height of 4 inches, with decreased dryer power, which was controlled by a
rheostat. Despite the significant difference in conditions, both graphs show most
resistances falling between 17Ω and 30Ω. Therefore it can be concluded that a similar
amount of energy could be put into prints at significantly different sets of conditions.
Figure 17: Resistance values ranging between 17 and 30Ω were achieved using low dryer heights and short dry times
15 20 25 30 35
2.2 2.3 2.4 2.5 2.6 2.7 2.8 2.9 3 3.1 3.2 3.3
M
in
im
u
m
R
e
si
stan
ce
,
Ω
Voltage (kV)
26 Figure 18: Similar resistance values were achieved using high dryer heights, less dryer power and longer dry
times
Through these initial experiments it was also learned that it was much easier to
“over-dry” a print under the IR dryer than it is when drying a print in the vacuum oven.
An example of an over dried print can be seen in Figure 19. Figure 19 shows a series of 4
prints, all of which were dried at a height of 1 inch for 30, 45, 60, and 75 seconds,
respectively. While the sintered bars in the 30 and 45 second prints had a clear copper
color, the sintered traces in the 60 and 75 second prints have a much darker color. Figure
19 shows one of the unsintered traces that was dried for 75 seconds. There is a somewhat
bluish color, which is significantly different from the black color typically observed for
unsintered traces. Although not as obvious in the photo, this color change was also
observed in the 60 second dried print. Of the 4 prints, the best resistance observed was
7Ω, which was measured on the sample that was dried for 45 seconds. The best resistance number observed on the 60 second dried print was 28.2Ω, and an open circuit on the 75
second dried print. Between the resistance data and the observed color change, this
suggests that the 60 and 75 second dried prints were over-dried, which caused the copper
particles to oxidize giving the traces the blue color.
15 20 25 30 35
2 2.1 2.2 2.3 2.4 2.5 2.6 2.7 2.8 2.9 3 3.1 3.2
R
e
si
stan
ce
(
Ω
)
Voltage (kV)
27 Figure 19: Example of an over-dried IR print
After these preliminary experiments were conducted, it had been determined that
IR dried prints were comparable to prints that were oven dried. Data to support this can
be found in Figure 20. From the graph, one can conclude that IR dried samples had
slightly better sintering performance. Drop spacing refers to the distance between the
[image:35.612.144.469.71.316.2]centers of each of the drops coming out of the Dimatix printer as the print is being made.
Figure 20: IR dried prints preformed slightly better than vacuum oven dried prints
In order to confirm these graphical conclusions, a hypothesis test was performed
to determine if the average resistance of IR dried traces and the average resistance of
oven dried traces were statistically different. Figure 21 shows that a p-value of less than
4.00 8.00 12.00 16.00 20.00 24.00 28.00
2.10 2.20 2.30 2.40 2.50 2.60 2.70 2.80 2.90 3.00 3.10 3.20 3.30 3.40
Re
si
stanc
e
(
Ω
)
Voltage (kV)
28
0.0001 was calculated for this test. That means that at α=0.05, it can be concluded that
the average resistance of 15.3 Ω for IR dried prints is statistically different from the
average resistance of 18.8 Ω for oven dried prints.
Figure 21: Hypothesis test comparing the average resistance of IR dried prints to oven dried prints
Although the IR dried prints performed as well as the vacuum oven dried prints,
there was a significant amount of variability within some of the initial experiments. As a
result, experimentation was done to try to identify and control sources of variability. The
first potential source of within-experiment variability studied was the backing material
used underneath the substrate being dried. This factor was studied because different
materials have different thermal conductivities, which means that some materials
dissipate heat faster than others. This may have a significant impact on the temperature
profile of copper during drying and sintering. The thermal conductivity of some common
materials can be found in Table 6. The two backing materials studied were aluminum and
29
0.250 inches thick. It was found that after a duration of 2 minutes under the IR dryer at a
height of 4 inches, the aluminum reached 355°C, while the acrylic only reached a
maximum temperature of 160°C. While, it took the aluminum only 30 seconds to cool
back to 23°C, it took the acrylic nearly one hour, which was not acceptable from a
repeatability standpoint. It was determined that the ideal backing material should be one
that does not get too hot to avoid damaging the substrate, as well as one that cools rapidly
so that it does not affect repeatability.
Table 6: Thermal conductivity properties of common materials
Another possible source of within-experiment variability that was analyzed was
whether or not the time between drying and sintering was a significant factor. The reason
this factor might cause variability is that prior to or during the drying process, the
polymer coating on the copper particles could degrade. Degradation of the polymer
coating would increase the probability of oxidation of the copper particles, which would
increase with time, and significantly affect conductivity. An experiment was conducted
which involved making 2 sets of prints and drying them under the same set of conditions
within the same time period. One of these sets was sintered right away, and the other was
sintered three hours later. Based on the data collected and displayed in Figures 22 and 23,
the time between drying and sintering did not have a significant impact on sintering
performance for the sintering delay tested. Therefore it can be concluded that time
between drying and sintering is not an important parameter provided the sintering is done
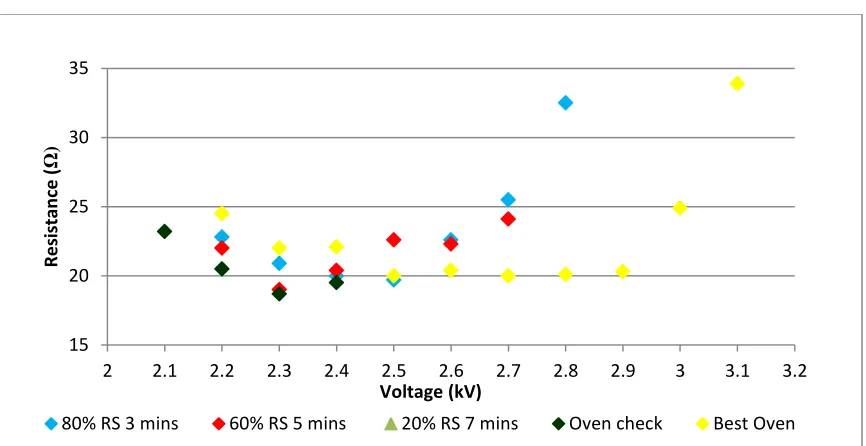
30 Figure 22: Resistance data for prints sintered within 30 minutes of drying
Figure 23: Resistance data for prints sintered 3 hours after drying
In order to confirm these graphical conclusions, a hypothesis test was performed
to determine if the average resistance of traces sintered immediately after drying and the
average resistance of traces sintered three hours after drying were statistically different.
Figure 24 shows that a p-value of 0.1254 was calculated for this test. That means that at
α=0.05 it can be concluded that there is no statistically significant difference between the
10 15 20 25 30 35 40 45
2.1 2.2 2.3 2.4 2.5 2.6 2.7 2.8 2.9 3 3.1 3.2
R
e
si
stan
ce
,
Ω
Voltage (kV)
4 in 30 sec 4 in 45 sec 4 in 60 sec 4 in 90 sec 4 in 45 sec No RS Oven Check
10 15 20 25 30 35 40 45
2.1 2.2 2.3 2.4 2.5 2.6 2.7 2.8 2.9 3 3.1 3.2
R
e
si
stan
ce
,
Ω
Voltage (kV)
31
average resistance of prints sintered immediately after drying and prints sintered three
hours after drying.
Figure 24: Hypothesis test comparing the average resistance of prints sintered immediately after drying to prints sintered three hours after drying
Experimentation was also done to determine if printer laydown variability, or
variability in drop spacing, was a possible source of within-experiment variability. Prior
to the experiment, all of the prints that had been analyzed were printed with a single pass
and a standard drop spacing of 20µm. A 20 µm drop spacing corresponds to 1270 dots
per inch, or DPI as it appears in the figures. It was hypothesized that this spacing may be
32
hypothesis, three prints were made at the standard drop spacing and three prints were
made at a drop spacing of 15µm (1693 dots per inch). All six prints were then dried under
the IR dryer and sintered so that resistance measurements could be taken. This same
experiment was repeated again with 6 prints being made, 3 at a drop spacing of 20μm and
3 at drop spacing of 15μm. The difference with the repeat experiment was that instead of
drying prints with the IR Dryer, prints were dried using the vacuum oven. Figures 25 and
26 below show a comparison of the IR and vacuum oven data collected from these two
[image:40.612.95.524.229.641.2]experiments.
Figure 25: IR dried prints made with standard dots per inch (1270) and higher dots per inch (1693)
Figure 26: Oven dried prints made with standard dots per inch (1270) and higher dots per inch (1693)
From Figures 25 and 26 it can be concluded that there is definitely laydown
variability occurring regardless of whether the print is IR or oven dried. It was also
observed that the prints made with a drop spacing of 15µm out performed those with the
10 12 14 16 18 20 22 24
2.3 2.4 2.5 2.6 2.7 2.8 2.9 3 3.1 3.2
R e si stan ce ( Ω ) Voltage (kV)
3 mins STD DPI(1) 3 mins STD DPI(2) 3 mins STD DPI (3) 3 mins High DPI(1) 3 mins High DPI(2) 3 mins High DPI (3)
10 12 14 16 18 20 22 24
2.2 2.3 2.4 2.5 2.6 2.7 2.8 2.9 3 3.1 3.2 3.3
R e si stan ce ( Ω ) Voltage (kV)
33
standard drop spacing of 20µm in both drying systems. Figures 27 and 28 show range
data that was calculated for each drop spacing condition at each sintering voltage. Since 3
prints were made at each drop spacing condition and sintered at the same set of voltages,
the difference between the highest and lowest resistance values at each sintering voltage
were calculated in order to quantify variability. This was done for both the prints dried in
[image:41.612.90.525.214.457.2]the vacuum oven as well as the prints dried using the IR Dryer.
Figure 27: Resistance range for IR dried prints with two different dots per inch settings
0 1 2 3 4 5 6
2.3 2.5 2.7 2.9 3.1 3.3
R
e
si
stan
ce
r
an
ge
, Ω
Voltage, kV
34 Figure 28: Resistance range for oven dried prints with two different dots per inch settings
Figures 27 and 28 show the resistance range of the 3 prints, or the variability at
each specific drop spacing condition, in both the vacuum oven and IR systems. The
graphs also shows the range, or variability, between the two drop spacing conditions
which is represented in the figures by the “Both DPI” series. From this data, it was
determined that near the optimum sintering voltage, which is roughly 2.3 or 2.4 kilovolts
based on Figures 25 and 26, the oven is more reproducible than the IR dryer. This was
determined by comparing the range values 2.3 and 2.4 in Figure 28 to the same values in
Figure 27. In the oven system, the range values at those voltages fall between zero and
three, but in the IR system, the range values fall between two and five at the same
voltages. However, once moving away from the optimum sintering voltage, the oven’s
reproducibility begins to decrease significantly, while it continues to stay constant for the
IR dryer. Therefore the IR dryer offers wider process latitude, and as long it is controlled
is not a source of within experiment variability.
The last factor that was studied as a potential source of within experiment
variability was the possibility of hot zones in the IR dryer. Initially, a simple test was
done to determine if any hot zones existed under the Afford- A- Flash IR dryer as well as
their location. This test involved taping off the perimeter of the IR dryer, and placing
0 1 2 3 4 5 6 7 8
2.2 2.4 2.6 2.8 3 3.2
R
e
si
stan
ce
r
an
ge
, Ω
Voltage, kV
35
white photo paper underneath the dryer for an extended period of time so that the paper
would begin to change color. A picture of this test can be seen in Figure 29.
Figure 29: The temperature in the center of the IR dryer is higher since it caused more discoloration
Figure 29 clearly shows that the center of the paper was discolored much more
than other areas of the dryer, implying that the temperature in the center of the dryer was
higher than it was on the outer edges of the dryer. This indicated that hot zones do exist,
are a source of variability, and need to be taken into account when running IR
experiments.
While initial experiments proved that IR dried prints could match the performance
of oven dried prints, follow up experiments indicated that there are some sources of
within-experiment variability that can affect the resistance results of each experiment.
Several of these factors were explored, and their impact on resistance performance
evaluated so that they could be controlled in future experiments. While there are still
other possible sources of external variability that could be evaluated, the decision was
made to switch drying systems to a Vastex dryer, which is a pilot roll-to-roll system, to
try to eliminate some of the external sources of variability that were present in the
36 4.2 Characterization of Vastex Dryer
Prior to optimizing the dryer parameters, an experiment had to be conducted in
order to determine if prints dried in the pilot high volume Vastex system could match the
conductivity performance of those dried in the vacuum oven. Once the characterization
experiments discussed in the methodology section were completed, this comparison
experiment was executed. Single pass prints were made on Kapton, and data was
collected at 2 different dryer heights. The results of the experiment can be seen in Figures
30 and 31.
[image:44.612.108.500.258.468.2]Figure 30: Resistance data for IR and oven dried prints at 2 inches
Figure 31: Resistance data for IR dried and oven dried prints at 4 inches
15 20 25 30 35 40 45 50 55 60
1.9 2 2.1 2.2 2.3 2.4 2.5 2.6 2.7 2.8 2.9 3 3.1 3.2 3.3 3.4
R e si stan ce ( Ω ) Voltage (kV)
Resistance Oven Dry Resistance IR-Heat:low Belt:15 Resistance IR-Heat:low Belt:10 Resistance IR-Heat:low Belt:5 Resistance IR-Heat:4 Belt:15 Resistance IR-Heat:4 Belt:10 Resistance IR-Heat:4 Belt:5 Resistance IR-Heat:high Belt:15 Resistance IR-Heat:high Belt:10
Resistance IR-Heat:high Belt:5 Best Oven (1) Best Oven (2)
10 14 18 22 26 30 34 38 42
2.1 2.2 2.3 2.4 2.5 2.6 2.7 2.8 2.9 3 3.1 3.2 3.3 3.4
R e si stan ce ( Ω ) Voltage (kV)
Oven Dry IR-Heat:4 Belt:15 IR-Heat:4 Belt:10 IR-Heat:4 Belt:5 IR-Heat:high Belt:15
37
From Figures 30 and 31, it can be concluded that it is possible for the Vastex IR
dryer to match the resistance performance of vacuum oven dried prints. In Figure 30, we
see that the sintering curves for all IR prints dried at a heat setting of four, regardless of
their belt speed setting, matched the sintering curves for the oven dried prints.
Additionally, the print dried at the high heat setting with a belt speed setting of 15 also
matched the sintering curves for the oven dried prints. We also see that none of the prints
dried at the low heat setting or at the high heat setting and slower belt speed settings
performed as well as the oven. In Figure 31, we see that all IR dried prints at the heat
setting of four performed just as well or better than the oven dried prints. Additionally,
the performance of the high heat drying test with a belt speed setting of ten is similar to
the oven with the other two high heat prints having slightly worse performance. This data
indicates that under these conditions, the Vastex system is capable of drying prints, which
produce comparable sintering performance as prints dried in the oven.
In order to confirm these graphical conclusions, a hypothesis test was performed
using the data from Figures 30 and 31 to determine if the average resistance of IR and
oven dried traces were statistically different. Figures 32 and 33 show that a p-value of
0.0008 and 0.0078 were calculated for this test, respectively. That means that at α=0.05,
it can be concluded that there is a statistically significant difference between the average
38 Figure 32: Hypothesis test for 1 pass prints dried at 2 inches with the new IR dryer and the oven
39
A follow-up experiment was done to determine how double printing pass IR dried
prints would perform with the Vastex IR drying system in comparison to the vacuum
[image:47.612.125.550.152.370.2]oven. The results of this experiment can be seen below in Figure 34.
Figure 34: Resistance data for double pass IR and oven dried prints at 4 inches
From Figure 34, we can see that prints dried with all three of the heat settings and
belt speed settings of 10 were the closest to matching the performance of the oven dried
print. This is different from what we saw with the single pass prints, where the belt speed
setting of 15 was the closest to matching the performance of oven dried prints. This is
because the dryer now needs to dry a thicker trace, which means it needs to move at
slower speed so it has more time to dry the traces.
In order to confirm these graphical conclusions a hypothesis test was performed to
determine if the average resistance of IR dried traces and the average resistance of oven
dried traces were statistically different. Figure 35 shows that a p-value of 0.0544 was
calculated for this test. That means that at α= 0.05, it can be concluded that the average
resistance for IR dried prints is not statistically different from the average resistance for
oven dried prints.
10 15 20 25 30 35 40
2.20 2.30 2.40 2.50 2.60 2.70 2.80 2.90 3.00 3.10 3.20 3.30 3.40
R
e
si
stan
ce
(
Ω
)
Voltage (kV)
![Figure 1: Subtractive lithographic process vs. additive direct printing process [2]](https://thumb-us.123doks.com/thumbv2/123dok_us/90208.8492/10.612.132.484.128.346/figure-subtractive-lithographic-process-additive-direct-printing-process.webp)