by
Diah Widarti
A thesis submitted in partial fulfilment for the degree of Master of Arts in Demography
DECLARATION
Except where otherwise indicated, this thesis is my own work
On this occasion, I would like to express my appreciation to all the persons who have assisted me in completing this study. In particular I wish to thank Dr. T.H.Hull, my supervisor, whose patient guidance encouraged me to continue to the end of my study. To my lecturers, Dr. S.K.Jain, Dr. D.W.Lucas who first interested me in this topic as well as Dr. P.F. McDonald and Dr.H.V. Moir for their useful comments.
The secretarial assistance of Ms. Trudy Housego, Mr. P. Waddell-Wood and Ms. Sylvia Boyle is fully appreciated. A special gratitude is due to Ms Marian May who helped me with my nglish problems. Also, I wish to thank Mrs Jennie Widdowson as well as the
staff of the computer centre who assisted in my computer works.
I would like to express my gratitude to my office, Dep. Manpower and Transmigration which gave me permission to study in Australia; and the Australian Development Assistance Bureau (A.D.A.B.) who provided me with a scholarship. A special acknowlegment to Mrs. M.A. Thorman and Ms. Dawn Beresford-Wiley who helped me with my many problems during my stay in Canberra.
Page ii
Abstract
This thesis analyzes the nature of manufacturing employment in Java. The term of "manufacturing workers" in this study, refers to those who worked in the manufacturing sector during the pre-enumeration week.
List of Contents
Page
Declaration
Acknowledgements i
Abstract ii
List of Contents iii
List of Tables v
List of Appendices vii
CHAPTER 1. Introduction
1.1. Background and objectives of the study 1 1.2. Data sources, definitions and limitations 3 1.3. The concept of economically active population 6
CHAPTER 2. Issues on Labour Force Participation and Characteristics of the Manufacturing Sector
2.1. The labour 'force participation pattern 9 2.2. Impact of education on labour force
participation 11
2.3. Female labour force participation and fertility 13 2.4. Characteristics of the manufacturing sector 16
CHAPTER 3* The Manufacturing Sector in Indonesia
3.1. The development of the manufacturing sector
in Indonesia 19
3.2. Manufacturing establishments and types of
industry in Indonesia 24
CHAPTER 4. The Labour Force and the Population Not Economically Active in Java
4.1. The economically active population 34
4.1.1. The employed population 34
4.1.2. The unemployed population 47
Page iv
CHAPTER 5. Manufacturing Employment in Java
5.1. Socio-economic conditions of the regions 58
5.2. Manufacturing employment in Java 64
5.3. Provincial differentials in manufacturing employment
5.3.1. Manufacturing employment rates 73
5.3.2. Labour utilization 76
5.3*3. Labour underutilization 77
5.3.4. Occupational distribution of manufacturing workers 81
CHAPTER 6. Socio-demographic Differences in Manufacturing Employment in Java 6.1. Characteristics of manufacturing workers 90 6.2. Socio-demographic differences in manufacturing
employment 98
6.2.1. Manufacturing employment rates
6.2.1.1. Manufacturing employment rates by
age and sex 98
6.2.1.2. Manufacturing employment rates by
education 104
6.2.1.3. Manufacturing employment rates by
marital status 108
6.2.2. Labour utilization 114
6.2.3. Labour underutilization 118
6.3. Manufacturing employment and fertility 121
CHAPTER 7. Summary and Conclusions.
7.1. Manufacturing employment in Java 130
7.2. Socio-demographic differences in manufacturing employment 131
References 135
List of Tables
Page
3.1. Number of establishments by scale of industry
in Java and Indonesia, 1974/75 26
3.2. Distribution of persons working in manufacturing industry by sub-industry in Java and Indonesia, 1974/75 27 4.1. Population aged 10 and above by type of activity
according to sex and urban-rural residence
in Java, 1976 38
4.2. Labour force participation rates by age, sex
and urban-rural residence in Java, 1976 39 4.3. Percentage distribution of working population by
industrial classification, sex and urban-rural residence,
Java 1976 43
4.4. Percentage distribution of working population and manufacturing workers by work status,
in Java 1976 44
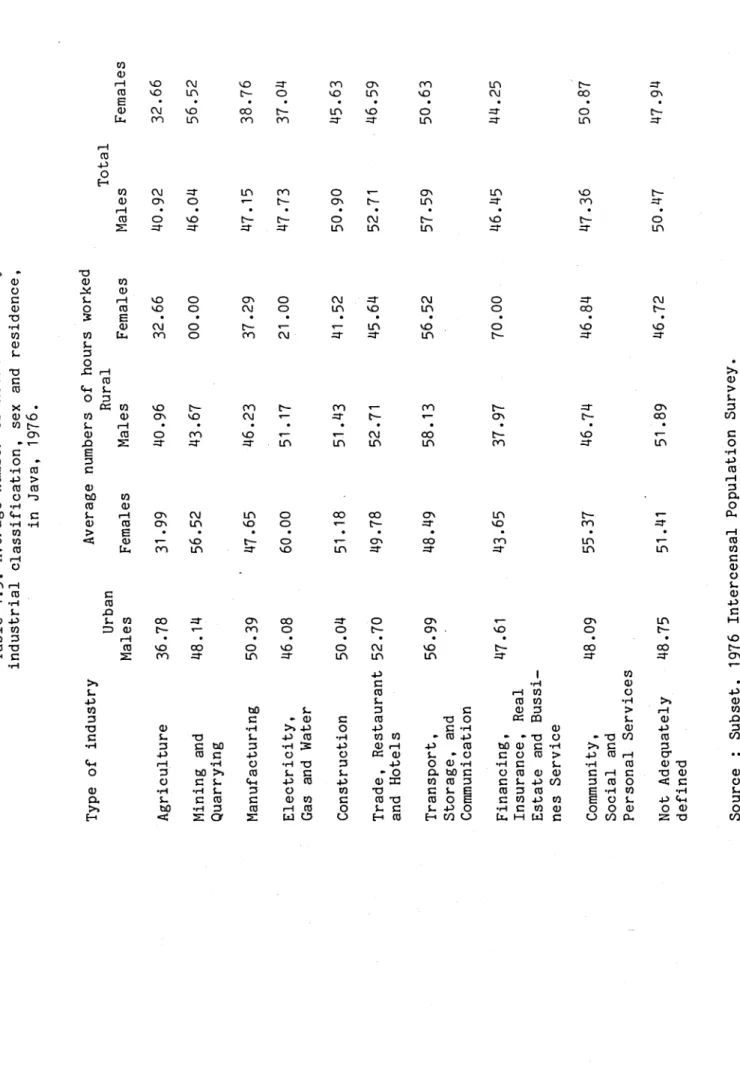
4.5. Average number of hours worked by industrial
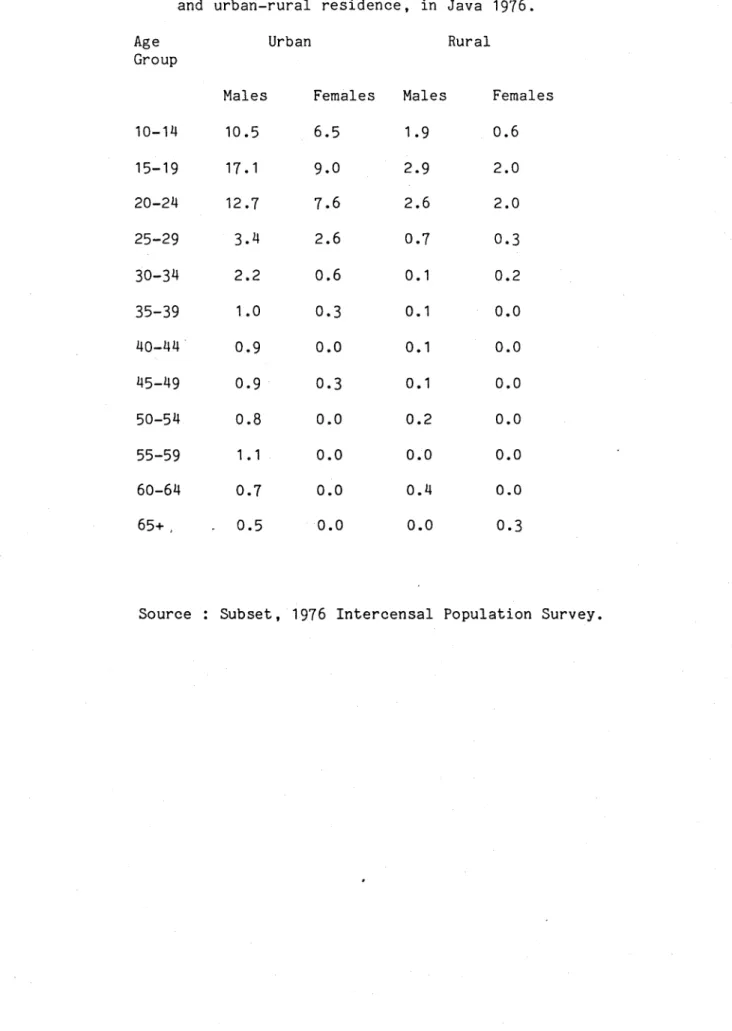
classification, sex and residence, in Java 1976 46 4.6. Recorded unemployment rates by educational attainment,
sex and residence, Java 1976 52
4.7. Recorded unemployment rates by sex, age and urban-rural
residence, in Java 1976 53
4.8. Percentage distribution of population not economically
active aged 10 and over by type of activity, Java 1976 56 5.1. Percentage distribution of population aged 10 and
over by industrial classification and province, Java 1976
5.2. Number of establishments per million population
according to province and scale, Java 1974/75 63 5.3. Percentage distribution of manufacturing workers by sub
industry in Java according to 1974/75 Industrial Census and
1976 Intercensal Population Survey 68
5.4. Percentage distribution of manufacturing workforce by sub
industry and province, Java 1976 69
5.5. Distribution of manufacturing workers according to "kabupaten" lived in and sub-industry, Java 1976 70 5.6. Main* industries in Java according to province and scale of
Page vi
5.7. Manufacturing employment rates by province, sex and
urban-rural residence, Java 1976 78
5.8. Average number of hours worked in manufacturing sector
by province according to sex and residence, Java 1976 79 5.9. Percentage of manufacturing workers who are apparently
underutilized by reason of low hours worked* according
to province, sex and residence, Java 1976. 80 6.1. Percentage distribution of manufacturing workforce by age,
sex and urban-rural residence, Java 1976 91 6.2. Percentage distribution of manufacturing workforce
by educational attainment, sex and urban-rural
residence, Java 1976 94
6.3* Percentage distribution of manufacturing workforce by
marital status according to age, sex urban-rural residence,
Java 1976 97
6.4. Manufacturing employment rates by age, sex
and residence, in Java 1976. 108
6.5. Percentage distribution of manufacturing workers
who work in non-household enterprise, according to age
and sex, Java 1976. 109
6.6. Percentage of manufacturing workers who
work as "self employed” and "unpaid family worker” according to province, residence and sex,
Java 1976. ' 110
6.7. Manufacturing employment rates by educational
attainment according to age, sex, urban-rural residence,
Java 1976 111
6.8. Manufacturing employment rates by marital status,
age, sex and urban-rural residence, Java 1976 112 6.9. Manufacturing employment rates of females who
are still single among provinces in Java 1976. 113 6.10. Average number of hours worked in the
manufacturing sector by age, education and marital status according to sex and urban-rural
residence, Java 1976 117
6.11. Percentage of manufacturing workers who are apparently underutilized by reason of low hours worked* according to age, marital status and education in
Java 1976 120
6.12. Average number of children ever born of female
manufacturing workers by workstatus according to age,
List of Appendices
Page 1. Workforce distribution by type of industry,
Indonesia 1930-1976. 146
2. The diagram of economically active population
in Java 1976 147
3. Forms of traditional manufacturing industry 148 4. Definition of manufacturing establishment in
Indonesia, 1974/75 149
5. Percentage distribution of working population by industrial
classification according to age and sex, Java 1976 150 6. Occupational distribution of working population by industrial
classification according to sex, Java 1976 152 7. Percentage distribution of female population aged 10 and
above by marital status and age, Java 1976 154 8. Percentage distribution of female manufacturing workers
of Jakarta by province born, 1976. 155
9. Percentage of manufacturing workers who have other jobs,
Java 1976. 156
10. Main occupation of manufacturing workers in 1976. 157 11. Percentage distribution of total population by age, sex
and residence, Java 1976. 166
12. Percentage distribution of total population by
educational attainment, according to sex and residence,
Java 1976 167
12 a.Percentage distribution of manufacturing workers by
educational attainment, sex and residence*, Java 1976 168 13. Percentage distribution of total population by marital
status, age, sex and urban-rural residence,
Java 1976. 169
n
14. Manufacturing employment rates by age and sex according
to province, and urban-rural residence, Java 1976. 170 15. Manufacturing employment rates by educational attainment
according to age, sex, urban-rural residence in Java 1976. 172 16. Manufacturing employment rates by marital status, age, sex,
province and urban-rural residence, Java 1976. 176 17. Percentage distribution of "ever married women" who are
not currently married, according to work status and age,
CHAPTER 1 Introduction
1.1. Background and objectives of the study
In Asia and the Far East, population growth is generally viewed as a deterrent to speedy economic development (Olin, 1967:314). Rapid population growth is one of the major problems faced by the Indonesian Government. McNicoll and Mamas (1976) report that during 1961-1971, the rate of growth was 2.1 percent per annum. In addition, the population is unevenly distributed among the major island groups. Java and Madura, which contain only about 7 percent of the country's territory, had to support 63 percent of Indonesia's total population in 1971. In contrast, the other major islands - Sumatra, Kalimantan, Sulawesi and Irian Jaya are inhabited by only 30 percent of the total population. This circumstance has been recognized by successive governments since the early part of this century. The Dutch colonial government began a resettlement scheme which was described as a colonialization policy in 1905 (Hardjono, 1974:16). But it was not until 1969 that the Government of Indonesia addressed the problem of overall population increase directly by introducing a national family planning program, which according to Hull (1976:106) has been "one of the most succesful undertakings of the New Order Government".
young people. Its economic structure is still based mainly on agriculture, which can not absorb new entrants in proportion to the growth of labour supply. This has resulted in a variety of socio-economic problems as well as problems of unemployment and underemployment of the workforce. Therefore, the Indonesian Government has emphasized in its Five Year Planning the creation of more employment opportunities, both in agricultural and in other sectors. Survey figures from 1976 indicated that while most of the workforce was still primarily devoted to agriculture, substantial proportions pursue their livelihood in trade, services and manufacturing respectively.
Due to different definitions used, it is not possible to chart trends of manufacturing employment accurately. However as a rough guide we can see that the proportion of the labour force recorded as being in the manufacturing sector in Indonesia in general actually fell beween 1930 and 1961 , but has been increasing slowly over the fifteen years between 1961 and 1976 (Appendix 1).
Page 3
large and medium scale industry. The textile and tobacco industries were the next most important subsectors in terms of employment (Donges, et a l . 1974:15). With this in mind the present study will investigate the nature of manufacturing employment in Java. The objectives of the study are :
1. to determine whether socio demographic factors account for the differences in labour force participation and intensity of labour utilization among the manufacturing workers, raising questions such as :
a. how does age influence the participation rates ? b. how does gender affect the employment rates ?
c. how does marital status influence participation rates ? d. what is the association between fertility of female
workers and employment rates ?
2. to determine whether cultural factors account for differences in the labour force participation among manufacturing workers. Those of relevance here are : education, province of residence and citizenship (important both in themselves and as proxies for ethnicity).
3. to examine whether there is a difference in occupation distribution according to province.
1.2. Data sources, definitions and limitations
industry in Java in the week before the enumeration. This group will be referred to as manufacturing workers. Apart from this, a variety of published data are also used.
According to the 1976 Intercensal Population Survey, the labour force is defined as the population aged 10 years and above who are working in economic activities or actively looking for work. There is no maximum age limit used in Indonesian enumerations; however, 64 is often assumed to be a maximum age limit in many other countries. (A diagram of the economically active population in Java is shown in Appendix 2).
The working population (which is also called the employed population) consists of those who satisfy the following conditions :
1. They were working for earnings or profit or assisting others in obtaining earnings or profit for at least one (1) hour during the one week before enumeration, or
2. during the preceding week were absent, but normally work and have a job which specifies that they are :
a. permanent workers (government or private employees) who were temporararily absent from work due to illness, on leave etc. b. farmers operating agricultural holdings who
Page 5
The unemployed are those who are either looking for a job or waiting to commence a new job; they may have never worked or worked in the past but are not working now.
The minimum age limit of 10 years for Supas, was the same as that used in the 1961 and 1971 Population Censuses. In contrast, the 1958 Manpower Survey of Java and Madura employed the minimum age limit of 12 years of age. In 1971 and 1976, the time reference applied was one week preceding the enumeration. In 1961 the time reference period was 2 months, while in the 1958 Manpower Survey a 6 month period was used.
1.3. The concept of an economically active population
The boundary line between economic activity and non-economic activity is frequently not clear; and the applicability of the concept of a labour force depends to a large extent upon the stage of social and economic development. Jaffe and Stewart (1951:14) have mentioned that :
In primitive societies the working force is hardly distinguishable from the total population, since the low level of technology requires the participation of virtually the entire population in the common tasks of producing goods and services necessary for subsistence. With the growth of market economy in the course of economic development, the working force becomes clearly distinguishable from the population.
Page 7
The labour force concept was developed to provide a realistic measurement of the labour supply. Firstly by using the concept of "activity” , it implies that the person must be actively working (employed) or seeking work (unemployed); secondly, the activity was given a specific time reference, which was usually taken as the course of one week before the enumeration (Hauser, 1974:2).
Hauser 0 9 7 4 ) has tried to overcome these deficiencies by introducing what is known as the "labour utilization approach". It is considered more applicable to the developing nations, since it provides information about the underemployed (either visible or invisible) by categorizing the economically active population as those who are adequately utilized and those who are inadequately utilized according to the criteria of time, earnings and education attained (Redmana, et a l , 1977:4).
CHAPTER 2
Issues on Labour Force Participation and Characteristics of the Manufacturing Sector
2.1. Labour force participation pattern
Conventionally defined, the labour force or economically active population is those individuals who furnish the supply of labour for production of economic goods and services (Barclay, 1958:264; United Nations, 1968:3; Shryock and Siegel, 1971:336).
Standing (1973:9) states that the size of the labour force is a function of a variety of factors, namely : the demographic composition of the population, the extent to which different groups in the population participate in labour activities, and also what might be called "statistical ambiguities". Apart from that, the labour force size is largely determined by the size and sex-age composition of the population, as well as age specific activity rates of both
sexes (United Nations, 1968:40)
Activity rates for population may be calculated in terms of various characteristics such as : sex, age, marital status, educational level, urban-rural residence, ethnic groups and others, provided those relevant classifications of population exist in the census tabulation. By use of standardized activity rates, which are generally calculated using the male and female populations ten years of age and over, one can compare the levels of participation in economic activities on the part of different populations and sub-groups. This effectively eliminates the distortions of differences in age structure of the population (United Nations,
Pattern of male participation in the labour force
Durand (1975:22) describes that in general there are three principal phases in the typical cycles of working life for a cohort of male population. Firstly, the ages of entry into the labour force, from the time when the first members of the cohort start working up to the age at which the activity rate in the cohort reaches its maximum. Secondly, the prime working ages, when the activity rate remains on a high plateau; and thirdly, the ages of retirement, when the rate drops off, gradually at first and more steeply as age increases. Furthermore, Durand (1975:28) observes that in terms of urban-rural participation in general, activity rates of males are almost universally lower in the urban than in the rural areas.
The activity rates in the first and third phases are generally higher in developing countries than those in developed countries. This is due to the fact that working condition in agricultural countries permit the employment of children at an early age, on the other hand the developed countries can afford greater investment in education for the young and keep them in school for a longer period. Also, the higher rate of saving and social security schemes existing in many developed countries act as a stimulus to earlier retirement (United Nations, 1962:12-13).
Pattern of female participation in the labour force
Page 11
there is a U-shaped pattern of female participation. The decline
occurs in the early stage of industrialization, but will increase
again during the later stages of development due to increase in the
relative size of the service sector and the growth of clerical and
white-collar occupations which absorb increasing proportions of women workers.
Age distributions of female participation vary considerably.
Even though there is no single pattern, in industrialized countries
the most common feature has been a sharp peak for women in their early
twenties. A variety of patterns may arise associated with the
life-cycle of marriage, average age at first pregnancy and number of
children per women (Standing, 1973:16). In general, the distribution
of female participation rates over the adult range is much flatter in
low income than in industrialized countries. The primary reason for
this is that childbearing takes place over a much longer period than
it does in industrialized countries, where the average number of
children per woman tends to be lower and where child bearing tends to be closely spaced.
2.2. Impact of education on labour force participation
It is widely held that labour force participation rates are
positively correlated with the levels of education. Bowen and Finegan
(1966:573) found that among the prime-age males, older males and
Among economists perhaps the most popular hypothesis is "the
opportunity cost argument". They reason that since education is an
investment and since education and earning potential are generally
positively correlated, education raises the opportunity cost for
economic activity and thus the incentive to seek employment (Standing,
1978:141). This argument has several weaknesses; firstly, the
educational attainment variable measures a supply decision rather than
a demand effect, since it is largely true that education makes it
easier for a person to obtain a job or gain access to training
facilities. Secondly, it is difficult to assess the impact of
education per se on the propensity to work, as opposed to the role of educational status as an indicator of other socio economic factors.
Another argument, "the aspiration effect argument", states that
education is a major determinant of income aspirations and
expectations. Thus, the more educated people seem to be more
economically active, with improved employment opportunities (Morgan et
al, 1962:348-358). However, since education also raises income and
occupational expectations, a positive relation cannot be presumed
because frequently those expectations cannot be realised. According
to Standing (1978), this may lead to a pronounced "status frustation effect", which may be particularly common in urban areas of many low
income countries (Turnham, 1971 and Blaugh, 1973). From her
observations in urban areas of Chile, Yousseff (1974:58) found that
the female participation rate for women with secondary education is much lower than it is for those with lower education levels. In urban areas of low income countries the highest rate of unemployment is among young people, who in fact also tend to be the better educated
group (Blaugh, 1973:7-10 and Bairoch, 1973). With this in mind,
Page 13
since it is most pronounced among those with some education, who tend to come from the more privileged sections of the community.
Thus, not all the studies have found that the relationship between education and labour force participation is positive, especially in the case of females. In Indonesia, the level of education is still quite low : only 4.9 percent of the total male population and 2.5 percent of female had attended beyond junior secondary school level in 1975. Thus, higher education in developing countries is different from that in developed countries, where most of the relationship between education and participation was derived. Educated women in Indonesia tend to be housewives rather than joining labour force (Rahardjo, 1973). Hull (1977:71) confirms from her study in rural Java, that women of higher social status who have better education are reluctant to work for pay, since it will lower their status; so the positive relationship between education and participation may not exist.
2.3. Female labour force participation and fertility
The relationship between female labour force participation and fertility has long been of interest to demographers. It has often been considered that female labour force participation is associated with lower fertility because of delayed marriage, increased education, reduction of preferred family size and increased use of contraception (Namboodiri, 1964).
rate female workers can obtain, the lower their fertility. Colver (1953) shows from his study that delayed marriage and low marital fertility are typical of communities with high women's work participation rates. Both accumulated work experience of women and birth parity are significant determinants of sequential decisions regarding market employment, and to a lesser extent fertility, in the Philippines (Rosenzweig, 1975). Kasarda (1971) reports that high rates of female labour force participation outside the home and low rates of economic activity of children may depress a society's fertility as measured by the crude birth rate or the child-woman ratio. Rosen and Simmons (1971) reveal that smaller family size among Brazilians is associated with generally higher levels of status among women, higher educational levels, greater social contacts and more skilled employment and equality in family decision-making. Furthermore, their analysis supports the hypothesis that industrialization influences fertility through shifts in the social status of woman, both in their work and home. Groat et al (1975) and Clifford and Tobin (1977) propose that among American women, lower fertility, longer first birth intervals and earlier use of birth control are associated with the longest work durations, the highest status jobs, and work before the birth of the first child.
Page 15
age groups (Hull, 1977:43). Nevertheless, in contrast to what Kupinsky (1971) and Clifford (1971) found in industrialized countries, Hull (1976) and Singarimbun and Manning (1976) report from studies in rural Java (Indonesia) that social status is positively related to f ertility.
In view of this evidence, it is important to consider the role of increasing employment in reducing fertility. In the high birth rate countries, which are usually less modernized countries, a negative relationship between female employment and fertility may not exist. Within these countries the negative relationship may be found to be greater in urban than in rural areas. Stycos and Weller (1967) claim that this is the case in Turkey. The reason is that, work (often in the form of domestic service) and motherhood (with assistance in childrearing available from the extended family) do not usually represent conflicting roles. Standing (1978) agrees that an inverse relationship between fertility and female employment is more likely to exist if economic activity takes place outside the domestic sphere, though the strength of the relationship would still depend on the type of employment and job structure. Jaffe and Azumi (I960) and Weller (1968) reported from studies in developing countries that the fertility of women who are not in the labour force is similar with those women who work in household enterprises.
the labour force, the greater the chance that she will enter the labour market and have relatively low fertility. Janowitz (1975) states that since the labour force participation rates of women show a sharp rise with the completion of college and then a further rise with additional years of schooling, there is an increased effect of education in raising opportunity costs and discouraging childbearing as education rises within the group with some college education.
Another theoretical argument for the negative relation between female employment and fertility is ’’the role conflict hypothesis” (Kupinsky, 1977:208). It is said that when a married woman enters the labour force, conflict occurs between her role as mother and home maker and her non-familial role. Thus, a woman in the childbearing years will either restrict her fertility to remain in the labour force, drop out from the labour force or combine both roles.
2.4. Characteristics of the manufacturing sector.
Based on a series of meetings sponsored by ECAFE from 1951-53, Herman (1956:356-70) distinguished traditional manufacturing forms into : cottage industry, handicraft and small-scale industry. (For a more further detail of these forms see Appendix 3).
Page 17
p r o du ce more o r l e s s modern p r o d u c t s .
The c o t t a g e and s m a l l - s c a l e i n d u s t r i e s a r e g e n e r a l l y c o n s i d e r e d a s a g e n t s o f economic d e v e l o p m e n t by some Wes ter n e c o n o m i s t s , s i n c e t h e y a r e a b l e t o p r o v i d e a m a rk e t f o r l o c a l l y pr oduced raw m a t e r i a l ; t h e y a s s i s t i n r e d u c i n g i m p o r t s o f consumer goods; t h e y h e l p t o m o b i l i z e l o c a l s a v i n g s , p r o v i d e employment o p p o r t u n i t i e s o p e r a t i n g t o check t h e d r i f t t o t h e c i t i e s and a l s o c o n s t i t u t e a v a l u a b l e t r a i n i n g ground f o r b u s i n e s s acumen and s k i l l e d l a b o u r ( U n i t e d N a t i o n s , 1951 c i t e d i n F r y e r , 197 0: 113- 114) .
that the Indonesian manufacturing sector ranges from thousands of tiny cottage firm in rural areas (mainly in Java) using primitive technology where value added per worker is very low, through small and medium sized firms, to the large scale sector where many firms still use rather outdated technology but where a small and growing number of establishments use fairly up-to-date technology and can be regarded as "modern" manufacturing plants.
CHAPTER 3
The Manufacturing Sector in Indonesia
3.1. The development of manufacturing in Indonesia
In the early 1900s, the question of encouraging industrial development to redress the decreasing welfare of Java's population had already been raised. But not until the 1930s did effective colonial policies to promote manufacturing appear (Fryer and Jackson, 1977:216). During that time, most important in terms of numbers of units and employees were the large number of traditional, cottage and small-scale industries which were dispersed through the villages and towns. Most of them were producing the daily needs of villagers, as well as many established handicraft industries producing items such as batik, silver, gold, brass, and copper ware for wider markets. Furnivall (1944:332) noted "around 1900 the industrialization of Java was regarded as a master key to welfare".
The Great Depression affected the Indonesian economy by causing widespread suffering and unemployment especially in the sugar districts of Java. Mubyarto (1969:40) estimates that the hectarage and production of sugar in 1935 had declined to about one-seventh and one-sixth respectively of 1931 levels. In this period, the Dutch colonial government recognized the great urgency of promoting the manufacturing sector. Their concern was reflected in a protectionist trade policy, which was applied in order to encourage small-scale enterprises, and establish and expand labour-demanding industries producing essential consumer items which were being imported in large quantities. In addition, import restrictions of certain manufacturing goods and import duties on essential machinery, raw materials including cotton and rayon yards were either reduced or eliminated.
Page 21
mill at Tegal. The industries which most absorbed employment were those concerned with foodstuffs, textiles, metal goods and repairs. Sitsen (1940:5) noted that although the manufacturing sector accounted for about an eighth of the total employed population, 2.5 million of these worked in cottage and small scale industries, and only 300.000 were employed in mechanized factories.
In the late 1940s, soon after Independence, the main concern of the Indonesian government was rehabilitation. Industrialization was placed at the centre of the development programme starting with the Economic Urgency Programme in 1951 , which was intended to increase the output of consumer goods and the processing of domestic raw materials and to mechanize small firms. This programme did not meet with success (United Nations, 1956:233-304). In order to expand and improve cottage and small scale industries and to yield more consumer goods for the domestic market, "perusahaan induk" was established; that is a form of central processing station, which was able to undertake difficult stages of manufacture for producer cooperatives. Again, the administrative defects and the poor quality of the products "resulted in far less success than was hoped".
over Irian (West New Guinea), brought about stagnation.
The next government policy was the Eight Year Development Plan (1961-1959). Based on groupings of projects whereby exploitation of natural resources with the aid of foreign capital would furnish the necessary foreign exchange earnings, manufacturing industries were to receive almost a third of planned investment with the largest allocation designed to produce greater spinning capacity and a geographically more dispersed cotton textile industry. It was hoped that the new weaving mills would attract private capital investment in the vicinity of the new plants, thus spreading employment opportunities widely through the country. Fryer (1970:398) contends that in terms of employment and perhaps also in its contribution to the national product, textiles and apparel constituted Indonesia's most important manufacturing industry during the sixties.
Fryer and Jackson (1977:221) estimate that by mid-decade many state owned enterprises were working below installed capacity. As Soehoed (1967:30) has pointed out, on average the basic industry sector was working in 1955 at less than 30 percent of capacity. Furthermore, he remarks that as in many other sectors in Indonesia, the manufacturing industry suffered from defects in managerial and technical skills. In addition, the government control system made it harder for even capable managers to run their plants efficiently.
The first census of manufacturing was carried out in 1963; it
showed that the broad geographic distribution of industry in Indonesia
had not changed much since before the war. It had developed almost
exclusively in the areas of pre-war establishment, with South Sulawesi
Page 23
generator of employment the manufacturing industries have disappointed
earlier expectations" (Soehoed, 1957:75). Moreover, several of the
large European firms in food, beverages and tobacco industries, such
as Unilever and British American Tobacco, had already withdrawn from
production before the take-overs of 1954 (Fryer, 1970:349), made the situation even worsed.
The "Orde Baru" Government then introduced an important change by adopting a new attitude to overseas capital. The Foreign Investment
Law was established in 1957 in order to attract foreign capital. By
1969 the government introduced the First Five Year Plan (1959-1973),
known as Repelita I. Priority was given to the development of
industries which support the agricultural sector as well as
infrastructural development. In the early 1970s, under the impact of
an increasing influx of foreign capital and technology facilitated by
the enactment of the New Investment Law of 1967, the manufacturing
sector experienced a spurt of rapid expansion (Fryer and Jackson,
1977:222-23)). During this period, two groups of industries received
priority : those serving the basic needs of the development
programme, particularly in agriculture, including the production of
fertilizers, cement, and agricultural processing machinery; and those
producing goods such as textiles, paper, tyres, and chemicals which
were in seriously short supply and whose growth would result in significant import substitution.
As one of the major sources of manufacturing employment, the
textile industry was accorded special attention. Substantial amounts
of foreign capital were directed to the improvement of the industry’s
output was planned and several large new mills were opened (Fryer and Jackson, 1977:223).
The industrial development in Repelita II (1974-1979) emphasized
the processing of crude materials into raw materials. It was strongly
concerned with the need to create employment and to achieve a more
equitable division of the results of development. For Repelita III
(1979-1934), it is suggested that the Government seek to ensure that a
higher share of total investment in manufacturing is directed towards
the medium, and in particular, the small-scale sector (including
cottage industries), consonant with effective demand for the products of these sector (Bartsch, 1973:116).
Yet, many observers have assessed that Indonesia is still in the
early stages of industrialization with export of manufacturing
products almost neglible (McCawley, 1979). And, like many other
developing countries, Indonesia to date has put little emphasis on the
development of export oriented manufacturing industry after earlier
embracing an import substitution policy.
3.2. Manufacturing establishments and types of industry in Indonesia.
Before 1974/75 manufacturing establishments in Indonesia were grouped either according to the workers or power used in operating.
But new definitions were applied in the 1974/75 Industrial Census,
based on the number of workers engaged (Appendix 4).
Irrespective of the contribution of small, medium and large scale industries to industrial development in Indonesia, it can be said that
Page 25
shows that as for its population distribution, Java has the most of the present medium and large scale establishments, as well as small
and household/ cottage industries. Consequently, most of the
employment in manufacturing industry is in Java (Table 3.2.). Most
and Indonesia, 1974/75.
S c a l e o f i n d u s t r y J a v a I n d o n e s i a
L a r g e a n d M e d i u m E s t a b l i s h m e n t s
6034 (35.1 %)
7091
S m a l l S c a l e E s t a b l i s h m e n t s
33359 (70.3 %)
48136
H o u s e h o l d a n d C o t t a g e
E s t a b l i s h m e n t s
944763 (76.5 %)
1234511
T o t a l 984656
(76.3 %)
1239783
T a b l e 3 . 2 . D i s t r i b u t i o n o f p e r s o n s working in m a n u f a c t u r i n g i n d u s t r y by s u b - i n d u s t r y i n J a v a and I n d o n e s i a , 197 4/75.
S u b - i n d u s t r y J a v a I n d o n e s i a
Food, B e v e r a g e s and Tobacco
1 ,411,511 1 , 8 2 0 ,7 59
T e x t i l e , Wearing Appar el
495,654 664,745
Wood-Wood P r o d u c t s
1 ,241 ,557 1 , 7 0 8 , 0 5 2
P a p e r , P r i n t i n g - P u b l i s h i n g
27, 233 39,527
C h e m i c a l - P l a s t i c P r o d u c t s
67, 217 117,170
N o n - m e t a l l i c p r o c . 243,665 334, 716 B a s i c m e t a l
i n d u s t r i e s
1 ,510 2, 11 0
Machiner y 83,309 133,703
O t h e r s 51,811 30,460
N o t - S t a t e d 33,176
-T o t a l 3, 711643 4 , 9 0 1 , 2 4 2
If we consider Jakarta only, it accounts for 12 per cent of all establishments in Java and 7 percent of employment in manufacturing sector in Java. Donges et al (1974:28) report that in view of the
concentration of population and industries in Jakarta, it is not
surprising that 30 percent of the approved investments are implemented
there. They assess, the attractiveness of Jakarta for potential
investors as very low only in those sectors which depend largely on the supply of specific raw materials and which are most economically
situated close to these sources. The outstanding examples are tobacco
manufacturing and rubber products. As Soehoed (1957:31) has remarked,
industries in Jakarta are fully dependent on imports of raw materials
from other domestic areas and from abroad. During the mid sixties,
though most plants were still in fairly good condition and there were
no serious labour problems, production very much declined;
difficulties in obtaining raw materials owing to transport problems, as well as instability of prices, have kept local production well below local demand.
According to Partadiredja (1959:36) the manufacturing sector in Central Java has promising aspects, especially the kretek cigarette industry, which is assumed to be the most important light industry. Owing to the fact that many of the operational jobs are done manually, it resembles a home industry rather than a factory industry and the number of units and employment fluctuate monthly according to general
economic conditions. Although machinery is gradually being introduced
in the bigger factories, especially to produce filter cigarettes, the
industry is still overwhelmingly labour intensive (Tasker, 1979:52).
Page 29
for the growing export market for kretek cigarettes. However, the
government is said to be suspicious that the kretek manufacturers are anxious to use the machinery just to supply the existing domestic market rather than to cater entirely for the expanding export demand. If too much mechanisation is allowed, the government is worried that
up to half of the workers will lose their jobs. In the case of the
textile industry, Partadiredja (1959) reported that it seems to suffer from rising production costs and severe competition from imported
textiles. The same complaints were also reported in Jogyakarta
(Mubyarto, 1970:14-32).
East Java is one of the few provinces which obtained a large
amount of planned foreign investment, as well as domestic investment
expansion. Rehabilitation of machinery, better distribution of
imported cotton and incentives paid to workers brought about a
remarkable increase in production. However, this has not happened in
Jogyakarta (Mubyarto and Partadiredja, 1953:29-47). There are a
variety of reasons for this, such as shortage of resources, distance
between the region and major harbours, and lack of skilled labour. It
has also been said that Jogyakarta is "hostile” to foreign capital, making foreigners reluctant to venture into the Jogyakarta region.
In Indonesia, industrial diversification is still narrow
(McCawley, 1979:25). For instance, by 1974 rubber remilling and saw
milling in the large and medium scale industries were prominent in most provinces of Sumatra and Kalimantan, whereas in Java, the textile
and tobacco industries dominated the large and medium scale
industries. Small scale industries were represented by such food
Indonesian cottage industries, bamboo and rattan weaving and coconut sugar were most prominent.
The food processing industry happens to be one of the most diversified in Indonesia (Donges et a l , 1974:71-75). According to the
number of establishments, rice cleaning and milling indicate a
distinctive dominance. In terms of employment, rice milling; raw
sugar drying; and tea processing, sorting and packing; amount to
more than 70 percent of the sectors's total employment, which is
mainly absorbed by large scale industries. This does not mean that
the small scale industries do not play an important role in food processing.
About 30 percent of total manufacturing output of food processing
is made up of coconut oil, cooking oil, and vegetable oil; grain mill
products, sugar factories and refineries. The outstanding position of
these industries is also confirmed in terms of their labour
productivity (as measured by the ratio of output per employee).
Donges et al (1974) estimate that even though food processing is
already relatively more diversified than most other manufacturing
branches in Indonesia, there is still wide scope for further
development. Some food processing branches have already been
successful in getting foreign markets with products of high quality.
Page 31
The textile industry has been one of the main industrial
activities for a long time. It is highly concentrated in Java, and,
except for spinning, the largest development has been in West Java; whereas most of the large spinning mills were in Central Java during the sixties (Palmer and Castles, 1965:38). There is a great variety in terms of technology used in the textile industry, such as the
primitive handloom on the one hand, compared with the automatic
mechanical loom that has a capacity as big as 20 handlooms and
operated by only one operator (Sadli, 1973:151) This technological
variation according to Manning (1977:20) is linked to the size of
establishment. Manning (1979:191) reports that the weaving industry
first developed on a large scale in West Java and "Alat Tenun Mesin" (mechanical weaving) production continues to flourish primarily in the
region. In addition, Hill (1979:7) contends that the weaving industry
is usually the major employer of labour in countries where the
manufacturing sector is relatively undeveloped. Donges et al
(1974:32) note that the textile industry is a relatively dynamic
branch of Indonesia's manufacturing sector. In general it has shown
considerable growth, which is probably linked to the development of
domestic demand. Daroesman (1972:38) shows that textile production
has certainly been increasing steadily. There was almost a threefold
increase in textile production between 1963 and 1975/76 (Grenville, 1977:23). The increase comes mostly from the modern sector where there has been a good deal of foreign investment and some major advances in synthethic textile production.
As has frequently been stated, the textile industry is expected
to be a major source of employment. One of the aims of the Five Year
stated that apart from a potential source for import substitution, it seemed to be a promising source of opportunities for the absorption of workers from agriculture. Yet, according to Manning (1979:183) the extent of labour intensity depends on which segment is involved. Whereas the handloom is relatively labour intensive, automatic Alat Tenun Mesin must rank high in capital intensity. However, the rapid expansion of the modern textile sector according to McCawley (1973:13) may have had a negative employment effect on small and cottage sectors, as it is reported that many handloom factories have been forced to cease production. Also, the batik industry throughout Java has fallen on hard times, since with the prevailing prices consumers prefer more modern textiles.
The problem often faced by the textile industry is the limited supply of raw materials, apart from a shortage of spare parts. Palmer and Castles (1955) reported that even though cotton has been grown in Eastern Java and the Lesser Sunda Islands for a long time, the yield has been low and production was small. To meet the requirements of raw materials, the supply of cotton has been for many years provided by the United States under PL 430 and long term loan conditions.
Page 33
Indonesia, are very popular in Java (Gwyer, 1976:66). This industry
began to develop at the end of the last century (Castles, 1967:32-38). It flourished in the early part of the 20th century in the densely populated area of Central and East Java. Tasker (1979:52) confirms that kretek cigarette factories play an important role in Indonesia’s manufacturing industry in terms of employment provision. This is due to the fact that even though mechanisation has been gradually introduced, much of the operation is still done by hand. Manning (1977:25) and Tasker (1979:52) note that most of the workers are women
especially in the cutting and packing sections. In 1971, about 75
percent of the employees in the large and medium size kretek factories were females (McCawley, 1979:19).
According to Manning (1979:203), the kretek cigarette industry is
much more concentrated geographically than weaving; it was initially
centred in Kudus and Kediri which together accounted for almost 80
percent of total kretek production in 1934.
It is apparent that Indonesia's manufacturing industry has
largely developed in Java; mainly still producing non-durable goods
and labour intensive in operation. This is not surprising, since
The Labour Force and the Population Not Economically Active in Java
4.1. The economically active population 4.1.1. The employed population
According to the 1976 Intercensal Population Survey, there were 58,673,556 million persons aged 10 and above of whom 55 percent were in the labour force (Table 4.1.) . It also indicated that within the labour force, 65.6 percent were males and 34.4 percent were females. About 94 percent of the economically active population were reported as employed; 4.4. percent as being "temporarily away from work during the week before enumeration"; and the rest, namely 1.3 percent, were recorded as "looking for work".
Page 35
Table 4.2. provides data on age-sex specific activity rates for rural and urban areas of Java. The participation rates for the age groups 10-14 and 15-19 appear to be particularly low in urban areas. As seen, the rates in age group 10-14 in rural areas are five and three times as large as those in urban areas for males and females respectively. Denti (1968) estimates that a lack of opportunities for gainful employment for these age groups accounts for this. The same reason is probably also partially responsible for the relatively low participation rates in the age group 65 and above, together with a retirement age of 65.
Looking at the age specific activity rates for females in rural and urban areas in Table 4.2., we see that rural females show higher participation than urban females. Denti (1968:536) identifies this as a matter of economic and non-economic activity distinction, which often is very unclear. It is believed that the category of unpaid family workers which is largely composed of female members of farm households is the principal cause of the discrepancy. The high percentages of female unpaid family workers in rural areas in Java indicate that most rural working women are engaged in family enterprise (Table 4.4.). However, apart from that, the degree of female participation in economic activities is also influenced by other factors such as training, level of education, opportunities for work outside the home, fertility, marital status and family responsibilities. In addition, according to Redmana et al (1977:75) the commitment to work of rural females is different from urban females in the sense that in a traditional agrarian and handicraft economy where the family is commonly the unit of economic production, both single and married women can often continue working in addition to their other household reponsiblities. In an urban economy, however, it is both more difficult and less acceptable.
Page 37
reveals that early marriage and early motherhood inhibit high
participation by young women in the labour force. In Java it suggests
also that older women are usually still employed in a traditional
sector; that is agriculture, home industry and trade, while younger
ones tend to be engaged in the modern sectors, that is manufacturing;
transport, storage and communication; and community, social and
Table 4.1. Population aged 10 and above by type of activity according to sex and urban-rural residence,
in Java 1976.
Type of Urban Rural Total
activity Males Females Males Females Males Females
(1)Labour force*
3333185 1394944 17984051 9798883 21317237 11193827
Working 3021490 1300745 17052953 9282736
20074443 10583481
Temporari ly away
145502 47838 768162 456883 913664 504721
Looking for work
166194 46361 162936 59264 329130 105625
(2)Non-Labour f orce
House keeping
70888 2539492 350374 10326061 421262 12865553
Attending school
1384752 1142913 3369738 2554717 4754490 3697630
Thought no 87339 63285 345292 353685
432631 416970
work available
Others 401646- 406270 1145677 1445677 1547323 1883794
(3)Not Stated 6441 13248 47060 76090 53501 89388
T o t a l 5284252 5560152 23242192 24586960 28526444 30147112
Source : Subset, 1976 Intercensal Population Survey.
CHAPTER 4
The Labour Force and the Population Not Economically Active in Java
4.1. The economically active population 4.1.1. The employed population
According to the 1976 Intercensal Population Survey, there were 58,673,556 million persons aged 10 and above of whom 55 percent were in the labour force (Table 4.1.). It also indicated that within the labour force, 65.6 percent were males and 34.4 percent were females. About 94 percent of the economically active population were reported as employed; 4.4. percent as being "temporarily away from work during the week before enumeration"; and the rest, namely 1.3 percent, were recorded as "looking for work".
Table 4.2. provides data on age-sex specific activity rates for rural and urban areas of Java. The participation rates for the age groups 10-14 and 15-19 appear to be particularly low in urban areas. As seen, the rates in age group 10-14 in rural areas are five and three times as large as those in urban areas for males and females respectively. Denti (1963) estimates that a lack of opportunities for gainful employment for these age groups accounts for this. The same reason is probably also partially responsible for the relatively low participation rates in the age group 65 and above, together with a retirement age of 65.
Page 36
Looking at the age specific activity rates for females in rural and urban areas in Table 4.2., we see that rural females show higher participation than urban females. Denti (1963:536) identifies this as a matter of economic and non-economic activity distinction, which often is very unclear. It is believed that the category of unpaid family workers which is largely composed of female members of farm households is the principal cause of the discrepancy. The high percentages of female unpaid family workers in rural areas in Java indicate that most rural working women are engaged in family enterprise (Table 4.4.). However, apart from that, the degree of
female participation in economic activities is also influenced by other factors such as training, level of education, opportunities for work outside the home, fertility, marital status and family responsibilities. In addition, according to Redmana et al (1977:75)
the commitment to work of rural females is different from urban females in the sense that in a traditional agrarian and handicraft economy where the family is commonly the unit of economic production, both single and married women can often continue working in addition to their other household reponsiblities. In an urban economy, however, it is both more difficult and less acceptable.
reveals that early marriage and early motherhood inhibit high
participation by young women in the labour force. In Java it suggests
also that older women are usually still employed in a traditional
sector; that is agriculture, home industry and trade, while younger
ones tend to be engaged in the modern sectors, that is manufacturing;
transport, storage and communication; and community, social and
Table 4.1. Population aged 10 and above by type of activity according to sex and urban-rural residence,
in Java 1976.
Page 38
Type of activity
Urban
Males Females
Rural
Males Females
Total
Males Females
(1)Labour force*
3333185 1394944 17984051 9798883 21317237 11193827
Working 3021490 1300745 17052953 9282736 20074443 10583481
Temporari ly away
145502 47838 768162 456883 913664 504721
Looking for work
166194 46361 162936 59264 329130 105625
(2)Non-Labour force
House keeping
70888 2539492 350374 10326061 421262 12865553
Attending school
1384752 1142913 3369738 2554717 4754490 3697630
Thought no 87339
work available
63285 345292 353685 432631 416970
Others 401646 406270 1145677 1445677 1547323 1883794
(3)Not Stated 6441 13248 47060 76090 53501 89388
T o t a l 5284252 5560152 23242192 24586960 28526444 30147112
Source : Subset, 1976 Intercensal Population Survey.
Table 4.2. Labour force participation rates by age, sex and urban-rural residence,
in Java 1975.
Age Group
Males
Urban Females
Rural
Males Females
10-14 3.8 6.2 20.9 16.1
15-19 34.9 23.3 63.8 40.9
20-24 74.0 23.8 39.7 40.3
25-29 91 .5 25.7 95.7 33.3
30-34 95.3 31 .4 93.0 43.8
35-39 93.0 30.7 93.9 49.0
40-44 96.8 38.7 93.7 52.0
45-49 92.9 35.4 98.1 54.7
50-54 85.8 36.6 97.1 52.4
55-59 71 .2 29.0 94.4 43.1
60-64 59.1 30.2 33.8 43.9
65+ 38.7 14.7 71 .2 29.1
Page 40
Table 4.2. also indicates that the age specific activity rates
for males go up with age. For the same reason as females, the
participation rates for ages group 10-14 and 15-19 are quite low. The
peak is achieved at the age group 35-39 and then the rate gradually
declines. However, in the age group 55 and above, there is a marked
difference between urban and rural participation rates. In rural
areas, it is very common among the old men to continue working by assisting their son, daughter or relatives in the farm household or
home industries. As for their female counterparts, older men are
usually still engaged in the traditional sector (Appendix 5). In
addition, working conditions in agriculture and related activities such as household industries, permit the employment of older men, but there are fewer such opportunities in urban industry. The same reason
probably accounts for differences in the youngest age group. Thus,
the typical pattern for males in every country is discernible, namely, that close to one hundred percent of men in the middle adult ages are in the work force.
Table 4.3. indicates that most of the working population of both
sexes in urban areas find their livelihood first in services, then in
trade and manufacturing. Apart from the agricultural sector this also
occurs in rural areas, where about 31 percent of all manufacturing
employment in Java is located. Since household and cottage industries
are much more common in rural than urban areas, therefore, it is likely that employment in manufacturing sectors in rural areas are in
such industries. However, not all rural manufacturing is in small
scale industries. Jones (1930:30) mentions that many large plants
built with foreign capital have been established recently in urban
Jakarta-3ogor and the Surabaya-Sidoardjo-Malang road. Furthermore, based on analysis of manufacturing employment from 1961 to 1971 in Indonesia, Sundrum (1975) indicates that manufacturing employment in Java has been declining in urban areas but has been increasing in rural areas. This is due to the rapid growth in the manufacturing sector since 1967. Besides this, McCawley (1979:53) mentions that it is more difficult to obtain land within or near the large urban areas and ports, particularly in Java, than it is on the outskirts of medium towns. Also, some industrialists have preferred to establish factories outside Jakarta where land and labour costs are lower rather than to get the advantage of facilities such as electricity and water services; this leads to a shift to rural areas.
More than half of all employment in services and construction and about two thirds of all employment in manufacturing and trade is in rural areas. Interestingly, in rural areas females who work in trade outnumber the males. Boserup (1970:91), Papanek (1975:200) and Dewey (1962) note that this pattern is significant in Southeast Asia. According to Rahardjo et al (1980) trade is also an outstanding activity among urban Indonesian women, especially the Javanese women who are affected by economic instabilities. This is due to the fact that the salaries of the husbands cannot meet the cost of living, since the wages and salaries of public servants very often lag behind changes in the cost of living
Page 42
establishments in which they are involved are small scale and household industries. However, a larger proportion of men in the manufacturing sector is engaged in wage employment compared with the working population in general.