-05-001-E
N
-C
FINANCIAL REPORT
2004
FINANCIAL
REPOR
T
2004
ISBN 92-894-9142-6
How do I obtain the list of sales agents?
EUROPEAN UNION
A great deal of additional information on the European Union is available on the Internet. It can be accessed through the Europa server (http://europa.eu.int).
Cataloguing data can be found at the end of this publication.
Luxembourg: Office for Official Publications of the European Communities, 2005
ISBN 92-894-9142-6
© European Communities, 2005
Reproduction is authorised provided the source is acknowledged.
Printed in Belgium
PRINTED ON WHITE CHLORINE-FREE PAPER
Europe Direct is a service to help you find answers to your questions about the European Union
FOREWORD
The year of new beginnings
We had a year rich in historical events, which changed much in Europe.
The European Union grew from 15 to 25 Member States on 1 May 2004, healing the post-war division of our continent. The diversity of the new members will change budgetary discussions. European leaders unanimously adopted the draft Constitutional Treaty in June, and signed it in Rome in the autumn. The Treaty reiterates the EU’s fundamental aims and values — democracy, liberty, equality, the rule of law — and recognises those as aims where the people of Europe have agreed to share power for their greater good.
The new Commission took office having ambitious ideas to drive the European economy to become an attractive, competitive, knowledge-based economy by the end of the decade.
A realistic and prudent foundation for the new financial framework was laid. The Commission had prepared and delivered early in the year the proposal on the new financial perspective for the period 2007–13 which aims to have the new framework in operation on time and should help the new Europe of 27 to achieve its key goals: to boost Europe’s competitiveness and the rapid growth of its economy, to protect and develop our natural resources which are our com-mon and permanent assets, to offer security and give EU citizenship a real meaning, and to pro-ject a stronger EU voice worldwide. The year 2004 saw the culmination of the reform of the Commission and the first major recruitment of permanent staff from the new Member States. New steps towards future enlargements were made. In December 2004, the European Council pursued further enlargement of the Union by agreeing that Romania and Bulgaria could join the EU from January 2007, if accession preparations were complete, and that accession negotiations could start with Croatia and Turkey subject to certain conditions.
Historical moment — historical budget
The 2004 budget — the first enlarged budget to include the 10 new Member States — did its job well, ensuring the smooth integration of the 10 new members and creating the conditions to ful-fil expectations for the enlargement.
It was also the first based on new principles set out entirely according to policy activities, which makes it possible to link clearly objectives and means, and shows how money is spent to meet citizens’ expectations and to maximise added value for Europe.
The introduction of the modernised accounting system ABAC, coming in at the end of the year for 2005, was a further auspicious step towards increased budgetary transparency. International accounting standards can now be applied which will help to show that the EU budget is account-ed for prudently and honestly. This is a strong prerequisite for assurance that no euro will be spent without proper treatment (supervision, control) which also means no euro spent without proper respect for taxpayers’ money.
entered into the 2005 budget, so reducing the Member States’ contributions for the 2005 budgetary year. It was the lowest surplus since 1997.
2004 in figures:Compared with national budgets, which take an average of around 45 % of na-tional income, the EU budget is tiny, only a little over 1 % of EU gross nana-tional income (GNI). The Parliament and Council entrusted the Commission with a budget in 2004 of EUR 109 billion in commitment appropriations to carry out the tasks defined by the legislative and budgetary authorities, to cover the enlarged Union.
Payment appropriations rose to EUR 102 billion. The total appropriations for payments were EUR 9.7 billion below the 2004 financial perspective ceiling and represented 1.01 % of the gross national income of the EU-25, well under the Community ceiling of 1.24 % and even below the corresponding percentage in the 2003 budget (1.04 % of the GNI of the EU-15 when voted).
The revenue required to finance the budget for 2004, representing 0.95 % of EU GNI, was below the level of payments because of the balance left over from the 2003 budget that reduced the budget resources needed from Member States in 2004.
As it was foreseen in the accession negotiations, all new Member States during the first year of their membership received more from the 2004 budget than they gave to it.
Your money — for your future
The EU budget should play a pivotal role in helping achieve the Union’s main objectives of sus-tainable economic growth, competitiveness, employment, protection and development of natural resources and overall security.
The budget both mirrors our commonly agreed goals and political priorities and is the instru-ment to impleinstru-ment EU policies. Our budget should become a catalyst for economic and social progress, reflecting citizens’ expectations of what the Union should be doing for them. Ambi-tious objectives in EU policy documents, for example the Lisbon strategy need to be translated into EU budget reality. This is my belief and my clear understanding of both the function of the EU budget and my role as the Commissioner for Financial Programming and Budget.
Citizens have high expectations of the EU — they want ‘more Europe’ as well as more results. They have a right to know how, where and why their money is spent.
I feel responsible and accountable to the citizens. That is the reason why I, and the Barroso Commission in general, will do our best to make the EU budget more transparent and more visi-ble, for example through publications such as this Financial Report. I hope the reader will find a great deal of interesting and useful information on the benefits it gives to some 450 million EU citizens, and to people outside the Union.
Page 1. The economic situation of the European Union in 2004 7
2. The financial perspectives of the European Union: 9
— financial perspective (2000–06) 9 — preparations for the next financial framework (2007–13) 11
3. The procedure establishing the 2004 Budget 13
4. EU Budget revenue in 2004 20
5. 2004 Budget implementation 25
6. Enlargement: challenges, opportunities and benefits for all 31
7. Policy areas and activities by activity-based budgeting (ABB) 43
— Economic and financial affairs 46
— Enterprise 48
— Competition 50
— Employment and social affairs 52 — Agriculture and rural development 56 — Energy and transport 60
— Environment 64
— Indirect research 68
— Information society 72
— Direct research 74
— Fisheries 76
— Internal market 80
— Regional policy 82
— Taxation and customs union 86 — Education and culture 88 — Press and communication 92 — Health and consumer protection 94 — Justice and home affairs 98
— External relations 102
— Trade 106
— Development and relations with ACP countries 108
— Enlargement 110
— Humanitarian aid 112
Page
8. The fight against fraud 115
9. Borrowing and lending activities in 2004 121
10. Treasury report 125
Annexes
The economic recovery in the EU and euro area, which started in the summer of 2003, lost some momentum. After a surprisingly strong upside during the first half of 2004, the pace of expansion of economic activity in the EU decelerated somewhat in the third quarter of the year. Growth in both the EU and the euro area decelerated from 0.5 % (quarter-on-quarter) in the second quarter of 2004 to 0.3 % in the third quarter. In the autumn 2004 forecast, the average growth rate of GDP was estimated to be 2.5 % in the EU as a whole and 2.1 % in the euro area in 2004.
A major change in the third quarter compared with the previous two quarters was the strong negative impulse to growth emanating from the external sector (– 0.7 % in both the euro area and the EU). Compared with the previous quarter, the pace of growth in imports of goods and services accelerated strongly in the euro area and marginally in the EU, while the growth rate of exports slowed markedly. To a large extent, the deceleration of export growth reflected the negative impact on euro-area for-eign demand stemming from the softening of global growth around the middle of 2004. In addition, the appreciation of the euro since 2002 also appeared to have been gradually and increasingly weighing on external com-petitiveness.
Internally, the picture was dominated by the strongest inventory building in 10 years, which fully offset the negative contribution of net exports to GDP growth. Nevertheless, growth in fixed capital formation picked up speed — the growth rate more than doubled in the euro area compared with the previous quarter — while the rate of increase of private consumption expenditure diminished to less than half of the growth rate recorded in the first quarter of 2004.
Growth in domestic demand, excluding inven-tories, rose only modestly, from 0.2 % in the second quarter to 0.3 % in the third quarter, with the pick-up of investment explaining the
acceleration. Private consumption was close to a stand-still, growing for the second quarter in a row by just 0.1 % (quarter-on-quarter) in 2004Q3, far below the 0.7 % registered in the first quarter of the year (the highest rate of growth in three years). The lacklustre perfor-mance of private consumption probably re-flected stagnating consumer confidence, the slow deceleration of inflation, and persisting uncertainties related to developments in the labour market.
Investment, after falling from 1.0 % in the last quarter of 2003 to – 0.2 % in the first quarter of 2004, since then gradually picked up. Gross fixed capital formation rose by 0.3 % and 0.7 %, respectively, in the second and third quarters of 2004. While the data for the last two quarters, in line with some indicators typically correlated with investment, indicate that capital spending might be on a more sus-tained recovery path, other indicators suggest that it may be too early to draw such a conclu-sion. Capacity utilisation in the manufacturing sector was up by 0.4 % in the fourth quarter of 2004, compared with the previous quarter and, for the first time in nearly three years, just above its historical average (over the 1993–2004 period). New orders for invest-ment goods were also up in November, in-creasing by 1.7 % compared with the previous month. On the other hand, data on financial flows, such as the rate of growth of loans to non-financial corporations, declined in the third quarter.
admin-istered prices. On the other hand, core infla-tion (HICP excluding energy and unprocessed food) was mostly below 2 % during the year. After accelerating somewhat during the first half of 2004, core inflation slowed marginally in the second half to end the year at 1.9 %. In terms of annual averages, headline HICP in-flation in the euro area was 2.1 % in 2004. The same rate prevailed in 2003, which means that, for five consecutive years, average annu-al inflation has been above the 2 % mark.
Employment growth accelerated slightly dur-ing the first half of 2004. Reflectdur-ing stronger employment in industry and a stabilisation of employment growth in services, total employ-ment increased by 0.2 % in the second quarter compared with 0.1 % in the first quarter of 2004. Employment growth reached 0.1 % once again in the third quarter of 2004 (latest available figure). Marginal declines in em-ployment in the industrial (– 0.2 %) and con-struction sectors (– 0.3 %) were offset by in-creases in employment in services (0.3 %). With the deceleration in GDP growth in the third quarter of 2004, these employment de-velopments led to a decline in labour produc-tivity growth from an average growth rate of 0.4 % in the first half of the year to 0.1 % in the third quarter. In parallel with the employ-ment performance, the unemployemploy-ment rate in the euro area increased gradually between the
beginning of 2002 and the first quarter of 2003. Subsequently, the unemployment rate stabilised around 8.9–9 % of the labour force. The unemployment rate rose to 9 % in the first quarter of 2004, before edging back to 8.9 % in subsequent months to December.
The 2004 general government deficit for the euro area was estimated at 2.9 % of GDP in the Commission services’ autumn 2004 fore-casts, and this is broadly confirmed in the most recent updates of the stability pro-grammes (2.8 % of GDP). For the EU-25 as a whole, the deficit of 2.8 % of GDP predicted in the autumn is also broadly confirmed in the programme updates (2.7 %). The debt to GDP ratio for the EU as a whole is estimated at 63.5 % in 2004. For the euro area, the debt to GDP ratio increased to 71.1 % in 2004, from 70.7 % in 2003.
Since 1988, the Community budget has been defined within a multiannual financial frame-work — the financial perspective (FP) — in order to ensure tighter budgetary discipline and to improve the functioning of the budgetary procedure and interinstitutional cooperation.
The current financial perspective was agreed at the European Council in Berlin in March 1999 for seven years (2000–06). It is the third financial programming period after those of 1988–92 and 1993–99. Its definition and implementing provisions are further detailed in the Interinstitutional Agreement (IIA) of 6 May 1999 on budgetary discipline and improvement of the budgetary procedure.
2.1. Structure of the financial
perspective
Following the adjustment of the financial per-spective for enlargement adopted in 2003, the financial framework consists of eight head-ings — some of them broken down into sub-headings — with an annual ceiling for com-mitment appropriations set for each heading. The sum of all eight headings’ ceilings results in the global ceiling of appropriations for commitments. A corresponding estimate is then established for the annual ceiling of appropriations for payments.
[image:11.680.127.514.537.809.2]Table 1 below shows the financial perspective for the enlarged European Union with 25 Member States, adjusted to 2004 prices.
TABLE 1
Financial perspective (EU-25) adjusted for enlargement at 2004 prices
(million EUR) Current prices 2004 prices Commitment appropriations 2000 2001 2002 2003 2004 2005 20061. Agriculture 41 738 44 530 46 587 47 378 49 305 50 431 50 575 1a Common agricultural policy 37 352 40 035 41 992 42 680 42 769 43 724 43 735 1b Rural development 4 386 4 495 4 595 4 698 6 536 6 707 6 840 2. Structural actions 32 678 32 720 33 638 33 968 41 035 41 685 42 932 Structural Funds 30 019 30 005 30 849 31 129 35 353 36 517 37 028 Cohesion Fund 2 659 2 715 2 789 2 839 5 682 5 168 5 904 3. Internal policies 6 031 6 272 6 558 6 796 8 722 8 967 9 093 4. External actions 4 627 4 735 4 873 4 972 5 082 5 093 5 104 5. Administration (1) 4 638 4 776 5 012 5 211 5 983 6 154 6 325
6. Reserves 906 916 676 434 442 442 442 Monetary reserve 500 500 250 0 0 0 0 Emergency aid reserve 203 208 213 217 221 221 221 Guarantee reserve 203 208 213 217 221 221 221 7. Pre-accession aid 3 174 3 240 3 328 3 386 3 455 3 455 3 455
Agriculture 529 540 555 564 Pre-accession structural instrument 1 058 1 080 1 109 1 129 PHARE (applicant countries) 1 587 1 620 1 664 1 693
8. Compensation 1 410 1 299 1 041
Total appropriations for commitments 93 792 97 189 100 672 102 145 115 434 117 526 118 967 Total appropriations for payments 91 322 94 730 100 078 102 767 111 380 112 260 114 740
Ceiling, appropriations for payments
as % of GNI (ESA 95) 1.07 % 1.08 % 1.11 % 1.09 % 1.08 % 1.06 % 1.06 % Margin for unforeseen expenditure 0.17 % 0.16 % 0.13 % 0.15 % 0.16 % 0.18 % 0.18 % Own resources ceiling 1.24 % 1.24 % 1.24 % 1.24 % 1.24 % 1.24 % 1.24 % (1) The expenditure on pensions included under the ceiling for this heading is calculated net of staff contributions to the pension
2.2. Implementation of the
financial perspective (FP)
Technical adjustment
According to the provisions of the IIA, the Commission proceeds at the beginning of each budgetary procedure to the technical ad-justment of the FP in order to take into ac-count inflation and the evolution of GNI growth. This is required due to the financial perspective framework being originally ex-pressed in constant prices (1999 prices), which therefore needs to be adjusted to the most recent economic environment before the establishment of the preliminary draft budget for the following year.
The technical adjustment exercise is differen-tiated by heading. A fixed rate of 2 % per year is used as a deflator for:
amounts entered under heading 1 ‘Agriculture’,
amounts entered under subheading ‘Structural Funds’ of heading 2.
The GNI deflator in euro is applied to the amounts entered in all other headings (actual deflator). Because enlargement to the 10 new Member States took place in the middle of the year (1 May 2004), the technical adjustment for 2004 was exceptionally adopted by the Commission in two steps. On 23 December 2002, the Commission proceeded to the tech-nical adjustment for 2004 concerning the EU
with 15 Member States. On 19 May 2003, the technical adjustment of the financial perspec-tive for the EU with 25 Member States was adopted together with the adjustment of the financial perspective for enlargement.
Adjustment to take account of implementation
Another crucial exercise is the adjustment of the financial perspective to take account of implementation. This task is governed by the necessity to ensure an orderly progression of appropriations for payments in relation to the appropriations for commitments. Indeed, the financial perspective is established on the basis of an estimate of the ratio between ap-propriations for commitments and appropria-tions for payments. An error in this estimate would cause an imbalance between the two ceilings, for example lower commitments than expected would create a corresponding back-log in payments that would have to be made up later.
On 13 March 2001, the Commission adopted a proposal on the adjustment to take account of implementation, which would apply as from 2002. It led to the decision to raise the annual ceiling for commitment appropriations in the Structural Funds’ subheading of head-ing 2. As foreseen in the IIA, a delay in the adoption of programmes occurred in 2001 and EUR 6 152 million of the allocation could not be committed. This amount was therefore transferred to subsequent years by increasing the corresponding expenditure ceilings.
Transfers added to the annual ceilings
of the Structural Funds’ subheading of heading 2
(million EUR, 2001 prices)
2002 2003 2004 2005 2006
European Union Solidarity Fund
Following the disastrous floods that occurred in central Europe during summer 2002, the Commission proposed the creation of a European Union Solidarity Fund in order to provide relief in the face of such events. On 7 November 2002, the European Parlia-ment, the Council and the Commission signed an interinstitutional agreement in order to cre-ate the European Union Solidarity Fund. The related regulation was also proposed by the Commission to specify the conditions of mobilisation for the fund. This fund is endowed with a maximum annual amount of EUR 1 billion and can be mobilised above the financial perspective ceilings concerned.
In 2004, the EU Solidarity Fund was mobilised following the floods in France and Malta, as well as the forest fires in Spain by a financial amount of EUR 22 million.
Flexibility instrument
The flexibility instrument is a new feature of the 1999 Interinstitutional Agreement. It offers the possibility to cover the financing of clearly identified expenditure for a given financial year, which cannot be met within the ceilings available under one or more head-ings. Its annual ceiling amounts to EUR 200 million and its mobilisation is decided jointly by the two arms of the budgetary authority on the basis of a Commission proposal.
In 2004, the flexibility instrument was mobilised for the reconstruction of Iraq for an amount of EUR 95 million.
Following extensive internal preparations, the Commission presented a first communication on the future financial framework on 10 February 2004: ‘Building our common future — Policy challenges and budgetary means of the enlarged Union 2007–13’.
On 14 July, the Commission presented a sec-ond general communication on the financial framework for 2007–13, spelling out a set of detailed proposals for action. The communi-cation was accompanied by a number of spe-cific legislative proposals linked to the future financial framework and concerning in partic-ular the common agricultural and fisheries policies, rural development, the Structural Funds, employment and social policy, educa-tion, training and transport. The Commission
also presented a working document designed to serve as a basis for renewing the interinsti-tutional agreement on budgetary discipline and improvement of the budgetary procedure.
The Commission proposes that the Union concentrate its action over the next period on three main priorities: integrating the single market into the broader objective of sustain-able development; giving a real meaning to the concept of European citizenship; estab-lishing a coherent role for Europe as a global partner.
The financial framework table reproduced below forms Annex 1 to the working docu-ment on the future interinstitutional agree-ment.
The five headings of the proposed financial framework reflect the main policy goals of the European Union and form a simpler and less rigid structure than Agenda 2000. Further-more, Commission administrative expenditure is included directly under the relevant opera-tional headings: this will allow the financial framework to be in line with the rationale of activity-based management, which already forms the basis for establishing the annual budget.
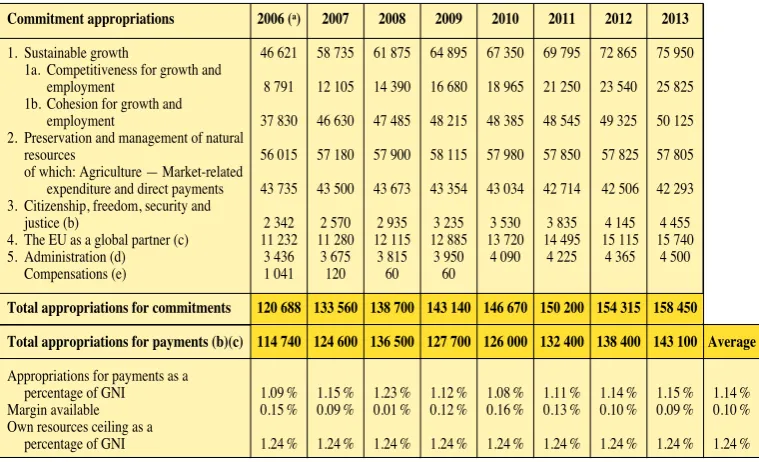
[image:14.680.172.552.255.486.2]The annual average ceiling on payment appro-priations for the period 2007–13 is 1.14 % of the gross national income (GNI) of the en-larged Union, leaving a substantial margin (ranging between 0.09 % and 0.16 % of GNI, depending on the year) under the 1.24 % own resources ceiling, which has remained con-stant since 1999 and which the Commission does not propose to change.
TABLE 2
Financial framework, 2007–13
(million EUR at 2004 prices) Commitment appropriations 2006 (a) 2007 2008 2009 2010 2011 2012 2013
1. Sustainable growth 46 621 58 735 61 875 64 895 67 350 69 795 72 865 75 950 1a. Competitiveness for growth and
employment 8 791 12 105 14 390 16 680 18 965 21 250 23 540 25 825 1b. Cohesion for growth and
employment 37 830 46 630 47 485 48 215 48 385 48 545 49 325 50 125 2. Preservation and management of natural
resources 56 015 57 180 57 900 58 115 57 980 57 850 57 825 57 805 of which: Agriculture — Market-related
expenditure and direct payments 43 735 43 500 43 673 43 354 43 034 42 714 42 506 42 293 3. Citizenship, freedom, security and
justice (b) 2 342 2 570 2 935 3 235 3 530 3 835 4 145 4 455 4. The EU as a global partner (c) 11 232 11 280 12 115 12 885 13 720 14 495 15 115 15 740 5. Administration (d) 3 436 3 675 3 815 3 950 4 090 4 225 4 365 4 500
Compensations (e) 1 041 120 60 60
Total appropriations for commitments 120 688 133 560 138 700 143 140 146 670 150 200 154 315 158 450 Total appropriations for payments (b)(c) 114 740 124 600 136 500 127 700 126 000 132 400 138 400 143 100 Average
Appropriations for payments as a
percentage of GNI 1.09 % 1.15 % 1.23 % 1.12 % 1.08 % 1.11 % 1.14 % 1.15 % 1.14 % Margin available 0.15 % 0.09 % 0.01 % 0.12 % 0.16 % 0.13 % 0.10 % 0.09 % 0.10 % Own resources ceiling as a
percentage of GNI 1.24 % 1.24 % 1.24 % 1.24 % 1.24 % 1.24 % 1.24 % 1.24 % 1.24 % (a) 2006 expenditure under the current financial perspective has been broken down according to the proposed new nomenclature for
reference and to facilitate comparisons. Expenditure in headings 3 and 4 includes amounts corresponding to the solidarity instrument (EUR 961 million at 2004 prices in 2006) and EDF (estimated at EUR 3 billion), respectively.
(b) Includes expenditure for the solidarity instrument (EUR 961million at 2004 prices in 2006) as from 2006. However,
correspond-ing payments are calculated only as from 2007.
(c) The integration of EDF in the EU budget is assumed to take effect in 2008. Commitments for 2006 and 2007 are included only
for comparison purposes. Payments on commitments before 2008 are not taken into account in the payment figures.
(d) Includes administrative expenditure for institutions other than the Commission, pensions and European schools. Commission
administrative expenditure is integrated in the first four expenditure headings.
(e) Amounts foreseen in the agreed European Union common position for the accession conference with Bulgaria (CONF-BG
1. Policy strategy priorities
The annual policy strategy sets the framework for the budgetary and legislative cycle. The steps following the adoption of the annual policy strategy are the preparation of the pre-liminary draft budget and the interinstitutional dialogue on the basis of the orientations de-cided in the annual policy strategy. The cycle is completed with the adoption of the legisla-tive and work programme, by which the Com-mission, on the basis of the budgetary process and the results of the interinstitutional dia-logue, announces the actions it intends to take forward over the coming year. The whole cycle forms then the basis for the operational programming done by the Directorates-Gener-al and services, which translate the politicDirectorates-Gener-al priorities into their annual management plans.
During its orientation debate on policy priori-ties for 2004, the College decided to pursue and deepen the priorities identified for 2003. The central priority remained enlargement, and in particular the accession of 10 new Member States. The two connected priorities are stabili-ty and sustainable growth, which built upon the stability and security and the inclusive and sus-tainable economy priorities for 2003.
2. Evolution from PDB to
voted budget
Budget guidelines
The Council
In conclusions adopted on 7 March 2003, the Council underlined the two major challenges that would mark the budgetary procedure for 2004: the 2004 budget would be the first one adopted in accordance with the provisions of the new financial regulation which stipulates the use of activity-based budgeting (ABB); it would also be the first budget to take full ac-count of the forthcoming enlargement in the course of 2004. The Council stressed the importance of keeping a tight grip on payment appropriations for 2004.
Parliament
On 11 March 2003, Parliament adopted a resolution on the 2004 budget guidelines, in which it invited all the institutions to present their estimates in a more transparent manner, in order to cope with the material require-ments of enlargement, such as building needs. Parliament itself presented its estimates on 14 May. In another resolution adopted on 11 March, Parliament stressed the contribu-tion which the 2004 budget should make to the political aim of uniting Europe, in particu-lar by helping to meet the challenge of inte-grating 10 new Member States into all Community policies.
Preliminary draft budget
for the enlarged 25-nation Union (EU-25). The EU-15 budget would apply from 1 January 2004, while the EU-25 budget would be adopted by means of an amending budget and would enter into force on 1 May 2004.
Appropriations for commitments came to EUR 111.3 billion for the enlarged Union, of which EUR 11.8 billion was for the new Member States, representing an increase of 11.7 % on 2003 (– 0.27 % for the EU-15); the total amount left a margin of EUR 4.3 billion beneath the ceiling for 2004 in the 2000–06 financial perspective. Appropriations for pay-ments came to EUR 99.7 billion, of which EUR 5.1 billion was for the new Member States, an increase of 7.7 % compared with 2003 (2.3 % for the EU-15); the total appro-priations for payments were well below — by EUR 11.9 billion — the ceiling agreed for 2004 in the financial perspective and repre-sented 0.99 % of the gross national income of the EU-25, well under the Community ceiling of 1.24 % and even below the corresponding percentage in the 2003 budget (1.03 % of the GNI of the EU-15).
Draft budget
The draft 2004 budget established by the Council at first reading on 18 July 2003, on the basis of 25 Member States, came to EUR 111.092 billion in appropriations for commit-ments and EUR 99.724 billion in appropria-tions for payments.
Use of the flexibility instrument
On 1 October, the Commission proposed that the flexibility instrument provided for in the Interinstitutional Agreement of 6 May 1999 be used to mobilise EUR 74 million to finance the Community’s contribution to the rehabili-tation and reconstruction of Iraq. At the concil-iation meeting on 24 November, Parliament and the Council decided to raise this amount to
EUR 95 million, as part of the overall agree-ment on the second reading of the budget.
Letters of amendment
No 1/2004. Established by the Commission on 1 October, this letter of amendment cov-ered five points:
the creation of a new article for the Com-munity contribution to the rehabilitation and reconstruction of Iraq;
the creation of a new article to facilitate the implementation in 2004 of the non-differentiated appropriations contracted in 2003 and carried over automatically to 2004;
the adjustment of two headings concerning the guarantee provided by the Community to the European Investment Bank for loans;
the addition or modification of budget remarks to a number of budget lines cover-ing tasks resultcover-ing from the Commission’s prerogatives at institutional level; and
the adjustment of the Commission’s estab-lishment plan for research and technologi-cal development.
For the fisheries agreements, some EUR 3 million was transferred from the reserve to the relevant line in order to cover agreements renewed or extended in 2003.
No 3/2004. On 12 November, the Commis-sion established a third letter of amendment to the 2004 PDB to create a new revenue line for each institution to accommodate the new special levy on staff salaries which was introduced as part of the Commission reform.
Parliament’s first reading
At first reading on 23 October, Parliament adopted a budget of EUR 111.4 billion for commitments and EUR 102.6 billion for pay-ments. The payment appropriations, which Parliament increased by EUR 3.3 billion in relation to the Council’s draft budget, repre-sented 1.02 % of the GNI of the EU-25.
Parliament’s main additions to the Council draft were the following:
on agricultural expenditure, Parliament underlined the improvement in quality in agriculture and the establishment of an integrated supply chain for agricultural products and adopted an amendment de-signed to take account of the situation of young farmers;
Parliament wanted to boost the payment appropriations for structural measures in order to better reflect the Member States’ forecasts and to take account of the volume of outstanding commitments;
internal policies received special attention, the particular focus being on small busi-nesses;
on external policies, Parliament wanted to devote EUR 200 million to the reconstruc-tion of Iraq, and was waiting for a decision on the mobilisation of the flexibility instru-ment.
Council’s second reading
The Council gave the draft 2004 budget its second reading on 24 November after a con-ciliation meeting with a Parliament delega-tion. The second reading, incorporating letters of amendment Nos 1, 2 and 3, produced a total of EUR 111.1 billion for commitments and EUR 99.3 billion for payments.
The broad lines of the changes made by the Council were:
for heading 1 (agriculture), the Council approved the updated estimates presented in letter of amendment No 2/2004 and restored the PDB amounts for the lines in subheading 1a, which were not affected by the letter of amendment;
for heading 2 (structural operations) and heading 7 (pre-accession aid), the Council confirmed its first reading;
for heading 3 (internal policies), the Council accepted some of the amendments proposed by Parliament that were of a technical nature and certain pilot projects, in particular the one for victims of acts of terrorism;
for heading 4 (external actions), the Coun-cil accepted letter of amendment No 1/2004, with an additional EUR 160 mil-lion for the reconstruction of Iraq. It also increased the common foreign and security policy budget by EUR 10 million and made cuts on other lines totalling EUR 34 million in relation to its first reading in order to remain below the financial per-spective ceiling without having to make use of the flexibility instrument.
Parliament’s second reading
TABLE 3
The breakdown, by financial perspective heading, of commitment appropriations for the EU-25 entered at the various stages of the 2004 budgetary procedure is given in the following table.
(million EUR)
Heading Voted Financial Preliminary Council Parliament Council Voted Difference budget perspective draft (first (first (second budget voted budget 2003 ceiling budget reading) reading) reading 2004 2004/voted
2004 2004 budget 2003 (%) 1. Agriculture 44 780 49 305 46 781 46 765 46 815 46 781 46 781 + 4.5
Margin 2 598 2 524 2 540 2 490 2 524 2 524
2. Structural operations 33 980 41 035 41 035 41 035 41 035 41 035 41 035 + 20.8
Margin – 12 0 0 0 0 0
3. Internal policies 6 796 8 722 8 614 8 584 8 674 8 587 8 683 + 27.8 Margin 0.2 108 138 48 135 38
4. External action 4 949 5 082 5 156 5 096 5 217 5 072 5 176 + 4.7 Margin 23 – 74 – 14 – 135 10 – 94
5. Administration 5 360 6 157 6 086 6 029 6 070 6 039 6 039 + 12.7 Margin 20 71 128 87 118 117
6. Reserves 434 442 442 442 442 442 442 + 1.8
Margin 0 0 0 0 0 0
7. Pre-accession aid 3 386 3 455 1 732 1 732 1 732 1 732 1 732 – 49.8 Margin 0 1 723 1 723 1 723 1 722 1 723
Total appropriations 99 686 115 808 111 257 111 092 111 395 111 099 111 300 + 11.7 for commitments
Margin 2 629 4 351 4 516 4 213 4 509 4 308
The breakdown, by financial perspective heading, of payment appropriations for the EU-25 entered at the various stages of the 2004 budgetary procedure is given in the following table.
(million EUR)
Heading Voted Preliminary Council Parliament Council Voted Difference 2003 draft (first (first (second budget voted budget budget budget reading) reading) reading) 2004 2004/ voted
2004 budget 2003 (%) 1. Agriculture
Margin 44 780 45 693 45 677 45 727 45 693 45 693 + 2.0 2. Structural operations
Margin 33 173 30 682 30 522 32 570 30 522 30 822 -7.1 3. Internal policies
Margin 6 204 7 471 7 450 7 870 7 453 7 510 + 21.1 4. External action
Margin 4 844 4 920 4 892 5 294 4 892 4 951 + 2.2 5. Administration
Margin 5 360 6 086 6 028 6 070 6 039 6 040 + 12.7 6. Reserves
Margin 434 442 442 442 442 442 + 1.8 7. Pre-accession aid
Margin 2 707 2 956 2 856 3 196 2 856 2 856 + 5.5
4. Amending budgets
Amending budget (AB) Adoption date Subject
AB No 1/2004 9 March Adaptation to the enlargement (from the EU-15 to the EU-25) AB No 2/2004 9 March European Data Protection Supervisor
AB No 3/2004 30 March European Solidarity Fund AB No 4/2004 1 April Amendments in Staff Regulations
AB No 5/2004 21 April Publication of the acquis communautairein the new official languages and revision of remuneration
AB No 6/2004 22 April Executive Agency for Intelligent Energy AB No 7/2004 14 September Surplus 2003
AB No 8/2004 14 September Own resources and Guarantee Fund AB No 9/2004 14 October European Data Protection Supervisor AB No 10/2004 Structural Funds
EUR 111.3 (EU-15: EUR 99.5) billion for com-mitments and EUR 99.7 (EU-15: EUR 94.6) billion for payments. Compared with 2003, commitment appropriations were increased by 11.7 % (EU-15: – 0.3 %) and payment appro-priations by 2.3 % (EU-15: – 3.0 %). This left a substantial margin of EUR 11.8 (EU-15: EUR 7.7) billion for payments and EUR 4.3 (EU-15: EUR 4.5) billion for commitments. The 2004 payments budget represents 0.98 % of Member States’ GNI, the authorised ceiling being 1.06 %. This made the 2004 budget the smallest initial budget since 1990.
3. Budgetary adjustments
Appropriations carried forward
from 2003 to 2004
As a general rule, appropriations which have not been used at the end of the financial year for which they were entered shall be can-celled. However, they may be carried over to the following financial year only, by a deci-sion taken by the institution concerned by 15 February at the latest.
Commitment appropriations may be carried over in two cases:
(a) the preparatory stages of the commitment procedure have been completed by 31
December and these amounts may then be committed up to 31 March of the follow-ing year, and
(b) the basic act was adopted in the final quarter of the financial year and the Commission has been unable to commit the appropriations by 31 December.
Payment appropriations may be carried over in respect of amounts needed to cover existing commitments, when the appropriations bud-geted for the following financial year do not cover requirements.
The Commission decided to carry forward the appropriations below.
(million EUR) Heading Commitments Payments
1. Agriculture 41 41 2. Structural
operations 7 177 3. Internal policies 55 108 4. External actions 52 22 5. Administration 1 1 7. Pre-accession aid 4 1
within budget lines of the same chapter. Other transfers require a decision by the budgetary authority. In 2004, the budgetary authority decided on the following transfers with structural changes for the budget.
Transfers from the initial
reserve (transfers of provisional
appropriations)
The initial reserve consisting of provisional appropriations is voted together with the initial budget. These appropriations are provi-sional in the sense that their purpose has been defined, but the budgetary authority has set conditions that have to be fulfilled before they can be released, for example adoption of the legislation, presentation of work programme or progress report, etc.
The breakdown of transfers from the initial reserve by heading was as follows.
Transfers from initial reserve
Heading Commitments Payments
Initial Transfers Current Initial Transfers Current
reserve reserve reserve reserve
incl. AB end-2004 incl. AB end-2004
1. Agriculture 0 0 0 0 0 0
2. Structural operations 0 0 0 0 0 0 3. Internal policies 151 204 972 132 320 229 18 884 743 97 401 892 76 332 342 21 069 550 4. External actions 176 901 793 176 251 100 650 693 118 101 793 117 031 100 1 070 693 5. Administration 22 542 280 17 542 872 4 999 408 22 542 280 17 542 872 4 999 408 7. Pre-accession aid 40 000 000 25 000 000 15 000 000 0
Total 390 649 045 351 114 201 39 534 844 238 045 965 210 906 314 27 139 651
representing some EUR 798 million in commit-ments and EUR 1 676 million in paycommit-ments.
The global transfer amounted to EUR 753 million and covered 130 different budget lines: the net result was an increase of Considering the amending budget No 1
relat-ing to enlargement as a technical adaptation of the voted budget, the impact of the amend-ing budgets 2–10 were as follows:
(million EUR)
5. Transfers
Each institution may, within its own section of the budget, make transfers from one budget line to another subject to certain conditions. The Commission is allowed to make transfers
Heading
1. Agriculture – 1 700 – 1 700 2. Structural operations 3 700 3. Internal policies 21
4. External actions
5. Administration 53 53 6. Reserves
7. Pre-accession aid 1
Total including compensation – 1 625 2 053
Other transfers
EUR 176 million in payment credits for pre-accession aid (financial perspective heading 7) under Phare and Sapard, taken from head-ings 3, 4 and 5.
Under agriculture, the main transfer in 2004 was an increase of EUR 140 million for the ‘Emergency fund for veterinary complaints and other animal contaminants which are a danger to public health’, offset by appropria-tions from several other lines.
For internal policies, a rebalancing of pay-ment credits under research activities to the tune of EUR 105 million was needed to bring
forecast expenditure into line with actual progress on projects.
The main transfer movements for external action comprised additional assistance to the Balkans, comprising EUR 25 million for the western Balkans and EUR 24 million for Kosovo, and EUR 25 million to increase humanitarian aid to Darfur.
Under heading 6 (reserves) the main transfer concerned an amount of EUR 162 million for payments to the Guarantee Fund (by which the Community guarantees certain loans) in respect of new external operations.
Transfers between chapters
Heading Commitments Payments
Transfers Transfers Impact Transfers Transfers Impact to a from a between to a from a between chapter chapter headings chapter chapter headings
1. Agriculture 139 665 000 – 140 165 000 – 500 000 139 665 000 – 204 165 000 – 64 500 000 2. Structural operations 1 039 754 – 1 039 754 0 60 759 – 21 977 754 – 21 916 995 3. Internal policies 163 056 662 – 30 236 433 132 820 229 513 692 465 – 518 586 348 – 4 893 883 4. External actions 240 185 997 – 63 934 897 176 251 100 470 688 269 – 413 904 897 56 783 372 5. Administration 45 251 458 – 27 708 586 17 542 872 45 199 538 – 40 686 938 4 512 600 Reserve – 17 542 872 – 17 542 872 – 17 542 872 – 17 542 872 45 251 458 – 45 251 458 0 45 199 538 – 58 229 810 – 13 030 272 6. Reserves 181 875 000 – 515 446 329 –333 571 329 181 875 000 – 375 238 442 – 193 363 442 7. Pre-accession aid 26 500 000 – 1 500 000 25 000 000 324 461 220 – 83 540 000 240 921 220
The budget of the European Union is financed by own resources and other revenue. In 2004, own resources amounted to EUR 95.1 billion and other revenue to EUR 8.2 billion (of which EUR 5.5 billion corresponded to the surplus carried over from the previous year).
When the Council and Parliament approve the annual budget, total revenue must equal total expenditure. The total amount needed to finance the budget follows automatically from the level of total expenditure. However, since out-turns of revenue and expenditure usually differ from the budgeted estimates, there is a balance of the exercise resulting from the implementation. Normally, there has been a surplus, which reduces Member States’ own resources payments in the subsequent year.
4.1. Own resources
The basic rules on the system of own resources are laid down in a Council decision (currently 2000/597/EC, Euratom), adopted by unanimity in the Council and ratified by all Member States. Own resources can be defined as revenue accruing automatically to the EU in order to finance its budget without the need for any subsequent decision by national authori-ties. The overall amount of own resources needed to finance the budget is determined by total expenditure less other revenue. The total amount of own resources cannot exceed 1.24 % of the EU gross national income (GNI).
Own resources can be divided into the follow-ing categories:
traditional own resources (TOR), which in-clude two categories: agricultural duties and sugar levies on the one hand and customs duties on the other hand;
the VAT-based own resource;
the GNI-based own resource (the ‘addi-tional fourth resource’), which plays the role of residual resource.
Finally, a specific mechanism for correcting budgetary imbalances in favour of the United Kingdom (UK rebate) is also part of the own resources system.
4.1.1. Traditional own resources
(customs duties, agricultural
duties and sugar levies)
Traditional own resources (TOR) are levied on economic operators and collected by Mem-ber States on behalf of the EU. TOR payments accrue directly to the EU budget, after deduc-tion of a 25 % compensadeduc-tion retained by the Member States to cover collection costs.
Agricultural duties and customs duties are levied on imports of agricultural and non-agri-cultural products from third countries, at rates based on the Common Customs Tariff. In 2004, these resources corresponded to 1.4 % and 11.1 % of total own resources, respective-ly. Since these resources are paid with a two-month delay to the EU budget, the 10 new Member States contributed only during half of the year in 2004 (i.e. July–December).
Sugar levies are paid by sugar producers to finance the export refunds for sugar. Revenue from this resource amounted to 0.4 % of total own resources payments in 2004. Due to the particular payment regime of this resource to the EU budget, the 10 new Member States did not pay any sugar levies to the EU budget in 2004. Their first payments of these levies will occur in 2005.
4.1.2. The own resource based
on value added tax (VAT)
The VAT-based own resource is levied on Member States’ VAT bases, which are
har-(1) Data indicated for 2004 are the latest available as at
monised for this purpose in accordance with Community rules. The same percentage is levied on the harmonised base of each Mem-ber State. However, the VAT base to take into account is capped at 50 % of each Member State’s GNI. This rule is intended to avoid the less prosperous Member States paying out of proportion to their contributive capacity, since consumption and hence VAT tend to account for a higher percentage of a country’s national income at relatively lower levels of prosperity.
In 2004, the 50 % ‘capping’ was applied to 13 Member States (Czech Republic, Estonia, Greece, Spain, Ireland, Cyprus, Luxembourg, Hungary, Malta, Poland, Portugal, Slovenia and the United Kingdom).
The maximum percentage rate of the VAT base that can be called is fixed at 0.50 % in 2004. However, this rate must be decreased to take account of the UK correction (see below). The actual rate of call of VAT in 2004 amounted to 0.2984 % (rounded figure).
The total amount of the VAT-based resource (including adjustments for previous years) levied in 2004 reached EUR 13.9 billion or 14.6 % of total own resources. The 10 new Member States, which joined the EU on 1 May, contributed to the VAT-based own resource during two thirds of the year only (i.e. May–December) in 2004.
4.1.3. The own resource based
on gross national income (GNI)
The GNI-based own resource (‘additional fourth resource’) was introduced in 1988 to balance budget revenue and expenditure, i.e. to finance the part of the budget not covered by other rev-enue. The same percentage rate is levied on each Member State’s GNI, which is established in ac-cordance with Community rules.
The rate is fixed during the budgetary proce-dure. The amount of the GNI resource needed depends on the difference between total
expen-diture and the sum of all other revenue. In 2004, the rate of call of the GNI-based resource amounted to 0.6972 % (rounded figure).
The total amount of the GNI-based resource (including reserves and adjustments for previ-ous years) levied in 2004 reached EUR 69.0 billion or 72.6 % of total own resources. The 10 new Member States, which joined the EU on 1 May, contributed to the GNI-based own resource during two thirds of the year only (i.e. May–December) in 2004.
4.1.4. The correction of
budgetary imbalances in favour
of the United Kingdom
(UK rebate)
The current UK rebate mechanism was intro-duced in 1985 to correct the imbalance between the United Kingdom’s share in pay-ments to the Community budget and its share of Community expenditure allocated to the Member States. This mechanism has been modified on several occasions to compensate for changes in the system of EU budget financ-ing, but the basic principles remain the same.
This imbalance is calculated as the difference between the percentage share of the UK in EU expenditure paid in the Member States (‘allo-cated expenditure’) and the UK share in total VAT-based and GNI-based own resources payments. The difference in percentage points is multiplied by the total amount of EU expenditure allocated to the Member States. The UK is reimbursed by 66 % of this budgetary imbalance.
The total amount of the UK rebate paid in 2004 amounted to EUR 5.3 billion. The 10 new Member States, which joined the EU on 1 May, contributed to these payments during two thirds of the year only (i.e. May– December) in 2004.
4.2. Other revenue
The part of the general budget not financed by own resources includes tax and other deduc-tions from staff remuneradeduc-tions, bank interest,
contributions from non-member countries to certain Community programmes (e.g. in the research area), repayments of unused Com-munity financial assistance, interest on late payments as well as the balance from the previous exercise. However, this last item is mainly derived from the difference between the out-turn of own resources payments and expenditure in the previous year.
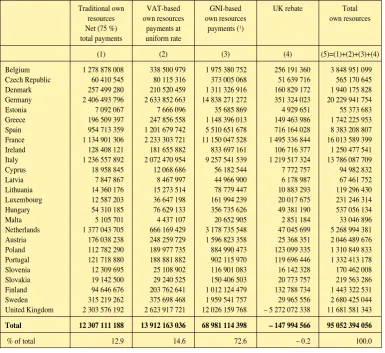
[image:24.680.170.556.446.799.2]In 2004 other revenue amounted to EUR 8.2 billion, of which EUR 5.5 billion correspond-ed to the surplus carricorrespond-ed over from the year 2003.
TABLE 4
Own resources payments by Member State in 2004
(EUR)
Traditional own VAT-based GNI-based UK rebate Total resources own resources own resources own resources Net (75 %) payments at payments (1)
total payments uniform rate
(1) (2) (3) (4) (5)=(1)+(2)+(3)+(4) Belgium 1 278 878 008 338 500 979 1 975 380 752 256 191 360 3 848 951 099 Czech Republic 60 410 545 80 115 316 373 005 068 51 639 716 565 170 645 Denmark 257 499 280 210 520 459 1 311 326 916 160 829 172 1 940 175 828 Germany 2 406 493 796 2 633 852 663 14 838 271 272 351 324 023 20 229 941 754 Estonia 7 092 067 7 666 096 35 685 869 4 929 651 55 373 683 Greece 196 509 397 247 856 558 1 148 396 013 149 463 986 1 742 225 953 Spain 954 713 359 1 201 679 742 5 510 651 678 716 164 028 8 383 208 807 France 1 134 901 306 2 233 303 721 11 150 047 528 1 495 336 844 16 013 589 399 Ireland 128 408 121 181 655 882 833 697 161 106 716 377 1 250 477 541 Italy 1 236 557 892 2 072 470 954 9 257 541 539 1 219 517 324 13 786 087 709 Cyprus 18 958 845 12 068 686 56 182 544 7 772 757 94 982 832 Latvia 7 847 867 8 467 997 44 966 900 6 178 987 67 461 752 Lithuania 14 360 176 15 273 514 78 779 447 10 883 293 119 296 430 Luxembourg 12 587 203 36 647 198 161 994 239 20 017 675 231 246 314 Hungary 54 310 185 76 629 133 356 735 626 49 381 190 537 056 134 Malta 5 105 701 4 437 107 20 652 905 2 851 184 33 046 896 Netherlands 1 377 043 705 666 169 429 3 178 735 548 47 045 699 5 268 994 381 Austria 176 038 238 248 259 729 1 596 823 358 25 368 351 2 046 489 676 Poland 112 782 290 189 977 735 884 990 473 123 099 335 1 310 849 833 Portugal 121 718 880 188 881 882 902 115 970 119 696 446 1 332 413 178 Slovenia 12 309 695 25 108 902 116 901 083 16 142 328 170 462 008 Slovakia 19 142 500 29 240 525 150 406 503 20 773 757 219 563 286 Finland 94 646 676 203 762 641 1 012 124 479 132 788 734 1 443 322 531 Sweden 315 219 262 375 698 468 1 959 541 757 29 965 556 2 680 425 044 United Kingdom 2 303 576 192 2 623 917 721 12 026 159 768 – 5 272 072 338 11 681 581 343
Total 12 307 111 188 13 912 163 036 68 981 114 398 – 147 994 566 95 052 394 056
% of total 12.9 14.6 72.6 – 0.2 100.0
(1) For simplicity of presentation, GNI based own resources payments are shown including the adjustment for the impact of
non-participation of certain Member States to the justice and home affairs policy NB Total amount of own resources payments in percentage of total EU GNI: 0.93 %
0 5
– 5 10 15 20 25 30 35 40 45 50 55 60 65 70 75 80 85 90 95 100 105
1993
[image:25.680.131.397.214.453.2]1992 1994 1995 1996 1997 1998 1999 2000 2001 2002 2003 2004
FIGURE 2
EU revenue 1992–2004 (billion EUR)
Other (including the surplus from the previous year)
GNI-based own resource payments
FIGURE 1
EU revenue in 2004
TOR (traditional own resources) payments
VAT-based own resource payments GNI-based own resource payments
Other (including the surplus from the previous year) 13.5 %
11.9 %
7.9 %
66.8 %
VAT-based own resource payments
TOR (traditional own resources) payments
NB: Data indicated for 2004 are the latest available as at end February 2005. These data are provisional and may differ from the final data which will be published in the 2004 annual accounts.
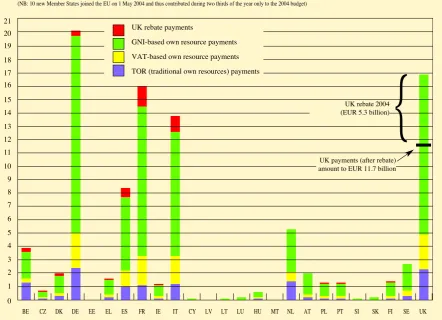
[image:25.680.131.584.423.833.2]0 1 2 3 4 5 6 7 8 9 10 11 12 13 14 15 16 17 18 19 20 21
Own resources by Member State in 2004 (billion EUR)
UK rebate payments
GNI-based own resource payments
VAT-based own resource payments
TOR (traditional own resources) payments
BE CZ DK DE EE EL ES FR IE IT CY LV LT LU HU MT NL AT PL PT SI SK FI SE UK UK payments (after rebate) amount to EUR 11.7 billion
{
UK rebate 2004 (EUR 5.3 billion)
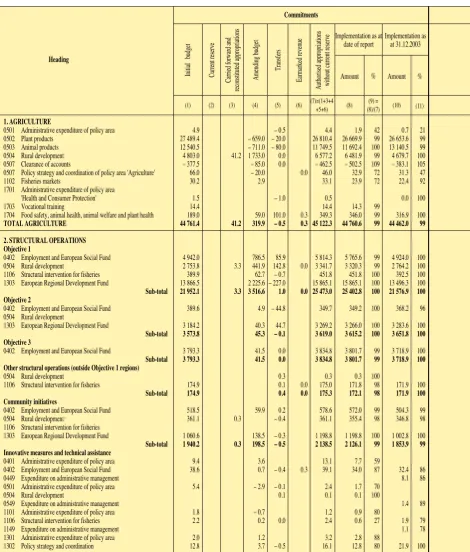
[image:26.680.107.550.234.554.2]For the 2004 budget year, EUR 109 billion was committed from total available appropria-tions of EUR 111 billion, an implementation rate of 98 %. Payments made amounted to EUR 100 billion from total available appro-priations of EUR 105 billion, an implementa-tion rate of 95 % compared with EUR 91 bil-lion or 92 % in 2003.
The commentary that follows concentrates on the financial perspective headings that are the key contributing factors to the underutilisation of the budget appropriations (comprising for the EU-25 the initial budget appropriations, the initial reserve, amending budgets, trans-fers, and carry-overs), and the main changes compared with the initial voted budget. In the following tables, the initial voted budget cov-ers the EU-25, including the EU-10 budget adopted in April 2004. The tables show at
heading level the aggregate implementation for the total voted budget including transfers and amending budgets (AB), and, separately, the utilisation of appropriations added to the budget by way of appropriations carried for-ward from 2003 and earmarked revenue. The assessment of the implementation of ear-marked revenue (for example, interest on ad-vance payments, reimbursements at the occa-sion of programme/contract closures, EFTA contributions, etc.) needs to be different in the sense that its use is subject to specific condi-tions, it is difficult to programme or in some cases (refunds following closure of certain programmes) it is not meant to be reused. Normally, payments are entered in the budget with an amount corresponding to the ear-marked commitments, even if it is clear from the outset that payments will be implemented only in later years. Furthermore, earmarked
1. Introduction
This commentary and related tables provide a provisional overview of the evolution of bud-getary appropriations during the year and the status of budget implementation at year-end for the 2004 budget.
The provisional implementation situation by financial perspective heading for end-2004 is
summarised below in percentage terms, in comparison with last year. For 2004, the data for all headings are based on provisional data as at 2 February 2005 for total available appropriations (1) and implementation.
Heading Implementation of commitment appropriations Implementation of payment appropriations
2004 2003 2004 2003
1. Agriculture 99 99 98 98
2. Structural operations 99 100 99 90
3. Internal policies 92 93 81 79 4. External actions 97 97 90 88
5. Administration 96 99 85 87
6. Reserves 41 45 41 40
7. Pre-accession aid 94 98 95 80 8. EU-10 compensation 100 100
Total 98 99 95 92
(1) Total available appropriations are defined as the initial
budget, carry-forwards (including reconstitution and reuse of appropriations), initial reserves, amending budgets, trans-fers, and earmarked revenue (e.g. EFTA contributions and third-party receipts); they also include here the administra-tive appropriations for other EU institutions.
revenue remaining unused at the end of the year will not be cancelled but carried forward automatically.
2. Agriculture (heading 1)
(million EUR)
Agricultural commitments made were EUR 44.8 billion, or in percentage terms similar to the 99 % outcome for the same period last year. For CAP-related expenditure (heading 1a), an underutilisation of EUR 270 million mainly concerns:
EUR 140 million for plant products (0502), primarily the cereals sector as the bad har-vest in 2003 resulted in higher world prices in relation to the forecasts used at the time of establishing the 2004 budget, and export refunds for the sugar sector as less quantities
were exported than provided for in the budget;
EUR 60 million for animal products
(0503), due to various factors affecting the dairy and meat sectors.
For rural development, subheading 1b, under-spending amounted to EUR 95 million, slight-ly higher than last year. Of the unused appro-priations for the heading, EUR 49.5 million for rural development programmes is carried forward to 2005.
Initial budget
EU-25 Initial reserve (less reserves)Transfers Amending budget (AB)
Carried forward, etc.
from 2003
Total (incl. carried
forward) Commitments
Appropriations 46 781 0 = (+ 2 496 – 2 496) – 1 700 41 45 122 Implementation 44 719 (99 %) 41 44 760 99 %
Payments
Appropriations 45 692 – 16 = (+ 2 544–2 560) – 1 700 326 44 302 Implementation 43 267 (98 %) 312 43 579 98 %
NB: The third column is the net amount of appropriations approved for transfer (excluding transfers from reserve) with the aggre-gate movements to and from the heading in brackets.
3. Structural operations (heading 2)
(million EUR) Initial
budget EU-25
Initial
reserve transfers (less Total reserves) AB
Carried forward, etc.
from 2003
Earmarked revenue
Total (incl. carried forward and earmarked
revenue) Commitments
Appropriations 41 035 0 = (+ 311 – 311) – 4 7 8 41 046
Implementation 40 819 (99 %) 7 7 40 833 99 %
Payments
Appropriations 30 822 –72 = (+ 4 322 – 4 394) 3 700 177 8 34 635
Commitments
Almost full implementation of commitment appropriations was reached for this heading, with EUR 213 million unutilised that mainly relate to Structural Fund programmes under Objective 1 (EUR 70 million) and the Cohe-sion Fund (EUR 64 million). Of the unused appropriations in 2004, EUR 115.2 million is carried forward to 2005.
Payments
In November, an amending budget (AB10/2004) increased the payment appropri-ations for the Structural Funds by EUR 3.7 billion to cover expected additional needs for the remainder of the year. This was funded by transfers of EUR 1.7 billion from agriculture (heading 1a), an increase of EUR 1.5 billion
in the revenue forecast and a call on the Member States for new resources of EUR 500 million.
Total payments for the heading amounted to EUR 34.2 billion, or 99 % of available appro-priations, an underutilisation of around EUR 435 million, of which — and excluding earmarked revenue — EUR 294 million relates to the Structural Funds mainly for programmes under Objective 1 (EUR 150 million). For the Cohesion Fund, EUR 135 million in payment appropriations was not used.
Of the unused payment appropriations under this heading in 2004, EUR 184.2 million is carried forward to 2005, of which EUR 37.9 million concerns Objective 1 programmes and EUR 133.2 million relates to the Cohesion Fund.
4. Internal policies (heading 3)
(million EUR)
Initial budget EU-25
Initial
reserve transfers (less Total reserves) AB
Carried forward, etc.
from 2003
Earmarked revenue
Total (incl. carried forward and earmarked
revenue) Commitments
Appropriations 8 533 151 0 = (+ 165 – 165) 21 55 1 089 9 849
Implementation 8 470 (97 %) 51 489 9 010 92 %
Payments
Appropriations 7 413 97 – 78 = (+ 805–883) 0 108 1 451 8 991
Implementation 6 711 (90 %) 76 468 7 255 81 %
Commitments
From the initial reserve of EUR 151 million, EUR 132 million was released during the year to various budget lines within the heading. In addition, through AB No 3, EUR 21 million was transferred from the EU Solidarity Fund
to cover emergency aid following the floods in France and Malta, and the forest fires in Spain.
Commitments made amounted to EUR 9 billion, or 92 % of the total available appro-priations, an underutilisation of around
EUR 850 million. This compares with 93 % for the same period last year. Of the unused appropriations, EUR 600 million relates to earmarked revenue, and mostly concerns the completion of previous framework pro-grammes under research and technological development. The remaining unused appropri-ations of EUR 250 million are budget appro-priations that are spread across the heading.
Of the appropriations that could not be used before end-year 2004, EUR 35 million is carried forward to 2005.
Payments
EUR 76 million was released to the heading from the initial reserve of EUR 97 million. The main transfers for the heading were included in the annual global transfer as follows:
EUR 103 million was moved from the heading to offset additional payment needs identified for pre-accession aid under heading 7. This mainly concerned EUR 100 million from trans-European networks
(0603), as a result of delays in establishing certain individual 2004 commitments for
trans-European transport networks (TEN-T), because of the need to adapt the proce-dure to the new financial regulations and to the recommendations of the Court of Auditors;
in addition, movements across the heading amounted to EUR 233 million that mainly concerned EUR 173 million to cover additional expected payment demands for
research and technological development (0904), as payment demands had accelerat-ed in 2004, catching up on the delay in payments in 2003 due to the late adoption of the calls for tender that year.
Payments made amounted to EUR 7.3 billion from available appropriations of EUR 9 billion, an implementation rate of 81 %. This compares with EUR 5.7 billion, an implemen-tation rate of 79 % in 2003. The under-imple-mentation is mainly accounted for by EUR 980 million for earmarked revenue that most-ly relates to payments for the completion of earlier programmes under research and tech-nological development. The remaining unused appropriations of around EUR 730 million are budget appropriations spread across the heading.
Of the total unused appropriations for the heading in 2004, EUR 36.4 million for pay-ments is carried forward to 2005.
5. External actions (heading 4)
(million EUR) Initial
budget EU-25
Initial
reserve transfers (less Total reserves) AB Carried forward, etc. from 2003 Earmarked revenue
Total (incl. carried forward and earmarked
revenue) Commitments
Appropriations 5 000 177 0 = (+ 144 – 144) 52 140 5 369
Implementation 5 119 (99 %) 52 28 5 199 97 %
Payments
Appropriations 4 833 118 – 64 = (+ 527 – 591) 22 189 5 098
Commitments
Of the initial EUR 177 million placed in reserve, EUR 176 million was transferred to the heading.
Almost full implementation of commitment appropriations was reached for this heading. For total available appropriations of EUR 5.4 billion, EUR 5.2 billion commitments were made. This compares with EUR 4.9 billion in 2003, with a similar implementation rate. Ear-marked revenue of around EUR 112 million accounted for most of the underutilisation and is spread across the heading. Of the budget appropriations that could not be used before end-year 2004, EUR 8.9 million is carried for-ward to 2005.
Payments
Of the initial EUR 118 million placed in re-serve, EUR 117 million was transferred to the heading. The main transfer movements for this heading were included in the annual glob-al transfer, and concerned a net transfer of EUR 60 million from the heading to meet ad-ditional needs identified for pre-accession aid under heading 7. Furthermore, movements across the heading totalled EUR 262 million,
mainly reinforcing MEDA (190802) by EUR 160 million, as payment demands had acceler-ated on previous estimates due to the combi-nation of improvements in implementing the programmes. Appropriations became avail-able for transfer mainly because of delays in the implementation of structural reforms, in signing finance agreements, and in finalising proposals for certain projects.
EUR 4.6 billion payments were made in 2004 from total available appropriations of EUR 5.1 billion, an implementation rate of 90 %, an all-time record and a continuing improve-ment on the previous record levels of 87 % in 2003 and 89 % in 2002. Of the unused appro-priations, almost EUR 120 million concerned earmarked revenue that is spread across the heading.
Of the remaining appropriations in 2004, EUR 6 million is carried forward to 2005.
Through a combination of a sustained high level of payments and a continued effort in screening old and dormant commitments, RAL (reste à liquider) has again been stable for this heading as has been the case for the last several consecutive years, despite the continuous increase in commitment appropri-ations.
6. Administration (heading 5)
(million EUR) Initial
budget EU-25
Transfers
(*) AB forward, etc.Carried from 2003
Earmarked
revenue Total
Commitments
Appropriations 6 012 26 77 1 238 6 354
Implementation 6 126 96 %
Payments
Appropriations 6 012 8 77 571 240 6 909
Implementation 5 855 85 %
Of the initial EUR 40 million commitment appropriations placed in reserve for pre-accession instruments under Phare, EUR 25 million was released to the heading.
Almost full utilisation of commitment appro-priations was achieved for the heading. From total available appropriations of EUR 1.8 billion, EUR 1.7 billion was committed, or 94 % implementation compared with 98 % for 2003. The EUR 120 million unused appropri-ations mainly concern earmarked revenue (EUR 90 million, essentially from programme closure).
Payments amounting to EUR 3 billion were made, an implementation rate of 95 %,
com-pared with EUR 2.3 billion or 80 % last year. Of the EUR 167 million unused appropria-tions, EUR 47 million concern earmarked rev-enue and the remainder EUR 120 million mainly relates to Phare programmes. Based on initial forecasts of the implementing authorities of the beneficiary countries, an additional EUR 113 million was transferred to this chapter during the global transfer procedure.
RAL for this heading has started a downward trend, from EUR 10.3 billion at the start of 2004 to EUR 8.2 billion for the year-end, a decrease of EUR 2 billion.
7. Pre-accession aid (heading 7)
(million EUR) Initial
budget reserveInitial Budget authoritytransfers (less reserves) AB
Carried forward, etc.
from 2003
Earmarked revenue
Total (incl. carried forward and earmarked
revenue) Commitments
Appropriations 1 692 40 0 = (+ 25–25) 1 4 100 1 837
Implementation 1 702 (98 %) 4 11 1 717 94 %
Payments
Appropriations 2 856 248 = (+ 479–231) 1 115 3 220
1. History: healing the rift
The 2004 enlargement of the European Union healed the rift opened up by the East–West confrontation and the Cold War. The newcom-ers from central and eastern Europe, together with Malta and Cyprus, are members whose peoples share the same goals of democracy, liberty and prosperity as other EU citizens. They have met the strict criteria for joining the Union, and they will enrich the EU with their wealth of different cultures, traditions, heritage and languages.
Deepening European integration and widen-ing EU membership have gone hand-in-hand since the foundation of the Union. Each suc-cessive enlargement — this is the fifth since
1973 — has brought benefits to Europe’s citi-zens and new opportunities for its businesses. In between times, the EU has created a cus-toms union, a single market and a single cur-rency. The inclusion of 25 countries in the EU’s zone of peace, prosperity and stability will enhance the security of all its citizens. Enlargement will stimulate economic growth in EU countries both new and old — for the benefit of all.
2. Challenges and
opportunities
2.1. Coping with major change
Member States both old and new will benefit significantly from the EU’s expansion from 15 to 25. Nevertheless, major change is al-ways a cause for concern and the enlargement of the European Union is no exception. The experience of previous EU enlargements has shown that old and new integrate smoothly and that (if they arise) short-term strains are soon offset by long-term gains.
The new Member States have a number of things in common. They are all poorer than the average of the other 15 EU countries. Save for Malta and Cyprus, they have recently emerged from 40 years of Communist dicta-torship. They have limited resources, yet major needs for infrastructure projects and social programmes. While they will, there-fore, wish to obtain as much of the EU’s Structural Funds as possible, their absorption capacity may be limited. They have no former colonies, but strong interests in their eastern neighbours, and can be expected to be very keen to strengthen the Union’s policies towards its new neighbours.