ISSN 1021-349X
Panorama
of EU industry
Short-term supplement
Latest information on EU industry
bi-monthly
4/1996
* * *
• •
* DG III *
* *
* * *
eurostat
OFICINA ESTADÍSTICA DE LAS COMUNIDADES EUROPEAS DE EUROPÆISKE FÆLLESSKABERS STATISTISKE KONTOR STATISTISCHES AMT DER EUROPÄISCHEN GEMEINSCHAFTEN ΣΤΑΤΙΣΤΙΚΗ ΥΠΗΡΕΣΙΑ ΤΩΝ ΕΥΡΩΠΑΪΚΩΝ ΚΟΙΝΟΤΗΤΩΝ STATISTICAL OFFICE OF THE EUROPEAN COMMUNITIES OFFICE STATISTIQUE DES COMMUNAUTÉS EUROPÉENNES ISTITUTO STATISTICO DELLE COMUNITÀ EUROPEE
BUREAU VOOR DE STATISTIEK DER EUROPESE GEMEENSCHAPPEN SERVIÇO DE ESTATÍSTICA DAS COMUNIDADES EUROPEIAS
L2920 Luxembourg Tél. 43 011 Télex COMEUR LU 3423 B1049 Bruxelles, rue de la Loi 200 Tél. 299 11 11
Las publicaciones de Eurostat están clasificadas portemas y por series. La clasificación se encuentra al final de la obra. Para mayor información sobre las publicaciones, rogamos se pongan en contacto con Eurostat. Para los pedidos, diríjanse a las oficinas de venta cuyas direcciones figuran en la página interior de la contracubierta.
Eurostats publikationer er klassificeret efter emne og serie. En oversigt herover findes bag i hæftet. Yderligere oplysninger om publikationerne kan fås ved henvendelse til Eurostat.
Bestilling kan afgives til de salgssteder, der er anført på omslagets side 3.
Die Veröffentlichungen von Eurostat sind nach Themenkreisen und Reihen gegliedert. Die Gliederung ¡st hinten in jedem Band aufgeführt. Genauere Auskünfte über die Veröffentlichungen erteilt Eurostat.
Ihre Bestellungen richten Sie bitte an die Verkaufsbüros, deren Anschriften jeweils auf der dritten Umschlagseite der Veröffentlichungen zu finden sind.
Οι εκδόσεις της Eurostat ταξινομούνται κατά θέμα και κατά σειρά. Η ακριβής ταξινόμηση αναφέρεται στο τέλος κάθε έκδοσης. Για λεπτομερέστερες πληροφορίες σχετικά με τις εκδόσεις, μπορείτε να απευθύ-νεσθε στην Eurostat.
Για τις παραγγελίες μπορείτε να απευθύνεσθε στα γραφεία πώλησης, των οποίων οι διευθύνσεις αναγράφονται στη σελίδα 3 του εξωφύλλου.
Eurostat's publications are classified according to themes and series. This classification is indicated at the end of the publication. For more detailed information on publications, contact Eurostat.
Orders are obtainable from the sales offices mentioned on the inside back cover.
Les publications d'Eurostat sont classées par thème et par série. Cette classification est précisée à la fin de l'ouvrage. Pour des informations plus détaillées sur les publications, contactez Eurostat.
Pour les commandes, adressez-vous aux bureaux de vente dont les adresses sont indiquées à la page 3 de la couverture.
Le pubblicazioni dell'Eurostat sono classificate per tema e per serie. Tale classificazione è precisata alla fine dell'opera. Per informazioni più dettagliate sulle pubblicazioni rivolgersi all'Eurostat.
Per eventuali ordinazioni rivolgersi a uno degli uffici di vendita i cui indirizzi figurano nella 3a pagina della copertina.
De publikaties van Eurostat zijn ingedeeld naar onderwerp en serie. Deze indeling is achter in het boek opgenomen. Voor nadere informatie over de publikaties kunt u sich wenden tot Eurostat.
Gelieve bestellingen op te geven bij de verkoopbureaus, waarvan de adressen op bladzijde 3 van de omslag zijn vermeld.
As publicações do Eurostat estão classificadas por tema e por série. Esta classificação está indicada no firn da obra. Para mais informações sobre as publicações é favor contactar Eurostat.
Panorama
of EU industry
Short-term supplement
Latest information on EU industry
bi-monthly
4/1996
Theme Energy and industry
Sent to press in June 1996
A great deal of additional information on the European Union is available on the Internet. It can be accessed through the Europa server
(http://europa.eu.int).
Luxembourg: Office for Official Publications of the European Communities, 1996
© ECSC-EC-EAEC, Brussels · Luxembourg, 1996
Reproduction is authorized, except for commercial purposes, provided that the source is acknowledged
E D Τ O R A L
In the spring of 1996, Directorate General II for economic and financial affairs of the European Commission adjusted its forecasts for growth in the volume of gross domestic product for 1996 and 1997 to 1.5% and 2.4% respectively. Their fore casts of employment growth remained positive, although they were reduced to 0.2% in 1996 and 0.6% in 1997.
In this issue of the Supplement we cover three special topics:
* the paper, printing and publishing industry; ■A the nonmetallic minerals industry;
* and an article on competitiveness.
The paper, printing and publishing industry now has 43.3% of its consumption derived from recycled forms of paper. The industry faces changing patterns of demand, as there is a general movement away from printed media to electronic formats. Paper, printing and publishing accounted for 6.9% of EU manufacturing
production in
,995.
i
The nonmetallic minerals sector is characterised by its strong cyclical nature. This is largely a result of demand from the construction sector, where in recent years there has been a downturn in activity. Recent trends have shown that there has been a deceleration of the growth experienced in the first nine months of 1995. Nevertheless, with expectations of an upturn in the European economy (including construction activity) it is likely that the sector will show renewed vigour moving towards the turn of the century. f*j ^ v V _ ^
The final article on competitiveness in European industry follows on from the arti cle that appeared in Issue 2, when we gave details of the classification plan and methodology of Eurostat's competitiveness database. This article goes on from there to look in more detail at the cost and price indicators in the database. Among the variables most often used to explain economic efficiency are labour productivity and measures of unit costs and prices. These form an important group of sector specific indicators in the database, which may aid the analyst in examin ing the factors behind the success or failure of an industry. Due to the mathemati cal formulas used in their calculation, these indicators have been termed "single weighted" and "double weighted". The article demonstrates the mathematical derivation of the indicators, as well as the concepts upon which they are based.
P H O T I S N A N O P O U L O S , DIRECTOR
BUSINESS AND ENERGY STATISTICS, R&D, AND STATISTICAL METHODS
ISSUE 4 1 9 9 6
Paper, printing and publishing Nonmetallic mineral products
Competitiveness
I N T H I S I S S U E :
M A C R O E C O N O M Y
T O T A L I N D U S T R Y
P A P E R , P R I N T I N G A N D
P U B L I S H I N G
N O N M E T A L L I C M I N E R A L
P R O D U C T S
C O N T E N T S
I S S U E N U M B E R 4 : 1 9 9 6
Ρ Α Ν Ο R
1 . M A C R O E C O N O M Y 7
Industrial production, consumer prices, trade balance
2 . T O T A L I N D U S T R Y 11
Production index, producer prices,
capacity utilisation, trade indicators
3 . PAPER, P R I N T I N G A N D P U B L I S H I N G 3 3
3.1 S T R U C T U R A L I N D I C A T O R S 3 7
Valueadded, production, employment, labour costs
EXTERNAL TRADE 39
ExtraEU exports and extraEU imports
3.2 S H O R T TERM I N D I C A T O R S 4 0
Production index, producer prices,
capacity utilisation, trade indicators
4 . N O N M E T A L L I C MINERAL PRODUCTS 51
4.1 S T R U C T U R A L I N D I C A T O R S 5 5
Valueadded, production, employment, labour costs
EXTERNAL TRADE 5 7
ExtraEU exports and extraEU imports
4.2 SHORT TERM INDICATORS 60
Production index, producer prices,
capacity utilisation, trade indicators
M E T H O D O L O G I C A L NOTES 7 0
5. COMPETITIVENESS 7 3
I S S U E 4 1 9 9 6
Pape, printing and publishing Nonmetallic mineral products Competitiveness
The supplement appears six times during the course of the year.
bushing
products M
The Panorama of EU Industry provides users of enterprise statistics each year with a complete and detailed publication on the state of and main trends in industry and services.
The Panorama Shortterm Supplement has a simple objective: to furnish readers of the annual Panorama with an instrument which will allow them to follow the evolution of industrial shortterm trends and also show the structure and activity of industry at the sectorial level. In addition the Supplement aims to provide topical articles of general interest to the reader.
¿3S
TJ
WÊÊÊÊÊM
The data processing, statistical analysi writing of the chapters and desktop publishing were carried out by the following team at Eurostat:
Timothy Allen Laurence Bastin lain Christopher Raymond Chaudron Catherine Dailleau Paul Hanson Mehdi Hussain Rita Keenan Andrew Redpath Paris Sansoglou
For more information, please contai Mr. Berthold Feldmann,
Statistical Office of the Europe: Communities,
Bâtiment Jean Monnet, C5/27,
L2920 Luxembourg Tel: (352) 4301 34401 Fax: (352) 4301 34359
M A C R O - E C O N O M Y
C O M M E N T A R Y
Directorate General II for Economic and Financial Affairs of the European Commission adjusted its forecasts for
growth in the volume of gross domestic product for 1996 and 1997 downwards after slower than expected growth in the final months of 1995. An adjustment in
the level of stocks and the turbulence of exchange rates in spring 1995 were given as the main reasons. The expected drop
in economic growth between 1995 and 1996 therefore came to 1.0 percentage
point. Although the predicted changes in employment remained positive, they were adjusted downwards too. After a predicted rise of 0.6% in 1995, following , reduction in employment in both 1993 and 1994, the Commission forecast employment to rise by 0.2% in 1996 and by 0.6% in 1997. In the autumn
fore-casts, the figures had been 0.9% and 1.1%.
1 996 DGII
For the individual Member States, the decline in economic growth varied. According to the Commission forecasts, economic growth will not accelerate in
1996 in any of the 15 Member States. However, growth in the United Kingdom was expected to remain stable at 2.4%. Capacity utilisation was seen to remain well under its maximum due to strong growth in fixed capital formation of 4.2% in
1996 and 4.9% in 1997. After attaining a high of 85.2% in the second quarter of
1995, capacity utilisation in industry had already dropped to 82.9% in the first quarter of 1996. Consumer price inflation has continued to fall for the past seven months, from 3.5% in September 1995 to 3.0% in April 1996. The forecasts fore-saw annual rates of between 2.5% and 2.7% for 1996 and 1997.
In all three other large Member States, economic growth was expected to drop. In Germany, economic growth slowed from 2.8% in the first quarter of 1995 to -2.0% in the final quarter of 1995 (quarter-to-quarter at annualised rates). The annual rate
for 1995 therefore came to 1.9%, which was expected to drop by 1.4 percentage points to 0.5% in 1996. This it argued on the basis of the effects that tax decreases scheduled for 1996 will have and the continued drop in short and long term inter-est rates. In making its forecasts, the commission subsequently assumed a return of the DM/ECU exchange rate to approximately 1.90 in 1996, a depreciation of 1.3%
compared to its 1995 average of 1.87 D M . The positive effect on exports of this depreciation and a restoration to growth of fixed capital formation led the
Commission to expect German economic growth would rebound in 1997 to 1.8%.
Economic growth in France declined throughout 1995 in much the same way as in Germany. In the final quarter of 1994, gross domestic product grew by an
annu-alised rate of 4.0% on the quarter before. This rate dropped to -1.2% in the fourth quarter of 1995. Part of the full decline was caused by the public sector strikes in November and December. Exports also declined, partly due to the reduction in
f o r e c a s t s a d j u s t e d
d o w n w a r d s a f t e i
d i m i n i s h e d g r o w t h a t t h e
e n d o f 1 9 9 5
I N T H I S S E C T I O N :
C O M M E N T A R Y
I N D U S T R I A L P R O D U C T I O N
C O N S U M E R P R I C E S
N O
P R O D U C T I O N
M A C R O - E C O N O M Y C O N S U M E R P R I C E S A N D T R A D E B A L A N C E
I EU I Japan I USA
F I G U R E 1.1
Year on year
growth rates (t / t-4) for industrial
production (%)
S O U R C E : « «
F I G U R E 1.2
Year on year
growth rates (t /1-4) for consumer prices
(%)
l=P/1
S O U R C E : <^m¿,\
3.5
3.0
2.5
2.0
1.5
I.O
0.5
0.0
-0.5
-1.0
III-1995 IV-1995
activity in the European Union as a whole. Consumer spending improved somewhat at the start of 1996. Although consumption of manufac-tured goods increased by 6.1 % in January 1996
on the same month of 1995, consumer confi-dence remained depressed. Business conficonfi-dence grew during the first months of 1996 and concur-rently, the European Commission forecast a return to growth in France through increased investment
in equipment, further strengthened by a decrease in interest rates. Its forecasts for GDP for 1996 and 1997 came to 1.0% and 2.1 % respectively.
The Italian economy displayed rather erratic quar-terly growth rates during 1995. Over the whole
year, GDP increased by 3.0%. Exports and invest-ment played a major role in the first half of 1995, whereas during the second half, both lost their role as the main engines of growth. It was
doubt-ful whether exports would play an equally impor-tant role in 1996 as Italy's main trading partners, France and Germany, were both forecast to expe-rience a stagnation in economic activity. Private
and public consumption was somewhat depressed during 1995, primarily because of cuts in govern-ment spending. Domestic demand was expected to retain a moderate growth rate of around 1.8% in 1996, despite a further decrease in government
consumption.
F I G U R E 1.3
Quarterly trade balance (billion ECU)
S O U R C E : sïSîfet
EB
IM-1995 IV-1995
M A C R O E C O N O M Y
P R O D U C T I O N , C O N S U M E R P R I C E S A N D T R A D E B A L A N C E
The Commission forecasts foresaw a relatively
mild downturn in the growth of GDP (compared
to the other countries) for Greece and Portugal.
Economic growth was expected to decline by only
0.2 percentage points for the latter and even to
remain stable for the former in 1996. While fore
seen to experience a significant drop in the
growth rate of GDP, the rate was expected to
remain relatively high in 1996 in Finland and
Ireland. Ireland especially has been going through
a period of extremely fast economic growth in
recent years. According to the Commission fore
casts, the Irish economy w i l l lose some of its
momentum in 1996 and 1997, but with expected
growth in GDP of 5.6% and 4.9%, it w o u l d still
be the country with the highest growth rate in the
European Union. Finland was expected to come
second with economic growth of 3.0% and 3.6%
for the same years.
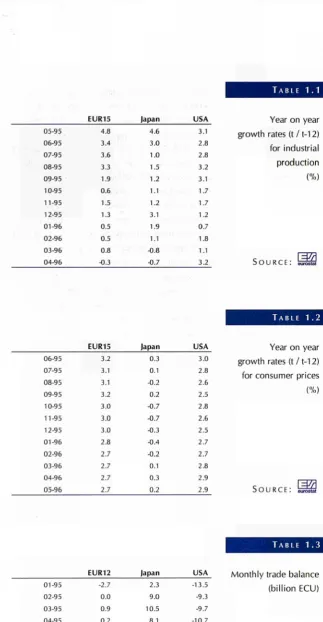
EUR15 EUR15 japan lapan USA 0595 0695 0795 0895 0995 1095 1195 1295 0196 0296 0396 0496 4.8 3.4 3.6 3.3 1.9 0.6 1.5 1.3 0.5 0.5 0.8 0.3 4.6 3.0 1.0 1.5 1.2 1.1 1.2 3.1 1.9 1.1 0.8 0.7 3.1 2.8 2.8 3.2 3.1 1.7 1.7 1.2 0.7 1.8 1.1 3.2 USA 06-95 07-95 08-95 09-95 10-95 11-95 12-95 01-96 02-96 03-96 04-96 05-96 3.2 3.1 3.1 3.2 3.0 3.0 3.0 2.8 2.7 2.7 2.7 2.7 0.3 0.1 -0.2 0.2 -0.7 -0.7 -0.3 -0.4 -0.2 0.1 0.3 0.2 3.0 2.8 2.6 2.5 2.8 2.6 2.5 2.7 2.7 2.8 2.9 2.9
T A B L E 1 . 1
Year on year
growth rates (t /112)
for industrial
production
(%)
S O U R C E : S i w
T A B L E 1 . 2
Year on year
growth rates (t /112)
for consumer prices
(%)
Γ37>1
S O U R C E : S è i
TABLE 1.3
EUR12 japan USA
0195 0295 0395 0495 0595 0695 0795 0895 0995 1095 1195 1295 2.7 0.0 0.9 0.2 0.5 1.0 1.8 0.1 1.1 N/A N/A N/A 2.3 9.0 10.5 8.1 5.3 8.8 7.0 4.6 8.8 4.1 5.0 8.4 13.5 9.3 9.7 10.7 11.9 12.8 14.8 13.9 12.4 14.0 11.7 12.4
Monthly trade balance
(billion ECU)
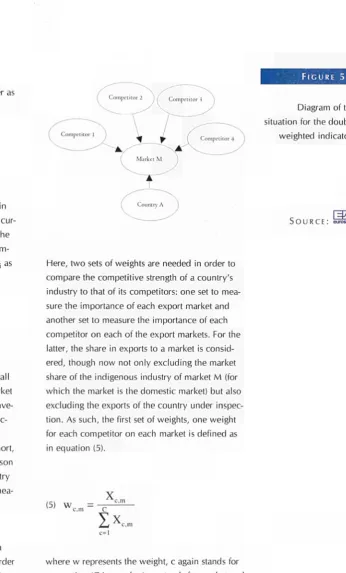
[image:11.595.255.579.58.681.2]M A C R O E C O N O M Y
C O M M E N T A R Y
The USA seemed to continue its five year old
peri-od of economic expansion. Although growth in 1995 at 2.0% was not as high as in 1994, the Commission did not expect this trend to continue into 1996. On the contrary, economic growth was
expected to accelerate slightly to 2.1 % in 1996 and 2.5% in 1997. As for many European coun-tries, this forecast depended a great deal on the future development of interest rates. Long-term
interest rates had started to increase again, in response to rising inflation, reaching 6.5% in April 1996, after falling from 7.9% at the start of 1995 to a low of 6.0% in January 1996. Inflation increased at the same time to 2.9% in April 1996
after having attained a minimum rate of 2.5% in December 1995. A rise in non-agricultural employment of 348 thousand in May (much high-er than expected), raised fears of a furthhigh-er increase
in the inflation rate, making a rise in interest rates by the Federal Reserve Bank more likely. Other measures of activity also displayed an acceleration in economic growth. The year-on-year growth rate
of industrial production, which declined monoton-ically during the six months up to January 1996, increased by 2.5 percentage points in the first months of 1996 to 2.6% in April.
Japanese GDP data for the first quarter of 1996
revealed an unexpectedly high growth rate of 3.0% compared to the last quarter of 1995. The Japanese recovery, which did not yet show con-vincing signs of gaining speed up until the end of
1995, has now brought the average rate of growth for the 1995/96 financial year to normal levels again. Whether the Japanese economy would be able to continue in this fashion was uncertain
though for two reasons. Firstly, the Japanese gov-ernment, which spent 9.5 trillion yen (77.3 billion ECU) on a number of expansive stimulation mea-sures during the current financial year, would have to tighten its fiscal policy in order to bring
down the now rapidly increasing public debt. The ratio of gross public debt to GDP was estimated to have risen from 63% in 1991 to as much as 95% in 1996. Secondly, as Japan moved steadily away
from a period of deflation, the Bank of Japan would have to raise its discount rate, since September at an all-time low of 0.5%. This could then prolong problems for the large number of
mortgage banks (jusen) and their parent credit banks, which were still coping with bad debts left over from the collapse of the real-estate market. The finance ministry's plan to restructure the
mort-gage banking sector, presented in December of 1995, would cost another 685 billion yen of gov-ernment money.
T O T A L I N D U S T R Y
C O M M E N T A R Y
The trend - the index corrected for sea-sonal and one-off fluctuations - in the EUR15 production volume remained vir-tually flat in the first quarter of 1996.
During the last quarter of 1995 produc-tion volume had grown by an average
annualised rate of 1.4%. During January to March 1996 this average dropped to 0.7%. This change was caused mainly by a drop in the growth rate of production in the capital goods sector. In this sector, the average month-on-month growth rate fell from 10.0% in the fourth quarter of 1995 to 1.2% in the first quarter of 1996. In the intermediate and consumer goods sectors, the growth rates increased over the final quarter of 1995.
The year-on-year growth rates displayed the same development. Compared with the same month of the previous year, industrial production increased by 0.9% in March of 1996, down from 1.2% in December of 1995. The decline in growth rates of production in the capital goods sector was less marked when measured in annual terms. The data did however show a clear peak in growth rates, at 7.8% in December of 1995. By March 1996, the rate had dropped to 4.6%. Annual growth rates remained negative in the intermediate goods sector during the first three months of 1996, as they had been since October 1995. During the period from December 1995 to February 1996, the durable and non-durable consumer goods sectors both experienced a drop in production when compared to levels of the pre-vious year. Their growth rates turned positive again in March of 1996, at 0.3% and 0.9% respectively.
The rate of increase seen in producer prices slowed in March 1996. Between October 1995 and February 1996, producer prices rose by 0.5% (an average of 0.1% a month or 1.3% annually). In March 1996, producer prices fell 0.2%, caus-ing the annual rate to slow to 1.4% from 1.8% in February 1996. This trend was mirrored in all sectors except consumer durables. Here, producer price inflation increased from 2.5% in December 1995 to 2.8% in March 1996. In the intermedi-ate goods sector, the annual increase in producer prices slowed considerably from 3.0% in December 1995 to 0.2% in March 1996.
E U R I 5 i n d u s t r i a l
p r o d u c t i o n s t a g n a t e d
d u r i n g f i r s t
q u a r t e r of 1 9 9 ó
I N T H I S S E C T I O N :
P R O D U C T I O N I N D E X
P R O D U C E R PRICES
C A P A C I T Y U T I L I S A T I O N
T R A D E I N D I C A T O R S
ΓΓ
A II Ο R A M"
T O T A L I N D U S T R Y P R O D U C T I O N I N D E XF I G U R E 2 . 1
EUR15 production
index by goods sector,
trendcycle
(1990 = 100)
Total industry
Intermediate goods
Capital goods
Consumer durables
Consumer nondurables
S O U R C E
L^
HO.II
0594 0794 0994 1194 0195 0395 0595 0795 0995 1195 0196 0396
T A B L E 2 . 1
Three month on three
month growth rates for
the production index,
based on a seasonally
adjusted series
(%)
Latest quarter available Total industry Intermediate goods Capital goods Consumer durables Consumer nondurables
S O U R C E : ssssfei
P A G E
EUR15 Β DK D GR E F IRL I L NL A Ρ FIN S UK 0296
! 205
0296 0296 0196 0296 0296 1295 0296 0196 0296 1093 0296 0296 0296
:
Φ o c? o 3 O O O c¿ O c> O ■=> o o 0496 0296 0496 0496 0396 0496 0496 0296 0496 0396 0496 1295 0496 0496 0496 ■0.3 0.0 1.4 0.6 0.7 0.8 0.6 0.9 2.3 0.6 1.3 N/A 1.8 0.4 0.5 0.3 43.3 ^1.7 2.2 1.3 0.9 43.4 1.7 5.0 1.3 1.7 1.8 N/A 0.1 0.6 0.2 0.2 0.3 0.4 2.0 1.0 0.2 1.4 0.0 3.5 3.1 12.9 1.6 N/A 2.7 0.7 1.2 0.3 0.0 1.3 0.6 1.1 0.5 0.2 1.2 N/A 43.8 23.0 1.1 N/A 3.4 16.2 4.8 1.6 43.4 0.1 3.8 1.5 0.6 2.2 0.2 0.9 3.0 0.6 0.9 N/A4 . 1
1.4
0.8
1.0
[Mi
T O T A L I N D U S T R Y P R O D U C T I O N I N D E X
P A N O R A M A
18.0
2.0
F I G U R E 2 . 2
Year on year growth rates for the production index, based on changes from the corresponding quarter of the previous year
(%)
DK D GR E F IRL I L NL A Ρ FIN S UK S O U R C E : 5u755feí
Latest quarter available Total industry Intermediate goods Capital goods Consumer durables Consumer
nondurables T A B L E 2 . 2
EUR15 Β D K D G R E f IRL I L N L A Ρ
F I N
S U K 0296 1295 0296 0296 0196 0296 0296 1295 0296 0196 0296 1095 0296 0296 0296 O ci· Φ O Φ < i c i O c? ci. Φ ci. ci. ci) c i c i 0496 0296 0496 0496 0396 0496 0496 0296 0496 0396 0496 1295 0496 0496 0196 0.3 2.0 0.6 0.2 0.7 2.5 0.5 16.5 1.3 1.8 5.9 N/A 6.6 43.3 0.1 1.7 1.5 6.6 2.9 5.6 0.4 2.6 0.4 13.9 2.2 5.9 6.5 N/A 2.5 0.1 3.5 1.7 4.6 2.4 2.7 5.6 2.9 2.5 0.3 34.7 7.4 6.4 7.4 N/A 7.1 12.4 4.9 3.0 43.4 4.3 5.4 2.0 13.8 0.5 3.0 N/A 4.1 10.2 4.0 N/A 0.1 49.0 5.7
>.>
0.6 7.7 3.6 2.3 3.7 6.1 0.8 0.8 4.5 43.7 4.0 N/A 43.7 0.4 1.1 0.8Year on year growth rates for the production index, based on changes from the corresponding quarter of the previous year
(%)
T O T A L I N D U S T R Y
P R O D U C T I O N I N D E X
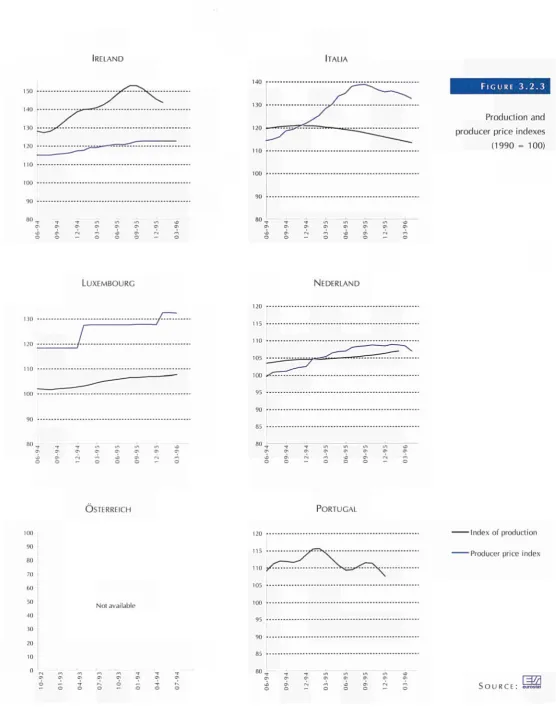
FIGURE 2.3
Production index by goods sector, trend-cycle (1990 = 100)
DANMARK
DEUTSCHLAND ELLADA
ESPAÑA FRANCE
Total industry
Intermediate goods
Capital goods
Consumer durables
Consumer non-durables
S O U R C E :
L^
120
115
110
105
100
95
90
85
80
T O T A L I N D U S T R Y P R O D U C T I O N I N D E X
P A N O R A M A
IRELAND ITALIA
FIGURE 2.3
Production index by goods sector, trend-cycle (1990 = 100)
LUXEMBOURG NEDERLAND
ÖSTERREICH PORTUGAL
100 90 80 70 60 50 40 .10 20 10 o
Not available
Total industry
Intermediate goods
Capital goods
Consumer durables
Consumer non-durables
T O T A L I N D U S T R Y P R O D U C T I O N I N D E X
SUOMI/FINLAND SVERIGE
F I G U R E 2 . 3
Production index by goods sector, trend-cycle (1990 = 100)
UNITED KINGDOM
— Total industry
Intermediate goods
— Capital goods
— Consumer durables
- Consumer non-durables
SOURCE: s i ä
T O T A L I N D U S T R Y
P R O D U C T I O N I N D E X
P A N O R A M A
F I G U R E 2 . 4
Japanese year on year
growth rates for
industrial production,
based on changes from
the corresponding
quarter of the
previous year
(%)
Blntermediate goods
■Capital goods
■Consumer durables
^Consumer non durables
M1995 S O U R C E : eurostat
F I G U R E 2.5
American year on year
growth rates for
industrial production,
based on changes from
the corresponding
quarter of the
previous year
(%)
Blntermediate goods
■Capital goods
(¡Consumer durables
^'Consumer non durables
11995 S O U R C E :
aa
T O T A L I N D U S T R Y
P R O D U C E R P R I C E S
F I G U R E 2 . 6
EUR15 producer price index by goods sector, in national currencies (1990 = 100)
Total industry
Intermediate goods
Capital goods
Consumer durables
Consumer nondurables
ra/71
S O U R C E : S i i *
no.o
T A B L E 2 . 3
Three month on three month growth rates for the producer price index, in national currencies
(%)
Latest q u a r t e r a v a i l a b l e
Total industry
I n t e r m e d i a t e goods
C a p i t a l goods
C o n s u m e r d u r a b l e s
Consumer nondurables
[WÄ
S O U R C E : SrSfei
EUR15 Β DK D GR E F IRL I L NL A Ρ FIN S UK 0296 0296 0296 0396 0296 0296 0396 1294 0296 0296 0296 0396 0396 0396 c i ■ : c i c i c i c i c i c i c i O O c i c i c i c i ■: 0496 0496 0496 0596 0496 0496 0596 0295 0496 0496 0496 0596 0596 0596 o.i 0.4 0.3 0.2 2.2 0.8 0.4 1.0 0.4 0.0 0.9 N/A N/A 0.5 0.1 1.4 0.6 0.7 0.4 0.6 1.9 0.1 0.5 0.5 0.2 3.4 1.0 N/A N/A 1.0 0.1 3.7 0.8 0.1 0.2 0.4 2.9 1.2 0.3 N/A 1.2 0.2 0.2 N/A N/A 0.4 0.3 0.6 1.0 N/A 0.7 0.5 2.5 1.5 0.2 N/A 2.0 0.6 0.6 N/A N/A 0.8 1.7 1.1 0.7 0.0 0.2 43.2 2.5 1.5 0.2 0.3 0.9 0.4 0.8 N/A N/A 0.0 0.5 0.8
P A G E
Mi
T O T A L I N D U S T R Y
P R O D U C E R P R I C E S
P A N O R A M A
8.0
ttf
I I I
i i
1.I.I 1. .ι
■ 1 1
F I G U R E 2 . 7
Year on year growth rates for the producer price index, based on changes from the corresponding quarter of the previous year, in national currencies (%)
EUR15 Β DK D GR E IRL I NL Α Ρ FIN S UK SOU RCE: S î u t V37Ä
Latest q u a r t e r a v a i l a b l e
Total industry
I n t e r m e d i a t e goods
C a p i t a l goods
C o n s u m e r durables
C o n s u m e r
nondurables T A B L E 2 . 4
EUR15 Β D K D GR E F IRL I L NL A Ρ FIN S U K 0296 0296 0296 0396 0296 0296 0396 1294 0296 0296 0296 0396 0396 0396 c i i i c i
:
c i o:
c i c i c i c i c i c i::
,:
c i 0496 0496 0496 0596 0496 0496 0596 0295 0496 0496 0496 0596 0596 0596 1.5 1.3 2.0 0.4 8.4 2.1 0.9 2.7 3.7 0.2 0.9 N/A N/A 0.4 1.5 1.5 0.3 1.6 2.2 1.8 7.9 0.0 0.2 0.9 3.3 3.4 0.9 N/A N/A 0.1 1.9 1.1 2.4 0.6 4.0 1.6 8.7 2.5 1.1 N/A 4.4 1.3 0.7 N/A N/A 2.3 1.2 2.5 2.7 N/A 2.8 1.4 5.6 4.1 0.9 N/A 5.4 1.0 0.8 N/A N/A 0.7 4.3 2.4 2.4 1.0 1.0 0.1 9.1 4.3 0.6 2.6 4.0 0.4 1.4 N/A N/A 0.0 1.1 3.4Year on year growth rates for the producer price index, based on changes from the corresponding quarter of the previous year, in national currencies (%)
T O T A L I N D U S T R Y
P R O D U C E R P R I C E S
BELGIQUE/BELGIË DANMARK
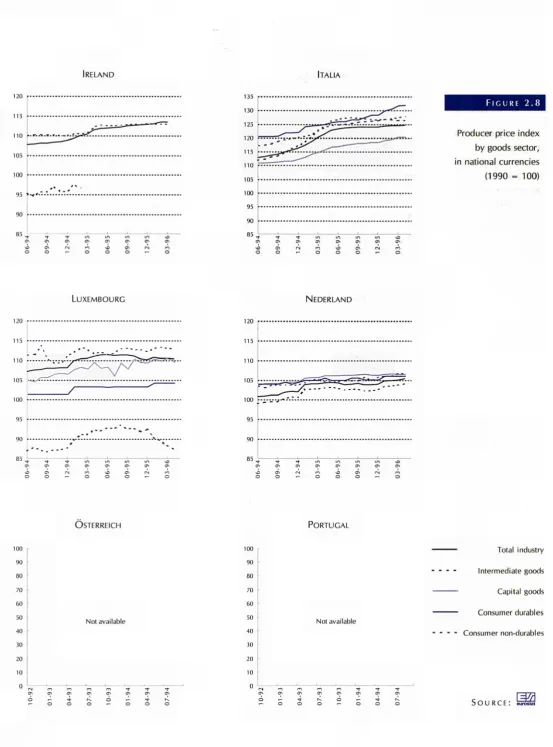
F I G U R E 2 . 8
Producer price index
by goods sector,
in national currencies
(1990 = 100)
115
110
105
100 —
95 ·"
90
8 5 ,
en en
D E U T S C H L A N D ELLADA
ESPAÑA FRANCE
Total industry
Intermediate goods
Capital goods
Consumer durables
Consumer nondurables
S O U R C E :
ΜΔ
95
8 5 .
110
105
100
85
T O T A L I N D U S T R Y
P R O D U C E R P R I C E S
P A N O R A M A
IRELAND ITALIA
1 15
I 10
105
loo
95 ■>;'■'■
9 0
135
130
125
120
115
110
105
100
95
90
85
r
_
r^ v
+¿s*
"ΓίΓ- »--'-'ο σι
■ t
tn
ΓΝ
in c^
ι 6-9
5
9-9
5
2-9
5
3-9
6
F I G U R E 2.8
Producer price index by goods sector, in national currencies
(1990 = 100)
LUXEMBOURG NEDERLAND
120
115
no
105
100
95
90
85
o .
ÖSTERREICH PORTUGAL
100
90
HO
70
60
50
40
)0
20
10
o
Not available
loo
90
80
70
60
50
40
30
20
10
Not available
Total industry
Intermediate goods
Capital goods
Consumer durables
Consumer nondurables
[image:23.595.35.589.44.792.2]T O T A L I N D U S T R Y P R O D U C E R P R I C E S
SuOMl/FlNLAND SVERIGE
F I G U R E 2 .
Producer price index by goods sector,
in national currencies (1990 = 100)
UNITED KINGDOM
Total industry
Intermediate goods
Capital goods
Consumer durables
Consumer non-durables
S O U R C E :
. t ^
T O T A L I N D U S T R Y
P R O D U C E R P R I C E S
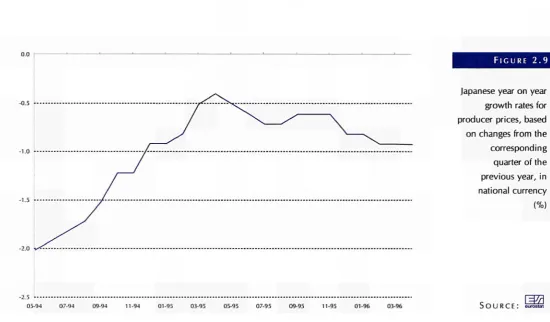
F I G U R E 2.9
Japanese year on year growth rates for producer prices, based on changes from the corresponding quarter of the previous year, in national currency
(%)
-2.5 L
05-94 07-94 11-94 01-95 03-95 05-95 07-95 09-95 11-95 01-96 03-96 S O U R C E : eurosi«
F I G U R E 2.10
American year on year growth rates for producer prices, based on changes from the corresponding quarter of the previous year, in national currency
(%)
05-94 07-94 09-94 11-94 01-95 03-95 05-95 07-95 09-95 11-95 01-96 03-96 S O U R C E : eurostat
[=fZ3
[image:25.595.29.580.86.408.2] [image:25.595.35.547.473.751.2]T O T A L I N D U S T R Y
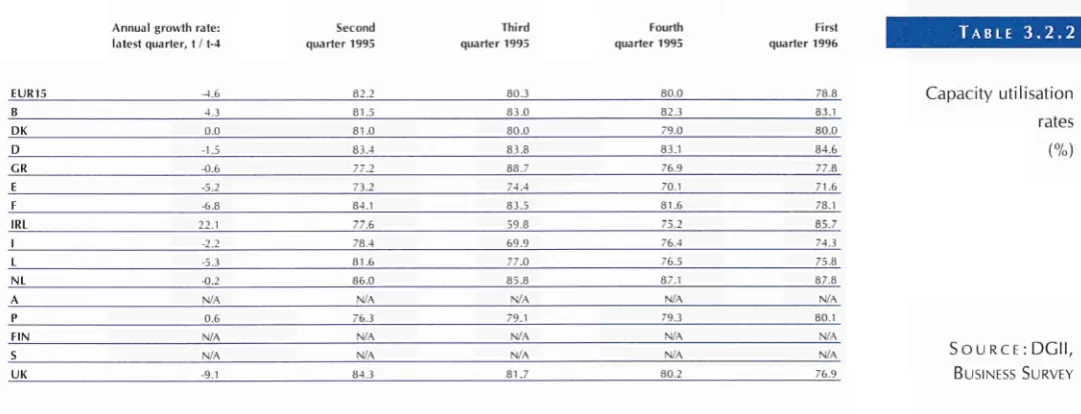
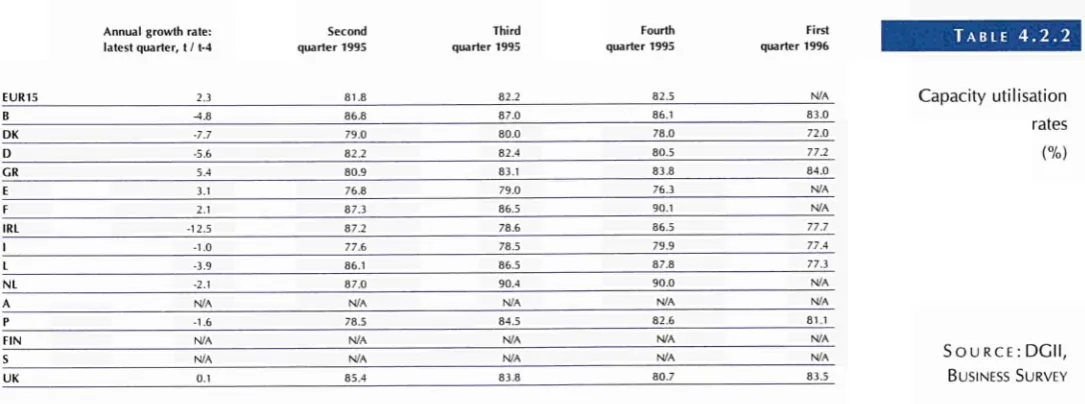
C A P A C I T Y U T I L I S A T I O N
F I G U R E 2 . 1 1
Total industry:
capacity utilisation
rates, first quarter 1996
(%)
S O U R C E : DGII,
BUSINESS SURVEY
85.0
75.0
70.0
60.0 -■
50.0
EUR15 DK GR
TABLE 2.5 Annual growth rate:
latest quarter, t/1-4
Second quarter 1995
Third quarter 1995
Fourth quarter 1995
First quarter T996
Total industry:
capacity utilisation rates
(%)
S O U R C E : DGII,
BUSINESS SURVEY
EUR15 Β DK D CR E F IRL I L NL A Ρ
FIN
S UK
41.6
-1.3 -2.4 -1.1 O.B -0.6 -1.4 6.3 1.2 -t .5 0.7 N/A -1.7 N/A N/A -1.4
83.1
81.3 82.0 85.1
75.2 78.6 85.7
80.9
78.2
83.2
84.4
N/A
78.5
N/A N/A
85.2
83.2
81.2 83.0 86.1 76.5 77.9 85.5 79.2 78.6 83.4
85.1 N/A
78.6
N/A N/A
84.1
82.6
80.2 82.0
84.7 78.3 77.8 85.8
82.2
77.6
81.6
84.2
N/A
77.0
N/A N/A 83.8
81.9
78.7
81.0 83.2
76.3 77.8 84.4
82.1
78.5 78.8
83.6 N/A
77.0
N/A N/A 82.9
T O T A L I N D U S T R Y
C A P A C I T Y U T I L I S A T I O N
75.0 !■■
F I G U R E 2 . 1 2
Intermediate goods:
capacity utilisation
rates, first quarter
1996
(%)
EUR15 Β DK D GR Ε F IRL I L NL A Ρ FIN S UK
S O U R C E : DGII,
BUSINESS SURVEY
Annual growth rate: latest quarter, t / t-4
Second quarter 1995
Third quarter 1995
Fourth quarter 1995
First
quarter 1996 T A B L E 2 . 6
EUR15 B D K D GR Ε F IRL I L N L A Ρ F I N S U K
-2.4 -6.6 -3.7 -4.3 1.3 -1.0 -1.5 1.5 -1.1 -5.0 -3.2 N/A -3.3 N/A N/A -0.7
84.7 85.3 81.0 86.6 78.2 81.6 87.8 83.8 79.6 82.0 85.4 N/A 81.7 N/A N/A 85.7
84.5 84.0 8 1 .0 87.3 78.4 79.4 88.4 74.1 79.3 82.7 85.4 N/A 80.4 N/A N/A 85.1
83.3 80.4 80.0 84.4 78.9 78.7 87.4 83.2 78.4 80.6 82.7 N/A 79.5 N/A N/A 86.0
81.8 76.1 79.0 81.7 78.2 79.3 86.1 81.5 78.3 77.1 81.3 N/A 79.5 N/A N/A 84.8
Intermediate goods:
capacity utilisation
rates
(%)
S O U R C E : DGII,
BUSINESS SURVEY
T O T A L I N D U S T R Y
[image:28.595.130.554.120.369.2]C A P A C I T Y U T I L I S A T I O N
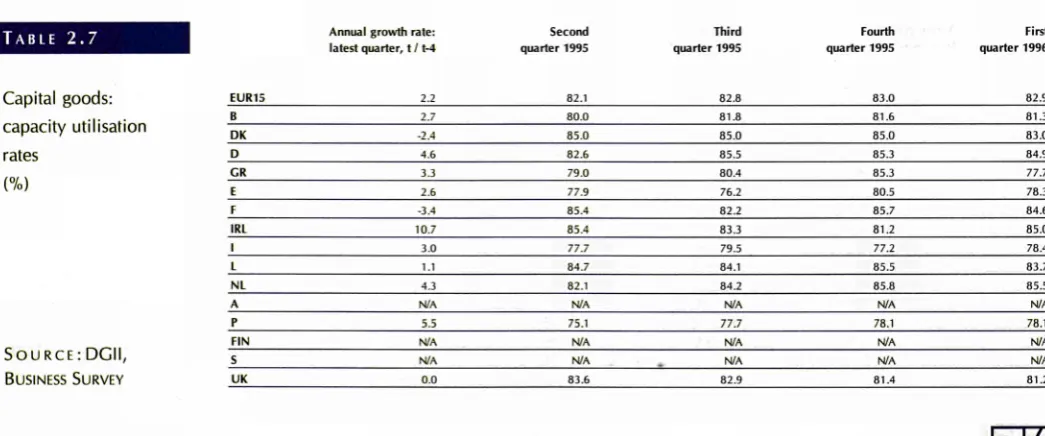
FIGURE 2.1 3
Capital goods: capacity utilisation rates, first quarter 1996
(%)
SOURCE: DGII, BUSINESS SURVEY
90.0
85.0
55.0
50.0 !— ι ι ι ^ . ^ H 1 __J__I^H 1 1 L__
[image:28.595.31.554.587.805.2]EUR15 Β DK D GR E F IRL I L NL A Ρ FIN S UK
TABLE 2.7 Annual growth rate: latest quarter, t /1-4 quarter 1995 Second quarter 1995 Third quarter 1995 Fourth quarter 1996 First
Capital goods: capacity utilisation rates
(%)
S O U R C E : D G I I , BUSINESS SURVEY
EUR15 B DK D GR E F IRL I L NL A Ρ FIN S UK
2.2 2.7 -2.4 4.6 3.3 2.6 -3.4 10.7 3.0 1.1 4.3 N/A 5.5 N/A N/A 0.0
82.1 80.0 85.0 82.6 79.0 77.9 85.4 85.4 77.7 84.7 82.1 N/A 75.1 N/A N/A 83.6
82.8 81.8 85.0 85.5 80.4 76.2 82.2 83.3 79.5 84.1 84.2 N/A 77.7 N/A N/A 82.9
83.0 81.6 85.0 85.3 85.3 80.5 85.7 81.2 77.2 85.5 85.8 N/A 78.1 N/A N/A 81.4
82.9 81.3 83.0 84.9 77.7 78.3 84.6 85.0 78.4 83.7 85.5 N/A 78.1 N/A N/A 81.2
P A G E
Wh
T O T A L I N D U S T R Y C A P A C I T Y U T I L I S A T I O N
90.0
,τ,.ο
80.0
75.0
70.0
65.0
55.0
50.0 <—■
F I G U R E 2 . 1 4
Consumer goods:
capacity utilisation
rates, first quarter
1996
(%)
EUR15 Β DK D GR E F IRL I L NL A Ρ FIN S UK
S O U R C E : DGII,
B U S I N E S S S U R V E Y
Annual growth rate: latest quarter, t /1-4
Second quarter 1995
Third quarter 1995
Fourth quarter 1995
tirsi
quarter 1996 T A B L E 2 . 8
EUR15 B DK D GR E F IRL I L NL A Ρ FIN
S
UK
0.2 0.5
().()
-0.1 0.3 -2.7 -0.6 1.8 2.4 -6.2 1.5 Ν.'Λ 1.0 Ν/Λ Ν/Α -2.4
81.7 78.0 82.0 86.4
70.Ί 75.8 83.3 75.4 76 5 «6.8 84.7 Ν/Α 7').2 Ν/Α Ν/Α 85.1
81.6 77.6 83.0 84.9 71.3 7 7.0 83.8 82.7 77.2 85.7 85.4 Ν ν\ 78.7 Ν'Λ Ν/Α 83.4
81.3 79.0 82.0 85.4 76.9 Γ 3.6 83.9 81.7 76.4 82.8 85.1 Ν/Α 79.9 Ν/Α Ν 'Λ 82.7
81.6 78.5 83.0 85.8 71.7 75.3 82.2 81.2 78.1 81.7 85.3 Ν Λ 79.9
Ν/Λ Ν/Α 81.9
Consumer goods: capacity utilisation
rates (%)
S O U R C E : DGII, BUSINESS SURVEY
T O T A L I N D U S T R Y T R A D E I N D I C A T O R S
F I G U R E 2 . 1 5
Trade indicators, trend cycle (1990 = 100)
Export value
Import value
Terms oí trade
[WÄ
S O U R C E : S i a t
80.0
01-94 03-94 05-94 07-94 09-94 11-94 01-95 03-95 05-95 07-95 09-95 11-95
T A B L E 2 . 9 Latest quarter
available
Exports Value Volume
Imports
Valu Volu
Terms of trade
Three month on three month growth rates for trade indicators, in ECU terms (%)
[WÄ S O U R C E : S î t i t
EUR15
Β / L
DK D CR E F IRL I NL A Ρ FIN s UK 1095 0995 1095 1095 0995 1095 1095 0895 1095 0695 1095 1095 C i c i c i
::
,-.
C i.:
o o ■ : c i o O o o 1295 1195 1295 1295 1195 1295 1295 1095 1295 0895 1295 1295 1.1 o.i 1.6 1.4 0.5 2.5 3.6 6.4 0.8 5.4 N/A 6.1 N/A N/A 0.8 1.0 0.5 2.3 0.3 2.3 2.6 0.0 4.9 0.8 8.6 N/A 1.6 N/A N/A 2.1 2.9 1.2 0.6 0.2 4.2 2.7 0.5 2.6 3.2 1.1.6 N/A 1.7 N/A N/A 0.7 2.2 0.5 2.7 0.8 2.9 3.0 43.6 0.4 0.9 5.9 N/A 0.9 N/A N/A 1.7 0.7 0.8 2.a 0.7 0.6 1.4 0.1 1.5 0.6 2.5 N/A 1.1 N/A N/A 0.9T O T A L I N D U S T R Y
T R A D E I N D I C A T O R S
F I G U R E 2 . 1 6
Year on year growth rates for trade
indicators, based on
changes from the corresponding quarter of the previous year, in ECU terms (%)lExport value
llmport value
EUR15 B / L DK IRL I NL S O U R C E : euro««
[WÄ
Latest quarter available
Exports
Value Volume
Imports
Valu Volti
Terms of
trade T A B L E 2 . 1 0
EUR15 B / L DK D CR E F IRL I NL A Ρ FIN S UK 1095 0995 1095 1095 0995 1095 1095 0895 1095 1095 1095 1095 o c i c i O O o c i c i c i c i c i c i c i c i c i I295 I 195 1295 1295 1195 1295 1295 1095 1295 1295 1295 1295 3.7 3.0 5.6 1.2 8.8 7.0 0.4 20.6 19.0 21.3 N/A 14.6 N/A N/A ·.') 0.0 6.2 5.4 3.4 2.2 1.7 3.9 15.1 5.9 25.8 N/A I 1.2 N/A N/A 8.5 6.6 0.1 0.7 ■1.2 8.7 7.0 0.5 16.3 16.0 13.9 N/A 1.2 N / A N/A 5.2 4.9 6.2 43.1 3.0 2.8 1.8 3.3 8.4 4.4 15.0 N/A 3.3 N/A N/A 6.5 2.1 2.9 0.5 0.4 0.3 0.1 0.3 2.4 1.1 4 . 6 N/A
1.8
N/A
N/A 0.0
Year on year growth rates for trade indicators, based on changes from the corresponding quarter of the previous year, in ECU terms (%)
Γ=Ε3
S O U R C E : eurostat
P A N O R A M A T O T A L I N D U S T R Y
T R A D E I N D I C A T O R S
B E L G I Q U E / B E L G I Ë , L U X E M B O U R G DANMARK
F I G U R E 2 . 1 7
Trade indicators by
goods sector,
trendcycle
(1990 = 100)
115 110 105 100 95
85
D E U T S C H L A N D ELLADA
200
ESPAÑA FRANCE
Export value
Import value
. . . . Te r r n s of trade
:. L ^
J U U RCE ! eurostat o o
115 110 105 100 95 90 85 80
c^ σ>
P A G E
m
T O T A L I N D U S T R Y T R A D E I N D I C A T O R S
IRELAND ITALIA
FIGURE 2.17
Trade indicators by goods sector, trend-cycle (1990 = 100)
NEDERLAND ÖSTERREICH
100 90 80 70 60 50 40 30
2(1
10
Not available
PORTUGAL SUOMI/FINLAND
111)
100 90 80 70 60 50 40 30 20 10
0
Export value
Import value
Terms of trade
Not available
[WÄ
S O U R C E : eurostat
S U Ρ Ρ L E M E
T O T A L I N D U S T R Y
T R A D E I N D I C A T O R S
SVERIGE UNITED KINGDOM
F I G U R E 2 . 1 7
Trade indicators by goods sector, trend-cycle
(1990 = 100)
70
60
50
40
30
20
I0
0
Not available
90
Export value Import value Terms of trade
S O U R C E :
. L ^
P A P E R , P R I N T I N G A N D P U B L I S H I N G ( N A C E 2 1 + 2 2 C O M M E N T A R Y
P A N O R A M A
The industry is divided into two sub-sec-tors: the manufacture and processing of pulp, paper and paperboard (54.6% of EUR 15 output in 1995) and printing and
publishing (45.4%). Paper and board, manufactured chiefly from waste paper
and/or cellulose, comprise all types of paper materials used for printing, writing and drawing, for household, hygienic and photographic purposes, as office
sup-plies, for making packaging and cardboard display cases and also as a currency substrate in the form of notes and cheques. Some of the European Union's leading paper manufacturers are KNP BT (Netherlands), Arjo Wiggins Appleton (United Kingdom) and SCA-PW (Sweden). Of this six world leaders in 1993, two were
European, two Japanese and six from the USA. The EU front runners in the print-ing and publishprint-ing branch are Bertelsmann (Germany), Hachette (France) and Reed Elsevier (Netherlands). Despite the forecasts of the death of paper as a medium, it still accounts for some 60% of total consumption by the communications media.
However, because electronic media bring cost savings in terms of information dis-semination and waste management, they are likely to continue to expand.
The paper sector is keenly aware of the need for environmental protection and recycling. 43.3% of the paper consumed in EUR 15 in 1994 was recycled. There
are differences between countries, however. More recycled paper in general is used in northern Europe than in the south: over 60% in Sweden, the Netherlands and Germany compared with less than 30% in Greece and Italy. Waste paper is collected and recovered by various associations as well as via containers placed in
both urban and rural areas. Yet the growing importance of recycled paper also means higher costs. The percentage of paper bleached without the use of chlorine, already high in German-speaking and Scandinavian countries, is constantly increas-ing; paper manufacturers also take an active part in both reforestation and
afforesta-tion.
The latest figures indicate that capacity utilisation in the paper sub-sector was 83.0% for EUR 12 in January 1996: 84.6% in Germany, 80.8% in Spain and
86.5% in France. In the printing and publishing sub-sector the figures were 78.8% for EUR 12, 80.0% in Denmark, 74.3% in Italy and 87.8% in the Netherlands.
The production index for EUR 15 dropped by 2.3% between April 1995 and April 1996: by 2 . 1 % in the United Kingdom, 1.8% in France, 5.5% in Italy and 0.8% in Germany. Over the same period the price index was up by 0.7% for EUR 15, 2.0% in Italy and 4.9% in the United Kingdom, while in France it fell by 4.9% and by
0.6% in Germany.
EUR 15 output up by
1 1 .4% between
1994 and 1 995
I N T H I S S E C T I O N :
C O M M E N T A R Y
S T R U C T U R A L I N D I C A T O R S
S H O R T - T E R M I N D I C A T O R S
P A P E R , P R I N T I N G A N D P U B L I S H I N G C O M M E N T A R Y
F I G U R E 3 . 1 . 1
EUR15 production in constant prices (billion ECU)
200
S o u R C E : DEBA GEIE 1992
In 1995 the paper, printing and publishing sector
accounted for 6.9% of total EUR 15 industrial out-put. The equivalent figures were 7.5% for Japan, 11.7% for Canada and 12.0% for Norway. Amongst the Member States, Sweden recorded
14.4% and Finland 25.5%. EUR 15 production in 1995 was valued at ECU 223.7 billion - an increase of 11.4% over 1994 in current prices and 1.3% in constant prices. Trends in current prices ranged from +2.8% in the United Kingdom via
+ 11.7% in Germany to +24.2% in Finland; in real terms, production was up by 4.0% in Italy but down by 2 . 1 % in France. The annual average growth rate for EUR 15 between 1990 and 1995
was 3.1 %, as against 0.9% in real terms. In 1995 the new Member States accounted for 18.9% of total EU production, divided up as follows:
Sweden 8.7%, Finland 6.8% and Austria 3.4%.
Sweden was the fifth largest producer in the EU, behind Germany (18.6%), France (17.1%) and the United Kingdom (15.9%), together accounting for more than half of total EU production, and Italy
(9.7%).
Value added at factor cost amounted to ECU 81.9 billion in 1995 - an increase of 10.0% over 1994 for EUR 15, 17.6% for Denmark, 2 3 . 1 % for Finland and 16.4% for Austria. Germany con-tributed 19.5% of total EU added value, the
United Kingdom 18.6% and France 15.5%. The annual average increase in value added for EUR 15 between 1990 and 1995 was 2.4%.
F I G U R E 3 . 1 . 2
Share of value-added at factor cost, 1995
S O U R C E : DEBA GEIE
P A G E
Wh
P A P E R , P R I N T I N G A N D P U B L I S H I N G C O M M E N T A R Y
US production in 1994 amounted to ECU 260.7 billion (ECU 200.8 billion for EUR 15) an increase of 3.3% in a year and 2.0% as the annual average between 1989 and 1994. At ECU 192.6 billion, Japanese production in 1995 was 7.8% up on its 1994 level.
Total EU consumption in 1994 was up by 4.7%, at ECU 1 73.9 billion. Denmark saw an 8.8% increase and Germany 0.3%. The annual average consumption trend between 1989 and 1994 was
+ 1.4% for EUR 12, + 3 . 3 % for Germany and 0.2% for the United Kingdom.
Others
D 20%
F I G U R E 3 . 1 . 3
Share of number of employees, 1995
S o u R C E : DEBA CEIE
In 1995 the paper, printing and publishing sector employed 1.5 million workers in EUR 15 ( 7 . 1 % of the industrial workforce, compared with 6.4% in 1985) a drop of 0.5% over a year and 2.0% as an annual average since 1989. The United Kingdom employed 23.3% of the total workforce in the EU and Germany 19.4%. Almost two mil lion workers were employed in the USA and 845 000 in Japan.
The wage cost index for EUR 12, which has been falling for the past three years, remained largely the same in France, the United Kingdom and the Netherlands but was above the EU average in Germany and below it in Italy.
UK
s
] IN
Ρ
A
NI
I
I
IRL
I
Γ
GR
η
DK
I!
■ l i :
F I G U R E 3 . 1 . 4
Labour costs, 1994 (million ECU)
4000 6000 8000 10000 12000 S o u R C E : DEBA GEIE
F I G U R E 3 . 1 . 5
Production in constant
prices, 1995
(million ECU)
S O U R C E : DEBA GEIE
P A P E R , P R I N T I N G A N D P U B L I S H I N G
C O M M E N T A R Y
F I G U R E 3 . 1 . 6
Share of world exports (forEUR12), 1995
S O U R C E :
.im
NL 10% À
UK 12%
Others 6%
^ v 9% B/L
In the same year extraEU exports were valued at ECU 12.3 billion for EUR 12 an annual increase of 12.1 %. National trends were disparate, howev er, with a drop of 10.7% in Portugal compared with a rise of 28.1 % in the Netherlands. In 1994 Germany accounted for 38.8% of extraEU exports (EUR 12), the United Kingdom for 17.5% and France for 14.2%. The (exports/imports) coverage rate in Europe has been on the decline since 1989, but is still large, as indicated by its 1994 value of 169.6%. Every Member State had a posi tive trade balance in that year; the surplus for EUR 12 was ECU 8.6 billion. The extraEU export/pro duction ratio was 7.4% in 1994 for EUR 12, as against 5.7% in 1990.
ExtraEU imports (EUR 12) amounted to ECU 20.9 billion in 1994, having risen by only 0.4% per annum on average since 1994. 28.6% of extraEU imports in 1994 went to Germany, 22.8% to the United Kingdom and 12.1 % to France. The extra EU import/consumption ratio was 12.0% in 1994. US imports soared by 51.1 % in a year, reaching a value of ECU 12.1 billion, while Japanese imports amounted to ECU 3.6 billion as against ECU 2.3 billion the year before.
US exports amounted to ECU 12.3 billion in 1994 an increase of 20.0% over 1993. The US trade surplus fell from ECU 2.2 billion to ECU 0.2 bil lion over the same period, and the coverage rate from 127.9% to 101.6%. Japan's exports were valued at ECU 2.2 billion in 1994 an increase of 5.4% since the previous year. Its coverage rate, which has a structural tendency to be less than
100%, fell from 92.0% in 1993 to 6 4 . 1 % in 1994.
F I G U R E 3 . 1 . 7
Share of world imports (for EUR12), 1995
S O U R C E :
ΓΞΡΑ
P A P E R , P R I N T I N G A N D P U B L I S H I N G
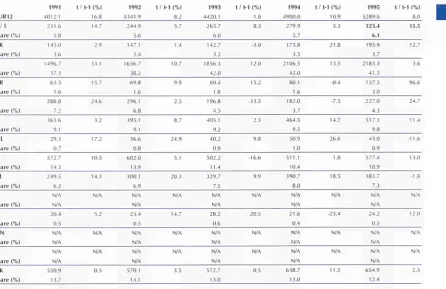
V A L U E - A D D E D A N D P R O D U C T I O N
1991 t / t - 1 ( % ) 73536.7 O
1992 73707.7
t / 1 - 1 (%) 0.2
1993 71463.8
t / t-1 (%) -3.0
1994 74424.1
t / t - 1 (%) 4.1
1995 81857.1
t / t-1 (%) 10.0 1! share (%) I3K share (",.1 D share (%) C,K share (%) E share (%) F share (%) IRL share (%) 1 share ("„1 L share (%) NL share (%) A share (%) Ρ share (%) F I N share (%) S share (",.1 UK share ("„1 2076.4 2.8 1359.6 1.« 14666.5 19.9 267.9 0.4 5519.8 7.5 11037.2 15.0 450.6 0.6 8151.7 11.1 59.4 0.1 4032.2 5.5 2044.8 2 11 845.2 1.1 3747.2 5.1 4580.4 (,.2 14697.7 2(1.0 11.7 1.1 9.1 -0.1 7.7 2.1 7.(1 6.2 11.0 6.6 4.3 4.(1 -16.5 -24.1 1.6 2185.3 3.0 1374.6 1.9 14913.5 20 2 283.8 0.4 5542.5 7.5 10973.7 14.9 495.8 0.7 8158.8 11.1 69.5 0.1 4199.4 5.7 2102.7 2.9 932.0 1.3 3503.7 4.8 4428.4 6.0 14544.0 19.7 5.2 1.1 1.7 5.9 0.4 43.6 10.0 0.1 17.0 4.1 2.8 10.3 -6.5 -3.3 -1.0 2118.4 3.0 1368.2 1.9 14579.4 20.4 289.2 0.4 4946.4 6.9 10951.6 15.3 482.1 0.7 7038.4 '1.8 72.1) 0.1 4097.2 5.7 2120.1 3.(1 863.8 1.2 3809.0 5.3 4503.5 6.3 14224.5 19.9 -3.1 -0.5 -2.2 1.9 -in.« -0.2 -2.11 -11.7 3.6 -2.4 0.1) -7.3 8.7 1.7 -2.2 2194.1 2.9 1487.2 2.0 14474.9 19.4 296.0 0.4 5140.7 6.9 11580.7 15.6 505.7 0.7 7161.3 ').(, 76.1 0.1 4261.3 5.7 2366.0 3.2 907.7 1.2 4181.6 5.6 4915.2 6.6 14875.7 20.0 3.6 8.7 -0.7 2.4 3.9 5.7 4.9 1.7 5.7 4.0 11.6 5.1 9.8 9.1 4.6 2339.0 2.9 1748.9 2.1 15980.2 19.5 324.8 0.4 5923.3 7.2 12648.2 15.5 522.2 0.6 7700.4 9.4 85.0 0.1 4712.3 5.8 2753.4 3.4 1051.3 1.3 5147.1 6.3 5689.7 7.0 15231.1 18.6 6.6 17.6 10.4 '1.7 15.2 9.2 323 725 11.7 10.6 16.4 1 3.8 23.1 15.8 2.4
T A B L E 3 . 1 . 1
Value-added at factor cost (million ECU)
S O U R C E : DEBA GEIE
1991 t / t -EUR15 198242.6
1 (%) 3.4
1992 196287.3
t / t-1 (%) -1.0
1993 191429.2
t / t - 1 ( % ) 1994 -2.5 200798.4
t /1-1 (%) 1995 t / t-4.0 22 3670.8
1 ( % ) 11.4 B share DK share D share GR share E share F share IRL share 1 share L share NL share A share l> share FIN share S share U K share
(%)
(%)
(%)
(%)
<%>
(%)
(%)
(%)
(%)
(%)
(%)
(%)
(%)
(%)
(%)
5570.4 2.8 3002.3 1.5 38836.9 I 9.6 846.4 0.4 14270.8 7.2 32401.5 16.3 1012.7 II.3 22470.2 I I . 3 139.0 0.1 10458.8 5.3 5725.2 2.9 2415.8 1.2 11623.4 ,.'> 15237.1 7.7 34232.0 17.3 0.0 1.7 8.3 -1.8 9.1 0.5 9.8 0.3 35.3 2.5 4.1 4.7 -9.7 15.9 1.6 5790.9 3.0 2930.2 1.5 38733.8 l'I -893.5 0.5 14131.5 7.2 32656.1 16.6 1113.1 0.6 22545.1 11.5 166.9 0.1 10730.7 5.5 5887.3 3.0 2662.5 1.4 10172.0 5.2 14590.1 7.4 33283.6 17.0 4.0 -2.4 -0.3 5.6 -I.I) 0.8 9.9 0.3 20.1 2.6 2.8 111.2 -12.5 -1.2 -2.8 5554.9 2.9 2918.1 1.5 37327.2 19.5 907.8 0.5 12806.6 (,.7 32631.3 17.0 1087.7 0.6 19518.7 10.2 172.9 0.1 10922.0 5.7 5936.0 3.1 2503.5 1.3 11164.1 5.8 14954.9 7.8 33023.5 17.3 -4.1 -0.4 -3.6 1.6 '1.4 -0.1 -2.3 -13.4 3.6 1.8 0.8 -(..I) 9.8 2.5 -0.8 5746.1 2.9 3176.4 1.6 37271.1 18.6 933.1 0.3 13700.1 6.8 34632.8 17.2 1151.0 0.6 19973.0 ').') 182.8 0.1 11351.3 5.7 6624.5 3.3 2649.4 1.3 12310.2 6.1 16503.1 8.2 34593.5 17.2 3.4 8.9 •0.2 2.8 7.0 6.1 5.8 2.3 5.7 3.9 I 1.6 5.8 10.3 10.4 4.8 6165.1 2.8 3735.1 1.7 41640.9 18.6 1039.8 11.3 16087.8 7.2 38209.1 17.1 1212.7 0.5 21680.2 0.7 204.2 0.1 12701.0 5.7 7709.2 3.4 3075.1 1.4 15289.4 6.8 19365.3 8.7 35555.7 15.9 73 17.6 11.7 11.4 17.4 10.3 .3.4 11.3 1 1.7 1 1.9 16.4 16.1 24.2 17.3 2.8T A B L E 3 . 1 . 2
Production in current prices
(million ECU)
S O U R C E : DEBA GEIE
P A P E R , P R I N T I N G A N D P U B L I S H I N G
E M P L O Y M E N T A N D L A B O U R C O S T S
T A B L E 3 . 1 . 3
Number of employees
(units)
EUR15
1991
695162.0
t / t-1 (%)
0.0
1992
1638068.9
t / t-1 (%)
-3.4
1993
1566890.8
t / 1 - 1 (%)
-4.3
1994
1532113.7
t / 1 - 1 (%)
-2.2
1995
1524110.5
t / 1 - 1 (%)
-025
S O U R C E : DEBA GEIE
B share (%) DK share (%) D share (':.,) GR share (%) E share (Y.) F share (%) IRL share (%) I share (%) L share (%) NL share (%) A share (%) Ρ
share (%)
FIN
share (%) S share (%) UK
share (%)
41454.0 2.4 28787.0 1.7 345594.0 20.4 15008.0 0.9 129425.0 7.6 253599.0 15.0 12151.0 0.7 146441.0 8.6 1416.0 0.1 88077.0 5.2 44000.0 2.6 37057.0 2.2 78000.0 4.6 103500.0 6.1 370653.0 21.9 -7.1 -1.2 4.5 -6.3 -1.0 0.3 1.8 1.1 5.4 3.4 -1.3 -6.2 -5.1 10.9 -4.6 40549.0 2.5 27216.0 1.7 340797.0 20.8 14966.0 0.9 125943.0 7.7 244923.0 15.0 12295.0 0.8 142044.0 8.7 1412.0 0.1 88477.0 5.4 43333.9 2.6 37255.0 2.3 72900.0 4.5 95000.0 5.8 350958.0 21.4 -2.2 -5.5 -1.4 43.3 -2.7 -3.4 1.2 -3.0 43.3 0.5 -1.5 0.5 -6.5 41.2 -5.3 39256.0 2.5 26548.0 1.7 317723.0 20.3 15179.0 1.0 112740.0 7.2 236907.0 15.1 12262.0 0.8 137732.0 8.8 1434.0 0.1
83310.0 >
Ά
,%r.4 2.6 34723.0 2.2 70704.1 4.5 88844.3 5.7 348098.0 22.2 -3.2 -2.5 -6.8 1.4 -10.5 -3.3 -0.3 -3.0 1.6 -5.8 ^1.4 -6.8 -3.0 -6.5 41.8 39063.0 2.5 N/A N/A 302583.0 19.7 15675.0 1.0 106099.0 6.9 236761.0 15.5 12162.0 0.8 131275.0 8.6 1447.0 0.1 79280.0 5.2 39763.4 2.6 34029.0 2.2 68363.8 4.5 8464025 5.5 354850.0 23.2 -0.5 N/A -1.8 3.3 -5.9 -0.1 -0.8 -4.7 0.9 ^1.8 ^t.O -2.0 -3.3 -4.7 1.9 41442.0 2.7 N/A N/A 296048.0 19.4 15560.0 1.0 104379.0 6.8 234160.0 15.4 12153.0 0.8 130345.0 8.6 1482.0 0.1 N/A N/A 39470.6 2.6 32451.0 2.1 68003.6 425 83767.3 5.5 358142.0 23.5 6.1 N/A -2.2 -0.7 -1.6 -1.1 41.1 -0.7 2.4 N/A -0.7 -4.6 -0.5 -1.0 0.9T A B L E 3 . 1 . 4
Labour costs
(million ECU)
EUR12
1990
39744.3
t /1 - 1 (%)
7.3
1991
42576.0
t / 1 - 1 (%)
7.1
1992
43435.7
t / 1 - 1 (%)
2.0
1993
42645.7
t / 1 - 1 (%)
-1.8
1994
42968.8
t / 1 - 1 (%)
0.8
S O U R C E : DEBA GEIE
B share (%) DK share (%) D share (%) GR share (%) E share (%) F share (%) IRL share (%) I share (%) L share (%) NL share (%) A share (%) Ρ share (%) FIN share (%) S share (%) UK
share (%)
1317.5 3.3 960.7 2.4 9571.2 24.1 206.8 0.5 2681.0 6.7 8019.8 20.2 296.8 0.7 4905.6 12.3 36.3 0.1 2391.3 6.0 N/A N/A 402.7 1.0 N/A N/A N/A N/A 8954.6 22.5 16.2 4.2 12.0 8.2 14.0 6.5 5.0 6.6 19.4 5.1 N/A 25.0 N/A N/A 1.2 1357.6 3.2 978.6 2.3 10691.6 25.1 214.2 0.5 2961.1 7.0 8347.7 19.6 318.6 0.7 5338.8 12.5 43.3 0.1 2597.4 6.1 N/A N/A 457.0 1.1 N/A N/A N/A N/A 9270.1 21.8 3.0 1.9 11.7 3.6 10.4 4.1 7.3 8.8 19.3 8.6 N/A 13.5 N/A N/A 3.5 1496.4 3.4 980.1 2.3 11345.8 26.1 231.5 0.5 3035.9 7.0 8420.4 19.4 340.2 0.8 5364.9 12.4 45.2 0.1 2776.7 6.4 N/A N/A 536.6 1.2 N/A N/A N/A N/A 8862.0 20.4 10.2 022 6.1 8.1 2.5 0.9 6.8 0.5 4.4 6.9 N/A 17.4 N/A N/A -4.4 1576.7 3.7 1005.2 2.4 11521.8 27.0 248.8 0.6 2558.6 6.0 8553.8 20.1 349.9 0.8 466723 10.9 49.8 0.1 2873.3 6.7 N/A N/A 488.6 1.1 N/A N/A N/A N/A 8751.7 20.3 5.4 2.6 1.6 7.5 -15.7 1.6 2.9 -13.0 10.2 325 N/A -8.9 N/A N/A -1.2 N/A N/A N/A N/A 11425.2 26.6 272.8 0.6 2347.8 5.5 8789.4 20.5 351.7 0.8 4455.0 10.4 55.3 0.1 2875.7 6.7 N/A N/A N/A N/A N/A N/A N/A N/A 9207.1 21.4 N/A N/A -0.8 9.6 41.2 2.8 0.5 -4.6 11.0 0.1 N/A N/A N/A N/A 5.2
P A G E
Wh
P A P E R , P R I N T I N G A N D P U B L I S H I N G
E X T R A E U E X P O R T S A N D I M P O R T S
1991
9659.8
t / t1 (%)
4.9
1992
10184.8
t / t1 (%)
5.4
1993 t / 1 1 (%)
10971.2 7.7
1994
12298.8
t / t1 (%)
12.1
1995 t /
14776.5
t1 (%)
20.1
B / L
share (%)
D K
share (%)
D
share (%)
GR
share (%)
E
share (%)
F
share (%)
IKI
share (%)
1
share (%)
N L
share (%)
A
share ("„)
l>
share (%)
FIN
share (%)
S
share (%)
UK
share <%)
293.7 3.0 324.0 3.4 3766.6 39.0 42.4 0.4 631.9 6.3 1448.4 15.0 18.9 0.2 832.4 8.6 570.3
3 <)
N/A N/A 149.8 1.6 N/A N/A N/A N/A 1581.4 16.4 4.5 6.6 7.7 18.1 14.4 0.1 3.1 7.1 3.4 Ν'A 16.5 N/A N/A 0.3 318.0 3.1 322.4 3.2 3947.6 38.8 42.8 0.4 736.0 7.2 1530.5 15.0 19.4 0.2 856.1 0.4 631.6 6.2 N/A N/A 140.9 1.4 N/A N/A N/A N/A 1639.5 16.1 8.3 0.5 4.8 0.9 16.5 5.7 2.6 2.8 10.7 N/A 5.9 N/A N/A 3.7 334.5 1.0 333.4 1.0 4202.5 38.3 49.8 0.5 763.7 7.0 1602.2 14.6 21.3 0.2 905.6 8.3 647.9 5.9 N/A N.'A 116.4 1.1 N/A N'A N/A N.'A 1994.0 18.2 5.2 3.4 6.5 16.4 3.8 4.7 9.8 5.8 2.6 N/A 17.4 N/A N/A 21.6 386.2 3.1 364.9 3.0 4770.5 38.8 51.8 0.4 824.5 6.7 1748.7 14.2 37.5 0.3 1033.2 8.4 830.1 6.7 N/A N.'A 104.0 0.8 N/A N/A N/A N/A 2147.4 17,5 15.5 9.4 13.5 4.0 8.0 9.1 76.1 14.1 28.1 N/A 10.7 N/A N/A 7.7 473.0 3.2 373.7 2.5 5812.9 19.3 534.5 3.6 927.3 6.3 2032.7 13.8 74.6 0.5 1315.4 8.9 879.1 5.9 N/A N.'A 146.0 1.0 N/A N/A N/A ■M/A 2207.4 14.9 2225 2.4 21.9 931.9 12.5 16.2 98.9 27.3 5.9 N/A 40.4 N/A N/A 2.8
T A B L E 3 . 1 . 5
ExtraEUR12 exports (million ECU)
[WÄ
SOURCE : sssasi
EUR12
B / L
share (%)
D K
share (%)
D
share (%)
GR
share (%)
E
share (%)
F
share ('".,)
IRL
share (%)
I
share (%)
N L
share (%)
A
share (%)
Ρ
share (%)
F I N
share (%)
S
share (%)
UK
share (%)
1991 20094.3 921.3 4.6 824.4 4.1 6122.5 30.5 291.2 1.4 920.7 4.6 2664.3 13.3 230.1 1.1 2055.5 10.2 1461.9 7.3 N/A N/A 151.7 0.8 N/A N/A N/A N/A 4450.6 22.1
t / t1 (%)
0.5 2.5 4).5 2.3 6.9 11.2 4.4 11.2 4.7 2.0 N/A 20.8 N/A N/A 3.9 1992 19323.8 815.3 4.2 784.9 4.1 5836.2 30.2 229.9 1.2 905.2 4.7 2591.5 13.4 213.8 1.1 2037.3 10.5 1491.0 7.7 N/A N/A 148.2 0.8 N/A N/A N/A N/A 4270.5 22.1
t / 1 1 (%)
3.8 11.5 1.8 4.7 21.1 1.7 2.7 7.1 43.9 2.0 N/A 2.3 N/A N/A ^t.O 1993 17716.6 796.3 4.5 759.9 4.3 5208.3 29.4 210.8 1.2 819.8 4.6 2252.6
I 2.7
158.4 0.9 1803.8 10.2 1457.3 8.2 N/A N/A 162.4 0.9 N/A N/A N/A N/A 4087.2 23.1
t / 1 1 (%)
8.3 2.3 3.2 10.8 8.3 9.4 13.1 25.9 11.5 2.3 N.'A 9.6 N/A N/A 4.3 1994 20855.6
1 111.4
5.3 826.2 4.0 5962.3 28.6 245.9 1.2 930.5 4.5 2531.1 12.1 168.3 0.8 2198.8 10.5 1972.3 9.5 N/A N/A 159.0 0.8 N/A N/A N/A N/A 4749.7 22.8
t / 1 1 (%)
17.7 39.6 8.7 14.5 16.7 13.5 12.4 6.3 21.9 35.3 N/A 2.1 N/A N/A 16.2 1995 24467.6 1537.8 6.3 929.8 3.8 6623.1 27.1 356.5 1.5 1105.8 4.5 2970.9 12.1 179.4 0.7 2941.3 12.0 2197.0 9.0 N/A N/A 203.6 0.8 N/A N/A
Ν. Λ
N/A
5422.5
22.2
t / t 1 (%)
17.3 38.4 12.5 11.1 45.0 18.8 17.4 6.6 33.8 11.4 N/A 28.1 N/A N.A 14.2
T A B L E 3 . 1 . 6
ExtraEUR12 imports (million ECU)
[WÄ
S O U R C E : eurostat