1-1-1984
Characterization of interactions between blood and
SilasticÃ
®/hydrogel composites by scanning
electron microscopy and Fourier transform infrared
spectroscopy
Michael John Cyr
Iowa State UniversityFollow this and additional works at:https://lib.dr.iastate.edu/rtd
This Thesis is brought to you for free and open access by the Iowa State University Capstones, Theses and Dissertations at Iowa State University Digital Repository. It has been accepted for inclusion in Retrospective Theses and Dissertations by an authorized administrator of Iowa State University Digital Repository. For more information, please [email protected].
Recommended Citation
Cyr, Michael John, "Characterization of interactions between blood and Silasticî/hydrogel composites by scanning electron microscopy and Fourier transform infrared spectroscopy" (1984).Retrospective Theses and Dissertations. 18101.
Fourier transform infrared spectroscopy
by
Michael John Cyr
A Thesis Submitted t o the
Graduate Faculty in Partial Fulfillm:?nt of the Requirem:?nts for the Degree of
MASTER OF SCIEOCE
Major : Biorredical Engineering
Signatures have been redacted for privacy
Iowa St at e Univers ity
Ames, Iowa
TABLE OF CONTENTS
DEDICATION ••••••••••••••••• ••• •••••••.•••••.•••. • • • • • · • • • • • • • • • • • •
I NTRODUCTION
...
LITERATURE REVI~ ••••••••••••••••••••••••••••••••••••••••••• •• • • • • • ·
Blood-Surface Inter actions
...
General
...
Some components of blood
Ads orption of plasma proteins
...
Adhesion of platelets
...
Activation and the release reactions
...
Charact erization of Adsorbed Proteins
...
General
...
Inf rared spectroscopy ••••••••••.•••••••••••••.••.••...•.• Fourier transform infrar ed spectroscopy ••••••••••••••••••
Internal reflection spectroscopy
Protein-surface studies using IR/ATR spectroscopy • ••• •••• Microstructur al Details of Thranbogenesis •••••••••••••••••••••
General
...
Circulating platelets
Sur face-platelet interaction ••••••••••••••••••••••••••••• Echinocyte surface area
Shape change in relation to the release reaction ••••••••• Role of platelet zones in shape changes ..••••••••••••.••• Thranbogenesis and embolism on biorrat erials • • •••.•••••••• Properties of Materials
Silicone rubber Hydr ogels
Sur face properties affecting thranbogenesis ••••••• •• •• •••
MATERIALS AND METHODS Materials
Arteriovenous shunt model Shunt rraterials
Methods •••••••••.•.. Shunt preparation Implantation FTIR analys is SEM analysis
...
Critical surface tension and contact angle values
RESULTS AND DISCUSSION
... ... ... ... ...
Results
SF.M analysis of shunt surfaces ••••••.••••••••••
Unexposed ..•..•.... ...••.•. •••• . •• ...•• 15 seconds
30 seconds exposure exposure
5 minutes ex-posure ••.• .••••• ••...• .•.•••...
15 minutes exposure
75 minutes exposure •• ••..•...•..•..••.•.•..•..
FTIR analysis of shunt surfaces ••••••••••.••••.•.••••••.
Discussion
...
SEM analysis FTIR analysis
Comparison of FTIR and SEM data ••.•.•.• •.•••••••••.
CONCLUSION
BIBLicx:;RAPHY
APPENDIX A: PARAMETER SETIINGS
APPENDIX B: FTIR SPEX:TRA
APPENDIX C: CRITICAL SURFACE TENSION AND CONTACf ANGLE VALUES
OCKNCMLEDGEMENTS
... ... ...
LIST OF TABLES
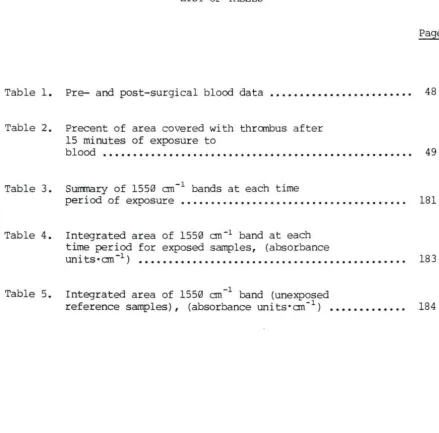
Table 1. Pre- and post-surgical blood data • •• ••••••••••••••••••••• 48
Table 2. Precent of area covered with thranbus after 15 minutes of exposur e to
blood . . . . • . . . 49
Table 3. Surnnary of 1550 an-1 bands at each time
Table 4.
Table 5.
period. of exposure . . . • . . . 181
Integrated area of 1550 an-1 band at each
time period for exposed samples, (absorbance
uni ts · aTt -i ) • • • • • • • • • • • • • • • • • • • . • • • . • • • • • • • • • • • • • • • • • • • • • 18 3
-l
Integrated area of 1550 an band (unexposed
reference samples) , (absorbance units·an-1
[image:5.572.52.511.90.737.2] [image:5.572.54.493.95.528.2]LIST OF FIGURES
Figure 1. Histograms of platelet count after each time period of exposure to blood.
Asterisk (*) indicates cases where no
count was made because there was a red clot (Figure lK) or the clot was flushed
(Figure lM) . . • . . . 50 Figure 2. Histograms of platelet count after 15
minutes of ex!)Osure to blood and critical surface tension for each shunt formulation Figure 3. SEM micrograph of SR shunt before exposure
58
to blood. (scale bar= 10 µm) •••••••••••••••••••••••••• 62 Figure 4.
Figure 5.
SEM micrograph of 2%SR shunt before exposure to blood. (scale bar = 10 µm) SEM micrograph of 12%SR shunt before exposure to blood. (scale bar = 10 µm) Figure 6. SEM micrograph of 2%SR/20%H/0%N shunt
before exposure to blood. (scale bar = 10
62
64
µ m) • • • • • • • • • • • • • • • • • • • • • • • • • • • • • • • • • • • • • • • • • • • • • • • • • • • • • 64
Figure 7. SEM micrograph of 2%SR/15%H/5%N shunt before exposure to blood . (scale bar
=
10µ m) • • • • • • • • • • • • • • • • • • • • • • • • • • • • • • • • • • • • • • • • • • • • • • • • • • • • • 6 6 Figure 8. SEM micrograph of 2%SR/ 10%H/ 10%N shunt
before exposure to blood. (scale bar = 10
µm) • • • • • • • • • • • • • • • • • • • • • • • • • • • • • • • • • • • • • • • • • • • • • • • • • • • • • 66
Figure 9. SEM micrograph of 2%SR/5%H/15%N shunt before exposure to blood. (scale bar = 10
µm) • • • • • • • • • • • • • • • • • • • • • • • • • • • • • • • • • • • • • • • • • • • • • • • • • • • • • 68
Figure 10. SEM micrograph of 2%SR/0%H/20%N shunt before exposure to blood . (scale bar =
10 µ m) • • • • • • • • • • • • • • • • • • • • • • • • • • • • • • • • • • • • • • • • • • • • • • • • • 68 Figure 11. SEM micrograph of 12%SR/ 20%H/ 0%N shunt
before exposure to blood. (scale bar =
10 µm) • • • • • • • • • • • • • • • • • • • • • • • • • • • • • • • • • • • • • • • • • • • • • • • • • 70
Figure 12. SEM microgr aph of 12%SR/ 15%H/ 5%N shunt before exposure to blood . (scale bar =
Figure 13. SEM micrograph of 12%SR/10%H/10%N shunt before exposure to blood. (scale bar =
10 µm) • • • • • • • • • • • • • • • • • • • • • • • • • • • • • • • • • • • • • • • • • • • • • • • • • 7 2 Figure 14. SEM microgr aph of 12%SR/5%H/ 15%N shunt
before exposure to blood. (scale bar =
10 µ m) • • • • • • • • • • • • • • • • • • • • • • • • • • • • • • • • • • • • • • • • • • • • • • • • • 7 2 Figure 15. SEM micrograph of 12%SR/0%H/20%N shunt
before exposure t o blood. (scale bar =
10 µ m) • • • • • • • • • • • • • • • • • • • • • • • • • • • • • • • • • • • • • • • • • • • • • • • • • 7 5 Figure 16. SEM mi crograph of 12%SR shunt showing a
cross sectional veiw. Note coating thickness of the 12% filler silicone
rubber. (scale bar= 250 µm) •• • ••• • •• •• •••••• • ••••• • •• 75 Figure 17. SEM microgr aph of SR shunt surface after
0. 25 minute exposure to blood . (scale
bar = 10 µm) • • • • • • • • • • • • • • • • • • • • . • • • • • • • • • • • • • • • • • • • . • • 77
Figure 18. SEM micrograph of 2%SR shunt sur face after 0. 25 minute exposure to blood.
(scale bar = 10 µm) ••••• • ••••••••••••• • ••••••••••••••••• 77 Figure 19. SEM micrograph of 12%SR shunt surface
after 0. 25 minute exposure to blood .
(scale bar = 10 µm) . . . 79
Figure 20. SEM micrograph of 2%SR/20%H/0%N shunt surface after 0. 25 minute exposure to
blood. (scale bar= 10 µm) ••••••••• • •••••••••••••••••• 79 Figure 21. SEM micrograph of 2%SR/15%H/5%N shunt
surface after 0.25 minute exposure to
blood . (scale bar = 10 µ m) • • • • • • • • • • • • • • • • • • • • • . • • • • • • 82 Figure 22 . SEM micrograph of 2%SR/10%H/ 10%N shunt
surface after 0. 25 minute exposure to
blood. (scale bar = 10 µm) • • • • • • • • • • • • • • • • • • • • • • • • • • • • 82 Figure 23 . SEM micrograph of 2%SR/5%H/15%N shunt
surface after 0. 25 minute exposure t o
blood. (scale bar = 10 µm) • • • • . • • • • • • • • • • • • • • • . . • • • • • • 84 Figure 24 . SEM micrograph of 2%SR/0%H/20%N shunt
surface after 0. 25 minute exposure to
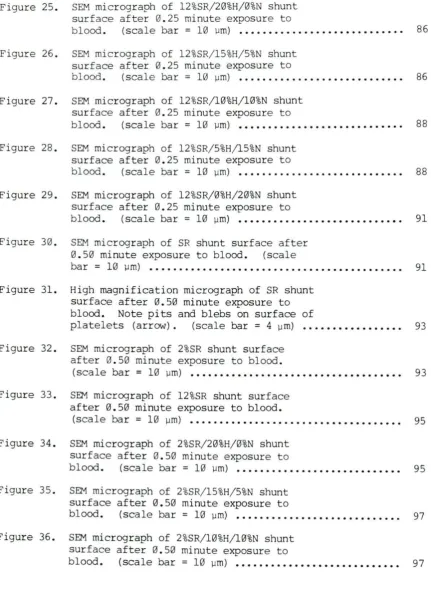
Figure 25 . SEM micrograph of 12%SR/ 20%H/0%N shunt surface aft er 0. 25 minute exposure to
blood. (scale bar = 10 µm) • • • • . . • . . . • • • . • • • • • • • • . . . 86
Figure 26 . SEM micrograph of 12%SR/ 15%H/ 5%N shunt surface aft er 0. 25 minute exposure to
blood. (scale bar = 10 µm) . . • • • . . . • . . • . • . • • • . • • • • • . 86
Figure 27 . SEM mi cr ogr aph of 12%SR/ 10%H/ 10%N shunt sur face after 0. 25 minute exposure t o
blood. (scale bar = 10 µm) • • • • • • • . • • • • • • • • • . . • • • . • • • • • 88
Figure 28 . SEM micrograph of 12%SR/ 5%H/15%N shunt sur face aft e r 0. 25 minute exposure to
blood. (scale bar
=
10 µm) • • • • • . . . • • • • • • • • • • • • • • . • • 88 Figure 29. SEM micrograph of 12%SR/0%H/ 20%N shuntsurface aft er 0. 25 minute exposur e t o
blood . (scale bar = 10 µm) • • • • • • • • • • • • • . . • • • • • • . • • • • • • 91
Figur e 30 . SEM micr ogr aph of SR shunt surf ace after 0. 50 minute exposure t o blood . (scale
bar = 10 µm) • . . . . • • • • . • • • • • • • • . • . . . . . . . • • • • • • • • • • • • • • . . 91
Figure 31 . High magnificat ion mi crograph of SR shunt surface after 0. 50 minute exposure to blood. Note pits and blebs on sur face of
plat elets (arrow). (scale bar
=
4 µm) • . • • • • • • • • . • • • • • • 93 Figure 32. SEM micrograph of 2%SR shunt sur faceaft er 0. 50 minute exposure t o blood .
(scale bar = 10 µm) . • . . . • • • • • . . . • • . • • . • • • • . • • • . . • • . 93
Figur e 33 . SEM micrograph of 12%SR shunt surface after 0. 50 minute exposure t o bl ood.
(scale bar = 10 µm) • • • • • • • • . • • • . • . • . • • • • • . • • • • • • • . . . • • • 95
Figure 34 . SEM microgr aph of 2%SR/20%H/0%N shunt surface after 0.50 minute exposure to
blood . (scale bar
=
10 µm) • • • . • . • • • • • • • • • • • • • • • • • • • • • • 95 Figure 35 . SEM micrograph of 2%SR/ 15%H/ 5%N shuntsurface after 0. 50 minute exposure to
blood. (scale bar = 10 µrn) • • • • • • • • . • • • • • • • • • • • • • . • • • • . 97
Figur e 36 . SEM microgr aph of 2%SR/ 10%H/ 10%N shunt sur face after 0. 50 minute exposure to
[image:8.563.58.476.70.669.2] [image:8.563.45.477.82.675.2]Figure 37 . SEM micrograph of 2%SR/ 5%H/ 15%N shunt surface after 0.50 minute exposure t o
blood. (scale bar= 10 µm) • • ••• .•••••• •••••••••••••••• 100 Figure 38. SEM micrograph of 2%SR/ 0%H/ 20%N shunt
surface after 0. 50 minute exposure to
blood. (scale bar = HJ µm) • • • • • • • • • • • • . • • • • • • • • • • • • • • • 100 Figure 39. SEM micrograph of 12%SR/ 20%H/0%N shunt
surface after 0. 50 minute exposure to
blood . (scale bar= 10 µm) •• • •• •• ••••••••• •• •••••• •• • 102 Figure 40 . SEM micrograph of 12%SR/ 15%H/ 5%N shunt
surface after 0. 50 minute exposure to
blood. (scale bar = 10 µm) • • . . . • • • • • • • • • • • • • • • • • • • • • • 102 Figure 41. SEM micrograph of 12%SR/ 10%H/ 10%N shunt
surface after 0. 50 minute exposure to
blood. (scale bar= 10 µm) ••••••••••••••••••••••••••• 104 Figure 42. SEM micrograph of 12%SR/ 5%H/ 15%N shunt
surface after 0.50 minute exposure to
blood. (scale bar= 10 µm) ••••••••••••••••••••••••••• 104 Figure 43. SEM micrograph of 12%SR/0%H/20%N shunt
surface after 0.50 minute exposure to
blood. (scale bar= 10 µm) ••••••••••••••••••••••••••• 107 Figure 44. SEM micrograph of SR shunt surface after
5 minutes of exposure to blood. (scale
bar= 10 µm) •••••••• • •••••• •• • •• •• •• •• • • .•• • •••••••••• 107 Figure 45. SEM micrograph of 2%SR shunt surface
after 5 minutes of exposure to blood.
(scale bar= 10 µm) .. ... ..• ... ••.•.•.•..•..• ... 109
Figure 46. High magnification micrograph of 2%SR shunt surf ace after 5 minutes of blood exposure. Note adherence of discocytes on top of platelets in an early stage of
spreading. (scale bar= 5 µm) •••• •• •••• • •••• • ••• • •••• 109 Figure 47 . SEM micrograph of 12%SR shunt surface
after 5 minutes of exposure to blood.
(scale bar= 10 µm) .. .. .. .••...•...••.•• . •....• . . ... 111
Figure 48. SEM micrograph of 2%SR/20%H/~%N shunt
surface after 5 minutes of exposure to
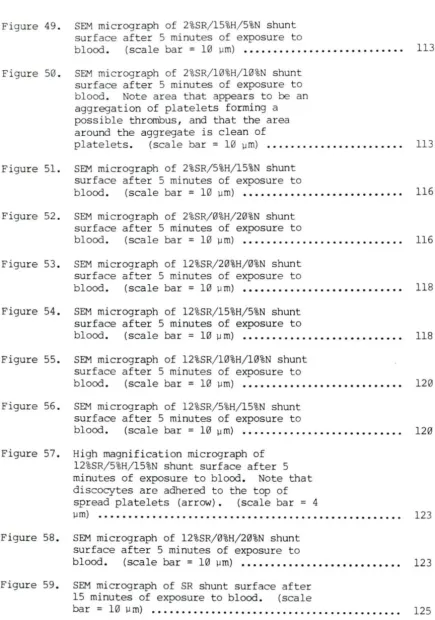
Figure 49. SEM micrograph of 2%SR/ 15%H/ 5%N shunt surface after 5 minutes of exposure t o
blood . (scale bar = 10 µm) • • • • • • . • . • • . • • • • • • • • • • . • • • • 113 Figure 50 . SEM micrograph of 2%SR/ 10%H/ 10%N shunt
surface after 5 minutes of exposure t o blood. Note area that appears to be an
aggregation of platelets forming a possible thrombus, and that the area around the aggregate is clean of
platelets. (scale bar = 10 µm) • • . • . . . . • • • . • • • • . • • • • • . 113 Figure 51. SEM micrograph of 2%SR/ 5%H/ 15%N shunt
surface after 5 minutes of exposure to
blood . (scale bar = 10 µm) • • • • • • • • • • • • • • • • • • • • • • • • • • • 116 Figure 52 . SEM micrograph of 2%SR/ 0%H/ 20%N shunt
surface after 5 minutes of exposure to
blood. (scale bar = HJ µm) • • . . • • . . . • . • • • . • • • • • • • • • • 116 Figure 53. SEM micrograph of 12%SR/ 20%H/ 0%N shunt
surf ace after 5 minutes of exposure to
blood. (scale bar= 10 µm) • •••••••••••• ••••• ••••••••• 118 Figure 54 . SEM micrograph of 12%SR/ 15%H/ 5%N shunt
surface after 5 minutes of exposure t o
blood. (scale bar = HJ µ m) • • • • . • • • • • • • • • • • • • • • . . • • • • • 118 Figure 55. SEM micrograph of 12%SR/ 10%H/10%N shunt
surface after 5 minutes of exposure to
blood. (scale bar= 10 µm) •••••• ••••••••• •••••••••••. 120 Figure 56 . SEM micrograph of 12%SR/ 5%H/ 15%N shunt
surface after 5 minutes of exposure t o
blood . (scale bar = 10 µ m) • • • • • • . • • . . . • • • • • • • • . • • • • . • 120 Figure 57. High magnification micrograph of
12%SR/ 5%H/ 15%N shunt surface after 5 mi nutes of exposure t o blood. Note that discocytes are adhered to the top of spread platelets (arrow) . (scale bar = 4
µm) • • • • • • • • • • • • • • • • • • • • • • • • • • • • • • • • • • • • • • • • • • • • • • • • • • • 123
Figure 58. SEM micrograph of 12%SR/ 0%H/ 20%N shunt surface after 5 minutes of exposure to
blood. (scale bar = 10 µm) • • • • • • • • • • • • • • • • • • • • • • • • • • • 123 Figure 59 . SEM micrograph of SR shunt surface after
15 minutes of exposure t o blood. (scale
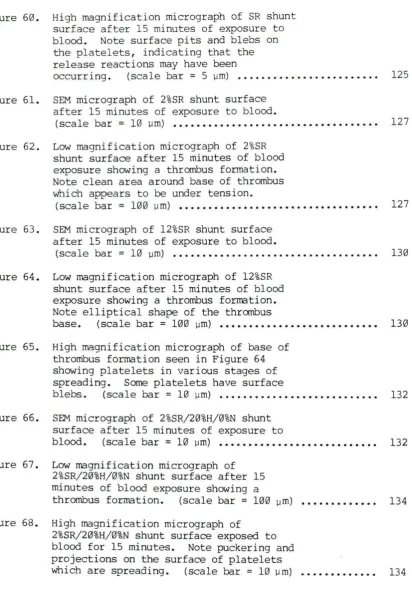
[image:10.570.43.479.60.681.2]Figure 60 . High magnification micr ograph of SR shunt surface after 15 minutes of exposure to blood. Note surface pits and bl ebs on the platelets, indicating that the release reactions may have been
occurring. (scale bar= 5 µm) .• •• ••• . • •• • • •• • • • • ••• •• 125 Figure 61. SEM micrograph of 2%SR shunt surface
after 15 minutes of exposure t o blood.
(scale bar = 10 µm) . •. . .••. •.• •.. .. ...•••••. ••• • • .. 127
Figure 62 . Low magnification micrograph of 2%SR shunt surf ace after 15 minutes of blood exposure showing a thrombus formation. Note clean area around base of thrombus which appears to be under tension.
(scale bar= 100 µm) . ... .. .. .• . . . . •...• .. . ... ... . ... 127
Figure 63 . SEM micrograph of 12%SR shunt surface after 15 minutes of exposure to blood.
(scale bar = 10 µm) . . . 130 Figure 64 . Low magni fication microgr aph of 12%SR
shunt surface after 15 minutes of blood exposure showing a thrombus formation . Note elliptical shape of the thrombus
base. (scale bar= 100 µm) • ••• •• • ••• •• • ••• • •••••••••• 130 Figure 65. High magnification micrograph of base of
thrombus formation seen in Figure 64 showing platelets in various stages of spreading . Some platelets have surface
blebs. (scale bar = 10 µm) • • • • • • • • • • • • • . • • • • • • • • • • • • • 132 Figure 66 . SEM micrograph of 2%SR/20%H/0%N shunt
surface after 15 minutes of exposure t o
blood. (scale bar= 10 µm) •• • • •• •••••• • ••• • •••••••• • • 132 Figure 67 .
Figur e 68 .
Low magnification micrograph of 2%SR/20%H/0%N shunt surface after 15 minutes of blood exposure showing a
thrombus formation. (scale bar = 100 µm) High magnification micrograph of
2%SR/20%H/0%N shunt surf ace exposed to blood for 15 minutes. Note puckering and projections on the surface of platelets which are spreading . (scal e bar = 10 µm)
134
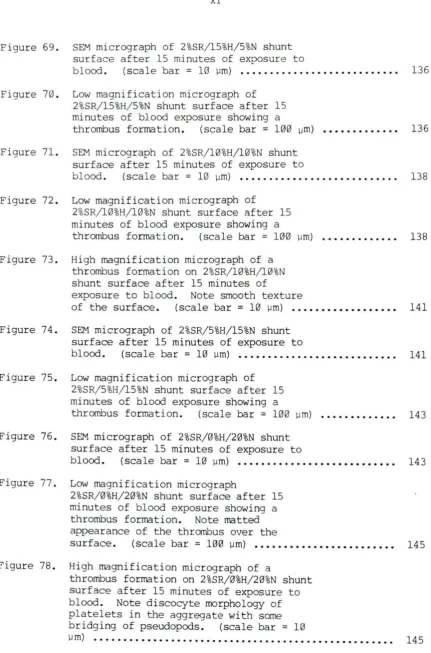
[image:11.565.48.481.42.667.2] [image:11.565.66.479.71.664.2]Figure 69 . SEM micrograph of 2%SR/ 15%H/ 5%N shunt surface aft er 15 minutes of exposure to
blood. (scale bar = 10 µm) . • • • • • • • • • . • . • • • • • • • . • . • • . . 136 Figure 70 . Low magnification micrograph of
2%SR/15%H/5%N shunt surface after 15 minutes of blood exposure showing a thrombus formation. (scale bar = 100 µm) Figure 71 . SEM micrograph of 2%SR/10%H/ 10%N shunt
surface after 15 minutes of exposure t o
136
blood. (scale bar = 10 µm) • • • • • • • • • • • • • • • • • • • • • • . • • • • 138 Figure 72. Low magnification micrograph of
2%SR/10%H/ 10%N shunt surface after 15 minutes of blood exposure showing a
thrombus formation. (scale bar= 100 µm) •• ••••• • •..•• 138 Figure 73 . High magnification micrograph of a
thrombus formation on 2%SR/ 10%H/10%N shunt surface after 15 minutes of
exposure to blood. Note smooth texture
of the surface. (scale bar = 10 µm) . •• •• •••••••• ••••• 141 Figure 74 . SEM micrograph of 2%SR/5%H/ 15%N shunt
surface after 15 minutes of exposure to
blood. (scale bar = 10 µm) . • • • • • . . . • • • • • . • • • . • • • • • • • • 141 Figure 75 . Low magnification micrograph of
2%SR/ 5%H/ 15%N shunt surface after 15 minutes of blood exposure showing a thrombus formation. (scale bar = 100 µm) Figure 76. SEM micrograph of 2%SR/0%H/20%N shunt
surface aft er 15 minutes of exposure to
143
blood . (scale bar= 10 µm) •••• •• •• •••• •••••••• • •••••. 143 Figure 77 . Low magnification micrograph
2%SR/ 0%H/ 20%N shunt surf ace after 15 minutes of blood exposure showing a thrombus formation. Note matted appearance of the thrombus over the
surface. (scale bar= 100 µm) • •• •••••••••••••••••.••• 145 Figure 78. High magnification micrograph of a
thrombus formation on 2%SR/0%H/ 20%N shunt surface after 15 minutes of exposure to blood. Note discocyte morphology of platelets in the aggregate with some bridging of pseudopods. (scale bar = 10
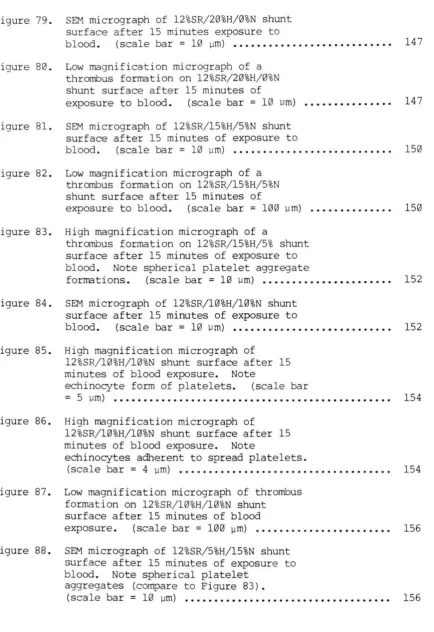
[image:12.563.44.476.41.695.2]Figure 79 . SEM micrograph of 12%SR/20%H/0%N shunt surface after 15 minutes exposure to
blood . (scale bar = 10 µm) • • • • • • . • • • • • • • • • • • • • • . • . • • • 147 Figure 80 . Low magnificati on micrograph of a
thrombus formation on 12%SR/20%H/0%N shunt surf ace after 15 minutes of
exposure to blood. (scale bar= 10 µm) ••••••••••••••• 147 Figure 81 . SEM micrograph of 12%SR/15%H/ 5%N shunt
surface after 15 minutes of exposure t o
blood. (scale bar = 10 µm) • . • • • • • • • . • • . • • • • . • • • • • • • • • 150 Figure 82 . Low magni fication micrograph of a
thrcxnbus formati on on 12%SR/15%H/ 5%N shunt surface after 15 minutes of
exposure t o blood. (scale bar = 100 µm) Figure 83 . High magnification micrograph of a
thrcxnbus formation on 12%SR/ 15%H/5% shunt sur face after 15 minutes of exposure t o blood. Not e spherical platelet aggregate
150
formations . (scale bar= 10 µm) •••• • •• •• ••••• •• •••••• 152 Figure 84. SEM microgr aph of 12%SR/ 10%H/10%N shunt
surface after 15 minutes of exposure t o
blood. (scale bar = 10 µm) • • • • • • • • • • • . • . • • • • • • • • . . • • • 152 Figure 85 . High magnification micrograph of
12%SR/10%H/10%N shunt surface after 15 minutes of blood exposure. Note
echinocyt e form of platelets. (scale bar
= 5 µm) •••• • ••••••••••••••• •• •••• • •••••••••••••••••••• 154 Figure 86. High magnification micr ograph of
12%SR/ 10%H/ 10%N shunt surface after 15 minutes of blood exposure. Note
echinocytes adherent to spread platelets .
(scale ba.r = 4 µm) . • • • . . . . • • • • . • • . • • . • • • • . . . • . . . . • • • . • 154
Figure 87. Low magnification micrograph of thrombus formati on on 12%SR/10%H/ 10%N shunt
surface after 15 minutes of blood
exposure. (scale bar= 100 µrn) • •.••.••.• ••••••• ••••• • 156 Figur e 88 . SEM micr ograph of 12%SR/5%H/15%N shunt
surface after 15 minutes of exposure to blood. Note spherical platelet
aggregates (compare to Figure 83) .
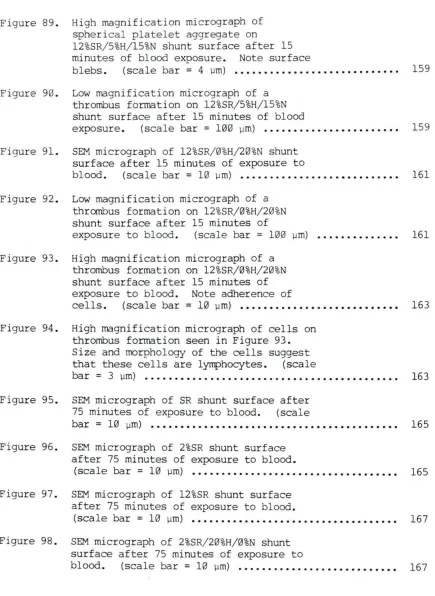
[image:13.563.43.489.63.698.2] [image:13.563.49.484.70.703.2]Figure 89 . High magnification micrograph of spherical platelet aggregate on
12%SR/ 5%H/ 15%N shunt sur face after 15 minutes of blood exposure. Note surface
blebs. (scale bar = 4 µm) • • • • • • • • • • • • • • • • . • • • • • • • • • • . 159 Figure 90. Low magnifi cation micrograph of a
thrombus f ormation on 12%SR/ 5%H/ 15%N shunt surface after 15 minutes of blood
exposure . (scale bar= 100 µm) .••• •••• •• • •••••• •• .••• 159 Figure 91 . SEM micrograph of 12%SR/ 0%H/20%N shunt
surface after 15 minutes of exposure t o
blood. (scale bar = 10 µm) . • . . • • • • • • . • . • . . . • • . • • • • • • • 161 Figure 92. Low magnification micrograph of a
thrombus formation on 12%SR/0%H/20%N shunt surface aft er 15 minutes of
exposur e to blood. (scale bar = 100 µm) Figure 93 . High magnification micrograph of a
thrombus formation on 12%SR/ 0%H/20%N shunt surf ace after 15 minutes of expos ur e to blood. Note adherence of
161
cells. (scale bar= 10 µm) ••••••••••••••••••••••••••• 163 Figure 94 . High magnification micrograph of cells on
thrombus formati on seen in Figure 93. Size and morphology of the cells suggest that these cells are lyrrphocytes . (scale
bar = 3 µ·m) . . . . • . • • . . . • . . . . . . . • • . . . . . 163
Figure 95. SEM micrograph of SR shunt surface after 75 minutes of exposure to blood. (scale
bar= 10 µm) • •••• •• ••• •••• ••••••.••••••••••••••• •• •••• 165 Figur e 96. SEM micr ograph of 2%SR shunt surface
after 75 minutes of exposure to blood.
(scale bar = 10 µm) . . . 165 Figure 97 . SEM micrograph of 12%SR shunt surface
after 75 minutes of exposure t o blood.
(scale bar= 10 µm) .•.. . .•.... . ... .. ... ... 167
Figure 98 . SEM micrograph of 2%SR/ 20%H/0%N shunt surface after 75 minutes of exposure t o
[image:14.562.44.479.67.663.2] [image:14.562.46.473.78.655.2]Figure 99 . SEM micrograph of 2%SR/ 15%H/ 5%N shunt surface after 75 minutes of exposure to
blood. (scale bar = 10 µm) • • • • • • • • • • • • • • • • • • • • • • • • • • • 170 Figure 100. SEM micrograph of 2%SR/ 10%H/ 10%N shunt
surface after 75 minutes of exposure to
blood. (scale bar = 10 µm) • • • • • • • • • • • • • • • • • • • • • • . • • • 170 Figure 101. SEM micrograph of 2%SR/ 5%H/ 15%N shunt
surface after 75 minutes of exposure to
blood. (scale bar= 10 µm) ••••••••••••••••••.••••••• 172 Figure 102. SEM micrograph of 2%SR/ 0%H/ 20%N shunt
surface after 75 minutes of exposure to
blood. (scale bar= 10 µm) .• ••••• •• • •••••••••• • •• • •• 172 Figure 103. SEM micrograph of 12%SR/ 20%H/ 0%N shunt
surface after 75 minutes of exposure to
blood. (scale bar= 10 µm) •••••••••••••••••••••••••• 174 Figure 104. SEM micrograph of 12%SR/ 15%H/ 5%N shunt
surface after 75 minutes of exposure to
blood. (scale bar = 10 µm) • • • • • • • • • • • • • • • • • • . • • • • • • • 174 Figure 105. SEM micrograph of 12%SR/ 10%H/ 10%N shunt
surface after 75 minutes of exposure to blood. Red blood cells are seen
entrapped in a fibrin network. (scale
bar= 10 µm) ••••••••• ••• •• • •••••••••••• •• •••••••••••• 176 Figure 106. SEM micrograph of 12%SR/5%H/ 15%N shunt
surface after 75 minutes of exposure to blood. Clot was flushed fran the tube.
(scale bar = 10 µm) •••••••.•••••••••••••••••.•••.•••• 176
Figure 107. SEM micrograph of 12%SR/ 0%H/ 20%N shunt surface after 75 minutes of exposure t o blood. Surface has red blood cells and some fibrin strands (compare to Figure 105). Clot was flushed form the tube.
(scale bar= 10 µm) ...•...••• •. •.. ••••• ••.•.•... 178
Figure 108. Absorbance spectrum of spectrally
subtracted SR shunt after 0.25 minute of
exposure to blood . . . 207
Figure 109. Absorbance spectrum of spectrally
subtracted SR shunt after 0.50 minute of
Figure 110. Absorbance spectrum of spectrally subtracted SR shunt after 5 minutes of
exposure to bloOO . . . 208
Figure 111. Absorbance spectrum of spectrally
subtracted SR shunt after 15 minutes of
exposure to blood • . • • . • • • • • • • • • • • • . • • • • • • • • • • • • • . • • • • 208 Figur e 112. Absorbance spectrum of spectrally
subtracted SR shunt after 75 minutes of
exposure t o bloOO . . . • • . . • . . . . 2 0 9
Figure 113. Absorbance spectrum of unexposed SR shunt after subtraction of saline and
water vapor . . . 209
Figure 114 . Absorbance spectrum of spectrally
subtracted 2%SR shunt after 0. 25 minute
of exposure to bloOO . . . 210
Figure 115. Absorbance spectrum of spectrally
subtracted 2%SR shunt after 0. 50 minute
of exposure to blocx:l . . . 210
Figure 116. Absorbance spectrum of spectrally
subtracted 2%SR shunt after 5 minutes of
exposure to blood ...••....•....•••••..••••••••.••.. 211
Figure 117. Absorbance spectrum of spectrally subtracted 2%SR shunt after 15 minutes
of exposure to bloOO . . . 211
Figure 118. Absorbance spectrum of spectrally subtracted 2%SR shunt after 75 minutes
of exposure to bloOO . . . 212
Figure 119. Absorbance spectrum of unexposed 2%SR shunt after subtraction of saline and
water vapor . . . 212
Figure 120. Absorbance spectrum of spectrally
subtracted 12%SR shunt after 0. 25 minute
of exposure to blood •...••..•....•••••••••...•. 213
Figure 121. Absorbance spectrum of spectrally
subtracted 12%SR shunt after 0. 50 minute
Figure 122. Absorbance spectrum of spectrally subtracted 12%SR shunt after 5 minutes
of exposure to blood . . . 214
Figure 123. Absorbance spectrum of spectrally
subtracted 12%SR shunt after 15 minutes
of exposure to blood • • • • • . • • • • • • • • • • • • • • • • • • • • • • • • • • • 214 Figure 124. Absorbance spectrum of spectrally
subtracted 12%SR shunt after 75 minutes
of exposure to blood ••••••• • •• • ••••••• • ••• • • • •••••.•• 215 Figure 125. Absorbance spectrum of unexposed 12%SR
shunt aft er subtraction of saline and
water vapor . . . • . . . • . . . • . . 215 Figure 126. Absorbance spectrum of spectrally
subtracted 2%SR/ 20%H/ 0%N shunt after
0. 25 minute of exposure to blood • •• • ••••••••• • •• • •. • . 216 Figure 127. Absorbance spectrum of spectrally
subtr acted 2%SR/ 20%H/ 0%N shunt after
0. 50 minute of exposure to blood ••• •• • • •••••••••••••• 216 Figure 128. Absorbance spect rum of spectrally
subtracted 2%SR/20%H/0%N shunt after 5
minutes of exposure to blood ••• • ••••••• • •••••••••••• • 217 Figure 129. Absorbance spectrum of spectrally
subtracted 2%SR/ 20%H/ 0%N shunt after 15
minutes of exposure to blood • • •••••••••••••••••••• • •• 217 Figure 130. Absorbance spectrum of spectrally
subtracted 2%SR/ 20%H/ 0%N shunt after 75
minutes of exposure t o blood • •• • • •• ••••••••••• •• •• • •• 218 Figure 131. Absorbance spectrum of unexposed
2%SR/ 20%H/ 0%N shunt after subtraction of
saline and water vapor ... • .. • ...• . ... 218
Figure 132. Absorbance spectrum of spectrally subtracted 2%SR/ 15%H/ 5%N shunt after
0. 25 minute of exposure to blood •••••••• • •••••••••••• 219 Figure 133 . Absorbance spectrum of spectrally
subtracted 2%SR/ 15%H/ 5%N shunt after
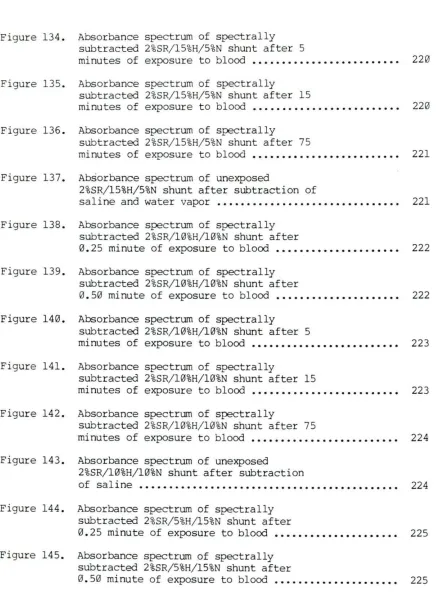
Figure 134. Absorbance spectrum of spectrally subtracted 2%SR/15%H/5%N shunt after 5
minutes of exposure to blood ••••••••••••••••••••••••• 220 Figure 135. Absorbance spectrum of spectrally
subtracted 2%SR/ 15%H/ 5%N shunt after 15
minutes of exposure to blood ••.••••••• • •••••••• • ••••• 220 Figure 136 . Absorbance spectrum of spectrally
subtracted 2%SR/ 15%H/ 5%N shunt after 75
minutes of exposure t o blood •• • •••••.• • •••••••••••••• 221 Figure 137. Absorbance spectrum of unexposed
2%SR/ 15%H/ 5%N shunt aft er subt raction of
saline and water vapor • •.•••••••••••••••.•••••••••••• 221 Figure 138. Absorbance spectrum of spectrally
subtracted 2%SR/10%H/ 10%N shunt after
0. 25 minute of exposure to blood • • •• • •••••••••••••••• 222 Figure 139. Absorbance spectrum of spectrally
subtracted 2%SR/ 10%H/ 10%N shunt after
0. 50 minute of exposure to blood ••••••••••••••••••••• 222 Fi gure 140. Absorbance spectr um of spectrally
subtr acted 2%SR/ 10%H/10%N shunt after 5
minutes of exposure to blood ••••••••••••••••••••••••• 223 Figure 141. Absorbance spectrum of spectrally
subtr acted 2%SR/ 10%H/ 10%N shunt after 15
minutes of exposure to blood ••••••••••••••••• • ••••••• 223 Figure 142. Absorbance spectrum of spectrally
subtracted 2%SR/ 10%H/ 10%N shunt after 75
minutes of exposure to blood •••••• • ••• • •••••••• • ••••• 224 Figure 143. Absor bance spectrum of unexposed
2%SR/ 10%H/ 10%N shunt after subtraction
of sali ne . . . 224
Figure 144 . Absorbance spectrum of spectrally subtracted 2%SR/5%H/ 15%N shunt after
0. 25 minute of exposure to blood ••••••••••••••• • •• • •• 225 Figure 145. Absorbance spectrum of spectrally
subtracted 2%SR/5%H/15%N shunt after
[image:18.562.46.483.59.659.2]Figure 146. Absorbance spectrum of spectrally subtracted 2%SR/ 5%H/ 15%N shunt after 5
minutes of exposure t o blood ••••••••.••• • ••••••••••.• 226 Figure 147. Absorbance spectrum of spectrally
subtracted 2%SR/ 5%H/ 15%N shunt after 15
minutes of exposure to blood •••• • •••• •• •••••••••••• •• 226 Figure 148. Absorbance spectrum of spectrally
subtracted 2%SR/5%H/ 15%N shunt after 75
minutes of exposure to blood .•• •••• .•••••••••••••••.• 227 Figure 149. Absor bance spectrum of unexposed
2%SR/ 5%H/ 15%N shunt after subtraction of
saline and water vapor •• • ••••..••.•••••.••••••••••••• 227 Figure 150 . Absor bance spect rum of spectrally
subt racted 2%SR/ 0%H/ 20%N shunt after
0. 25 minut e of exposure to blood ••••••••••••••••••••• 228 Figure 151. Absorbance spectrum of spectrally
subtr acted 2%SR/ 0%H/ 20%N shunt after
0. 50 mi nute of exposur e to blood ••••••••••.•••••••••• 228 Fi gure 152 . Absor bance spectrum of spectra lly
subt racted 2%SR/0%H/20%N shunt after 5
minutes of exposure to blood • • • • ••• • •••••• • •••••••••• 229 Figure 153. Absorbance spectrum of spectr ally
subtracted 2%SR/0%H/ 20%N shunt after 15
minutes of exposure t o blood .•••••••••••••••••••••••• 229 Figure 154. Absorbance spectrum of spect rally
subtr acted 2%SR/ 0%H/ 20%N shunt after 75
minut es of exposure to blood ••••••••••••••••••••••••• 230 Figure 155. Absorbance spectrum of unexposed
2%SR/0%H/ 20%N shunt after subtraction of
saline . . . 230
Figure 156. Absor bance spectrum of spectrally subtracted 12%SR/20%H/ 0%N shunt after
0. 25 minut e of exposure to blood • ••••••••••••••••••• • 231 Figure 157. Absorbance spectrum of spectrally
subtracted 12%SR/20%H/0%N shunt after
[image:19.565.49.481.60.657.2]Figure 158. Absorbance spectrum of spectrally
subtracted 12%SR/20%H/ 0%N shunt after 5
minutes of exposure t o blood •••••.••.•••••••••••••••• 232 Figure 159. Absorbance spectrum of spectrally
subtracted 12%SR/20%H/0%N shunt after 15
minutes of exposure t o blood •••••••••••••••••••••••.• 232 Figur e 160. Absorbance spectrum of spectrally
subtracted 12%SR/20%H/0%N shunt after 75
minutes of exposure t o blood ••.•••••.•••••••••••••••• 233 Figur e 161. Absorbance spectrum of unexposed
12%SR/20%H/ 0%N shunt after subtraction
of saline and water vapor •••••..••• •• •• . • •••••••••••• 233 Figur e 162. Absorbance spectrum of spectrally
subtracted 12%SR/15%H/5%N shunt after
0. 25 minute of exposure to blood •••••• ••••••••••••••• 234 Figure 163. Absorbance spectrum of spectrally
subtracted 12%SR/ 15%H/ 5%N shunt after
0. 50 minute of exposure to blood ••••.•••••••••••••••• 234 Figure 164 . Absorbance spectrum of spectrally
subtracted 12%SR/ 15%H/5%N shunt after 5
minutes of exposure to blood ••••.•••••••••••••••••••• 235 Figure 165. Absorbance spectrum of spectr ally
subtracted 12%SR/15%H/5%N shunt after 15
minutes of exposure to blood .••••• • • •• .•• •••••• •• •••• 235 Figure 166. Absorbance spectrum of spectrally
subtract ed 12%SR/15%H/ 5%N shunt after 75
minutes of exposure to blood ••••• • ••• •• •••••••••••••• 236 Figure 167. Absorbance spectrum of unexposed
12%SR/15%H/5%N shunt after subtraction
of saline and wate r vapor •••• •• • • ••••••••••••••••..•• 236 Figure 168. Absorbance spectrum of spectrally
subtracted 12%SR/10%H/ 10%N shunt after
0. 25 mi nute of exposure to blood •• ••••••••••• ••••• • •• 237 Figur e 169. Absorbance spectrum of spectrally
subtracted 12%SR/ 10%H/10%N shunt after
[image:20.568.46.480.53.690.2]Figure 170. Absorbance spectrum of spectrally
subtrac ted 12%SR/10%H/10%N shunt after 5
minutes of exposure to blood •• ••••••• • •••••••••••••• • 238 Figure 171. Absorbance spectrum of spectrally
subtracted 12%SR/10%H/ 10%N shunt after
15 minutes of exposure to blood • •••• •• ••••••••••••••• 238 Figure 172 . Absorbance spectrum of spectrally
subtracted 12%SR/ 10%H/ 10%N shunt after
75 minutes of exposure t o blood ••••.••••••••••••••••• 239 Figure 173. Abs orbance spectrum of unexposed
12%SR/ 10%H/ 10%N shunt after subtraction
of saline and water vapor •• ••••••• ••••••••••••••••.•• 239 Figure 174. Absorbance spectrum of spectrally
subtracted 12%SR/ 5%H/ 15%N shunt after
0. 25 minute of e xposure to blood ••••••••••••••••••••• 240 Figure 175. Absorbance spectrum of spectrally
subtracted 12%SR/ 5%H/15%N shunt after
0. 50 minute of exposure to blood ••••••••••••••••••••• 240 Figure 176. Absorbance spectrum of spectrally
subtracted 12%SR/ 5%H/ 15%N shunt after 5
minutes of exposure to blood •• •••• • ••••• • •• • ••••••• • • 241 Figure 177. Abs orbance spectrum of spectrally
subtracted 12%SR/5%H/ 15%N shunt after 15
minutes of exposure to blood •.••••••••••••••••••••••• 241 Figure 178. Absorbance spectrum of spectrally
subtracted 12%SR/ 5%H/15%N shunt after 75
minutes of exposure to blood •• • ••••••••••••• • •••••••• 242 Figure 179. Absorbance spectrum of unexposed
12%SR/ 5%H/15%N shunt after subtraction
of saline . . . 242
Figure 180. Absorbance spectrum of spectrally subtracted 12%SR/0%H/20%N shunt after
0. 25 minute of exposure to blood ••••••••••••••• • ••••• 243 Figure 181. Absorbance spectrum of spectrally
subtracted 12%SR/ 0%H/ 20%N shunt after
[image:21.575.44.480.61.676.2] [image:21.575.54.478.75.667.2]Figure 182. Absorbance spectrum of spectrally
subtracted 12%SR/ 0%H/ 20%N shunt after 5
minutes of exposure to blood •••• • •• •• •••••••• • ••••• • • 244 Figure 183. Absorbance spectrum of spectrally
subtracted 12%SR/ 0%H/ 20%N shunt after 15
minutes of exposure to blood •••.••••••••••• • ••••••••• 244 Figure 184 . Absor bance spectrum of spectrally
subtracted 12%SR/ 0%H/ 20%N shunt after 75
minutes of exposure to blood •••• • ••• • •• • •••• • •••••••• 245 Figure 185. Absorbance spectrum of unexposed
12%SR/ 0%H/ 20%N shunt after subtraction
[image:22.566.45.496.84.271.2]DEDICATION
To
INTRODUCTION
The search for nonthranbogenic biomaterials for cardiovascular use has been extensive. It will continue since all biomaterials studied to date are in some degree thrombogenic. Some materials , such as Dacron, show good results in large diameter applications, but the need for an off-the-shelf
type implant with an inner diameter of 6 nm or less still exists. This
work describes aspects of compatibility for hydrogel coatings applied to a widely used implant material, silicone rubber . Silicone rubber is used frequently as a catheter material, and is a material of interest for potential tubular prosthesis applications.
Proteins in the blood are rapidly deposited onto a bianaterial as a 0
layer approximately 100 to 300 A thick. It is generally accepted that it is the nature of this protein layer that determines the thranbogenic character of that biomaterial . Biomaterials research has resulted in finding of a number of surface parameters that influence the protein reaction with that surface. These parameters include texture (micro and macro) , wettability, critical surface tension , ionic charge, irrmunologic response , structural strength, flexibility , and chemical stability. Adsorption of proteins may also be determined by the plasma components themselves. In general, it is not a single parameter that determines the suitability of a material , but a complex interrelation among many
parameters , including the plasma components .
concentration of diatanacious silica filler were tested by using an ex vi vo shunt system in mongr el dogs t o study composites of the silicone rubber substrates and hydrogel . Five formulations of HEMA
LITERATURE REVIEW
Blood-Surface Interactions
General
When a material is placed in contact with blood , many events occur as a r esult. The sequence of events appears to be the following :
1. Adsorption of plasma proteins,
2 . Adhesion of platelets and l eukocytes ,
3. Activation of adhered platelets leading to the release reaction,
4. Recruitment of nea rby platelets by the released pr oducts such as adenos ine diphosphate (ADP) and thromboxane A2 ,
5. Aggregation of recruited platelets upon the layer of adhered
platelets with eventual formation of a mural thrombus (Lindsay et al. , 1980) .
Some components of blood
a r esult of a complex cascade of reactions leading to a clot. Globulin and fibrinogen are glycopr otei ns , whereas albumin is not (Lee and Kim, 1974b) . A glycopr otein is a pr otein that has branches of oli gosaccharide chains.
In addition t o t he plasma proteins, blood contains many types of formed blood elements of which the platelet is important in thranbus fornation . Platelets are multifunctional cells in terms of their
intercellular reactions and their contributions to different biological proces ses (Gordon and Milner, 1976) . The fornati on of platelets is a
process called thrombopoiesis (Bloom and Fawcett, 1975, p . 221) . Platelet s are formed as a result of fragments of megakaryocyt e cytoplasm being
pinched off (Gordon and Milner, 1976) . They have a functional life of about ten days , with about 2/3 of the total number circulating and 1/3 seques t ered in the spleen (Robbins et al ., 1981) . On the basis of light micr oscope obser vations , platelets have been divided into two histological regions . A thick central dark staining region containing small granules is called the granulomere or chromomere. The thin peripherial zone is called the hyalornere (Bloom and Fawcett, 1975 , p. 140) . With the development of electr on microscopy, the anatomic features of platelets have been divided into three functional zones. These zones were suggested on the assurrption that the structure and function of platelets are similar to that of other types of cells (Caen et al., 1977 , p. 10) .
The sol- gel zone consists of several filamentous systems i n the
internal part of the plat elet. This zone invol ves the cellular skeleton t o maintain the shape of the platelet and the contractile system which
participat es in the release r eactions and aggregation processes.
The or ganelle zone consists of mitochondria and gr anules. This zone serves in rretabolic functions and the storage of products released during the release reactions . Glycogen is also found in this zone. The granules are divided between the a- gr anules which contain cati onic proteins ,
fibrinogen , and other prot ei ns and the dense granules whi ch conta i n ADP , adenosine triphosphate (ATP) , 5-hydroxytryptamine (serotonin ) , and Ca++ .
The primary funct i on of platelets is t o form a plug or patch on small defects in the endothelial lining of blood vessels so as to limit the amount of hemorrhage, and lat er to initiate the repair of the defect.
Adsorption of plasma proteins
The adsorption of plasma prot eins onto a surface of a material happens very quickly , possibly within 3 seconds (Br uck , 1977). The amount of
prot e in adsorbed i s small , in the range of 0. 2 t o 2 µg/cm2 (Horbett and Hoffman, 1975; Watkins and Robertson, 1977) . It i s generally r ecognized t hat the composition of the protein layer has a major influence on
are altered to sane degr ee so that the clotting cascade is i nitiated. This leads to activation of thranbin which is a potent stimulator of the release reacti ons. These r eactions then lead to platelet adhesion and aggregation
(Gordon and Milner , 1976) . Bagnall (1977) and Hoffman (1974) describe how the protein is altered. In general , the protein configuration can be altered by following the ' like dissolves like ' rule of thumb (Morrison and Boyd, 1973, p. 31) . A protein in its native form in an aqueous enviranent will be globular (Curtis , 1975, p. 74) . The globular shape is due to the tertiary structure of the pr otein, and loss of this stucture is known as denaturation. To maintain this shape, the ' surface' of the protein will have ionic- , hydrogen- , and polar- bonding- capable side groups of the amino acids making up the backbone of the protein oriented outward. These gr oups will interact or 'dissolve ' into the polar and ionic aqueous
envir onm:nt . The i nne r ' core ' of the protein will then be shielded from the aqueous environment by the ' surface ', allowing the hydrophobic side groups to interact or "dissolve" into each other . This helps t o hold the shape of the prote in, and the shape is further stabilized by crosslink bonds .
easily into the hydrophilic surface of the implant material being tested. It would also be expected that a hydrophilic surface will desorb proteins easily whereas proteins denatured on a hydrophobic surface will not be so easily given up. This has been found to be generally true as reported by Hoffman (1974) .
Adhesion of platelets
Another model describing the important influence of the protein layer on subsequent interaction with platelets is presented by Kim et al .
(1974) and Lee and Kim (1974b) . This model or mechanism describes a reaction between glycosyl transferases (enzymes) on the platelet manbrane with glycoproteins adsorbed onto the surface of a foreign material. The
reaction between the enzyme and the glycoprotein results in the formation of a glycosidic linkages or complexes. The stability of these canplexes determines the strength and duration of the adhesion. A similar model is
proposed by Roseman (1970) for the phenanena of platelet aggregation.
It would be expected that a surface with mostly albumin character, either through pre-coating or selective adsorption, would be more
thranboresistant than a surface with mostly glycoprotein character . This has been shown by many investigators who have suggested that the
Activation and the release reactions
Once a platelet has become adhered to a surface, activation of the platelet occurs. The activation stage of a platelet is a complex series of biochemical reactions which result in the release reactions. The processes
involved are not fully understood , but some mechanisms have been f ound (Gordon and Milner, 1976) .
The reaction is i nitiated by a release-induc ing agent which binds t o a specific r ecognition site on the cell menbrane. Stimuli which are capable of this include: (1) adhesion to surfaces such as collagen f i brils , and possibly glycoproteins, (2) platelet-platel et contact, (3) irrmune reactions at t he platelet membrane surface, (4) ADP , (5) adrenalin, (6) thranbin and other proteolytic enzymes such as trypsin and papain, and (7) divalent cation ionophores. These stimuli are capable of causing local changes in the ionic distribution of Ca++ at the menbrane surface as a result of binding to the recognition site. This change in ioni c distribution
stimulates the formation of cyclic guanosine 3' ,5'-monophosphate (cGMP ),
and inhibits the fonnation of cyclic adenosine 3 ', 5 '-monophosphate (cAMP), thus altering the cyclic AMP/GMP ratio. The resulting decr ease i n cAMP activates the contractile protein system which causes intracellular changes
leading t o formation. of pseudopods and fusion of storage granules (a-and/ or dense) with the surface connected tubular system (open channel system) . The granule contents are then rapidly extruded through the channel system t o the cell surface. The energy requirements for these processes are considerable. Platelets metabolize glycogen and
platelets respond by increasing the activity of both the glycolyti c pat hway and the Krebs cycle, possibly so that these energy requirements can be met
(Macintyre, 1976) .
Activation of the platelet results in Release Reaction I, where the contents of the dense granules are released locally. Any aggregation t hat would occur at this stage would be reversible . This is followed by Release Reaction II, where the contents of the a- granules are released.
Aggregation at this stage is irreversible. This is followed by Consolidation, or forming a firm platelet plug by contraction. This contraction is mediated by the contractile protein, actanyosin
(thrombosthenin) (Robbins et al ., 1981).
It has been demonstrated that ADP causes alrrost irrrnediate platelet aggregation, and the concentration needed is very small, being on the order of 100 nanograms per ml of plasma. The mechanism by which ADP induces aggregation seems to require the presence of a certain type of protein or proteins on the surface of the platelet, and divalent cations such as Ca++. Considerable evidence suggests that fibrinogen, or some closely related subtance, is the protein that participates in this mechanism. It is
bel ieved that the action of thrombin converts the fibrinogen on the surface of the platelets to fibrin, which then binds the platelets together
(fibrinogen is converted to a fibrin rronorrer and then t o a fibrin polymer in the presence of Factor XIII, fibrin stabilizing factor ) (Medway et al ., 1969 , p . 252) . Using the present techniques of electr on microscopy, it would be difficult to detect the polymerized fibrin in t he rnonaner state. However, a rrethod using ferritin- conjugated anti- fibrin/ fibrinogen
platelet aggregates (Shirasawa et al ., 1972 ) . These findings indicated that fibrinogen released from within the platelets contributed to the structural bonds between platelets in the aggregate. Also , a dense layer of fibrin has been shown to be present on the outer surfaces of platelet aggregates formed in response to thrombin (Cooper et al. , 1976) .
Once a plug is stable, factors are released from the platelets which are chemotactic to neutrophils, which are themselves chemotactic, and macrophages are attracted so cleanup of the fibrin and debris can occur. Thus, the process of thrombosis induces the processes of inflammation and repair (Thomson, 1984).
Characterization of Adsorbed Proteins
General
It is generally accepted that the proteins adsorbed onto the surface of a material have a major influence on its thranbogenesis. Watkins and Robertson (1977) have outlined three areas that must be considered when studying the adsorption process. These areas are: 1) the types and amounts of proteins adsorbed by the surface; 2) the kinetics of the adsorption process ; and 3) the extent of fluid flow, as well as the presence of cellular elements such as red blood cells, on the adsorption process.
1975). A second m:thod involves the elution of the adsorbed proteins, followed by electrophoresis (Lyman et al., 1974). A third rrethod uses radiolabeling techniques for a protein of interest, and correlates its activity in response to a surface by use of a gamna counter (Weathersby et al., 1977). A fourth method involves spectroscopic examination of the adsorbed protein layer. This can be accomplished with total internal
reflection devices designed for infrared, ultraviolet, and visible (from fluoresence) electranagnetic radiation (National Institutes of Health, 1979, p. 48).
Each of these rrethods has been employed for the study of protein adsorption. However, the information obtainable from spectroscopic
techniques puts this rrethod far ahead of the others. For example, the protein depletion technique lacks sensitivity for materials with inherently low specific surface areas, making it incapable of testing a large number of materials that fall into this catagory. The chemical techniques have been useful for the study of equilibrium adsorption, but not for kinetic or competitive adsorption behavior (Watkins and Robertson, 1977) . Also,
Brash and Lyman (1969 ) recognized the limitations of the protein
depletion and the elution techniques. They realized that when deal ing with biological systems , subtle changes such as denaturation of proteins
(possibly those in the clotting cascade) at the surface of a material may have a significant role in the thrcmbogenesis of that material . With these methods , changes like this could not be observed. They suggested that
infrared internal reflection spectroscopy may be a technique that provides a direct and sensitive examination of the surface-adsorbate complex . Using this system, they were able to measure the quantity of protein adsorbed as a function of solution concentration for various polymer substrates. Lee and Kim (1974a) were able to study adsorption isotherms and kinetics of single protein solutions using this technique, also. However, Brash and Lyman (1969) concluded from their experiments that proteins could not be distinguished from one another because the absorption bands of all pr oteins and peptides are identical. Thus, competitive studies of mixtures of
proteins or whole blood could not be made. Also, adsorbed water has absorption bands in the same regions as protein which leads to masking of information. Because of this, both research groups had to dry the samples in air before taking a spectrum.
These problems were inherent in the instrument used, and with the development of Fourier Transform Infrared Spectroscopy, in conjunction with attenuated total reflectance devices, it became possible to study the
Infr ared spectroscopy
There are many types of spectroscopic t echniques available for the study of molecules of which infrared spectr oscopy is one of the most important. Inf rar ed spectroscopy covers the electromagnetic radia tion range from about 13 , 300 an-1 to 10 cm-1 • This r egion is subdivided into several ranges of which the fundamental infrar ed r eg i on (5000 cm-1 to 400
an-1 ) is the most useful (Kendall , 1966 , p. 3) .
To understand how infrared radiation can be used t o generat e a spectrum first requires having an understanding of the nature of the
molecules t o be examined . The energy of a molecule can be expressed by the equation:
E(mol) = E(trans) + E(rot) + E(vib) + E(el) where, E(mol) =energy of the rrolecule
E( trans) = t r anslational energy E(rot)
=
r otational energy E(vib) = vi brational energyE(el) = electronic energy
E(tr ans) has no e f fect on molecular spectra so i t can be di s regarded . E(rot) is primarily obser ved in molecules that are able to rotate freely in the vapor state. In soli d or liquid conditions , molecular rotation is
those shared by more than two atoms. This energy variable is only
important when electrons are excited to energy levels that contribute to r otational or vibrational transitions. Infrared radiation is weak in terms of the energy required for these transitions, so the transitions normally do not occur. Thus, the above equation becorres (Kendall, 1966, p. 10):
E(mol)
=
E(vib)An infrared spectrum is obtained by forming a plot of the intensity of radiation leaving the sample corrpared to the intensity of the radiation going into the sample versus the energy of the radiation (usually rreasured
in units of wavenumbers, a:n-1 ). Classical electrodynamics specifies that
in order for a molecule to absorb radiation energy, it must possess a vibrational or rotational frequency that is the same as that of the
electranagnetic radiation, and a change in the magnitude and/ or direction of the dipole morrent must occur (Meloan, 1963, p. 67). Spectra rreasuring the quantity of a particular sample (or subsample) are normally plotted as absorbance versus wavenumber. This is done because the absorbance is proportional t o the concentration of the sample and the pathlength through which the radiation travels (Beer-Lambert law) (Adams et al., 1979,
p. 497).
The reason that the fundamental infrared region is the most useful is because the frequencies of the oscillations (vibrational or rotational ) of atoms in any molecule not at absolute tenperature are in the infrared region (oscillations on the order of 101~ to 1013 Hz, correspond to the
Fourier transform infrared spectroscopy
The generation of an infrared (IR) spectrum can be accanplished either
of two ways. The traditional method involves a dispersion instrument which contains a monochranator or dispersing element. In this instrument,
polychromatic radiation is separated into ' units ' of almost rnonochromatic radiation. This dispersed radiation is passed through the sample to the detector. The detector produces a signal that is proportional to the
intensity of the radiation striking it. Thus, this system is basically a series of radiometric measurerrents. A nonconventional approach is the Fourier Transform spect raneter (FTS) . In this system, no dispersion is needed. Instead, a Fourier transform operation is perforrred on the entire polychromatic signal to generate the intensity- frequency informati on. It should be noted that , although these two systems differ greatly in the method used to generate a spectrum, the end results are identical (Low, 1970) .
The FTS offers an advantage over the conventional dispersion
ratio of X, the FTS system could produce a spectrum with an increase in S/ N
of about 45X (based on~, where N equals the number of scans; Low, 1970).
FTS systems today have a dedicated digital computer which makes it possible to perform the Fourier transform accurately and economically. Since the data are digitized, mathematical operations can be performed with the data simply through use of appropriate software. Thus, the problems that Brash and Lyman (1969) expressed can be addressed and overcane. For example, adsorbed water can be spectrally subtracted out to reveal the information that was masked by its absorption bands. Also , since a better S/N ratio is obtainable in a satisfactory amount of time, characteristic absorption bands of a protein could be found so it would be possible to distinguish different proteins from each other. Conformational information could be assembled , and changes could be followed. By using carefully controlled experimental techniques, all of this information could be collected in real- time. This has been done by Gendreau et al. (1981) .
Internal reflection spectroscopy
When studying the spectroscopic characteristics of a molecule, problems sometimes arise. This is particularly apparent with solids. Forming a thin enough sample for transmission of the electranagnetic
radiation is sometimes not possible. This problem is overcome, however , by a procedure known as internal reflection spectroscopy. This procedure is based on the principle of total internal reflection. When total internal reflection occurs, the electromagnetic radiation does not stay in the