https://doi.org/10.5194/angeo-37-765-2019 © Author(s) 2019. This work is distributed under the Creative Commons Attribution 4.0 License.
Signatures of red-shifted foot points in the quiescent
coronal loop system
Yamini K. Rao1, Abhishek K. Srivastava1, Pradeep Kayshap2, and Bhola N. Dwivedi1 1Department of Physics, Indian Institute of Technology (BHU), Varanasi 221005, India
2Institute of Physics, University of South Bohemia, Branišovská 1760, 370 05 ˇCeské Budˇejovice, Czech Republic
Correspondence:Abhishek K. Srivastava ([email protected]) Received: 30 April 2019 – Discussion started: 9 May 2019
Accepted: 6 August 2019 – Published: 30 August 2019
Abstract.We observed quiescent coronal loops using multi-wavelength observations from the Atmospheric Imaging Assembly (AIA) aboard the Solar Dynamics Observatory (SDO) on 13 April 2016. The flows at the foot points of such loop systems are studied using spectral data from the Inter-face Region Imaging Spectrograph (IRIS). The Doppler ve-locity distributions at the foot points lying in the moss region show the negligible or small flows at the Ni I, Mg II k3, and C II line corresponding to upper photospheric and chromo-spheric emissions. Significant red shifts (downflows) rang-ing from 1 to 7 km s−1 are observed at Si IV (1393.78 Å; log(T /K)=4.8), which is found to be consistent with the existing results regarding dynamical loop systems and moss regions. Such downflows agree well with the impulsive heat-ing mechanism reported earlier.
1 Introduction
The active regions dominated by various loop structures are of significant importance for the study of coronal heating, since these loop systems act as a fundamental unit of the so-lar corona (Klimchuk, 2006; Reale, 2014; De Moortel and Browning, 2015). Moss is generally associated with plage regions around the active regions (Fletcher and De Pontieu, 1999), and transition region (TR) emission of hot core loops will provide us with a better understanding of the flows and thus the energy-transfer mechanism between the TR and corona.
Klimchuk (2006) provided a full review of the coronal heating problem. It describes how the coronal heating mech-anisms are impulsive when explored from the perspective of
elemental magnetic flux strands. It has also been well estab-lished that the loop structures emit significantly in the solar corona, which has been classified depending on their tem-peratures. The spectral studies of these loop systems in re-sponse to the Doppler shift provide a clue for distinguishing between the steady and impulsive heating mechanism (Del Zanna, 2008; Brooks et al., 2011).
Various types of loops are hot core loops (Del Zanna, 2008), warm loops (Del Zanna et al., 2011), fan loops (Young et al., 2012; Warren and Brooks, 2009, and refer-ences therein), and cool loops (Huang et al., 2015; Rao et al., 2019) present in the different regions of the solar atmosphere. The temperature and density diagnostics of quiescent coronal loops have been studied earlier to some extent (Del Zanna and Mason, 2003). However, there have not been many ob-servations regarding the flows in the resolved strands or flux tubes of such loops in the solar corona.
766 Y. K. Rao et al.: Doppler shifts in quiescent coronal loops
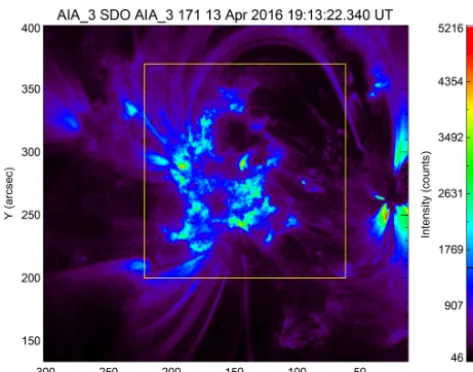
Figure 1.Intensity emission due to 171 Å wavelength of SDO–AIA at 19:13:22 UT. The yellow box is overlaid to show the region of in-terest (ROI) taken to analyze the flows at the foot points of quiescent coronal loops.
2 Observational data
The Interface Region Imaging Spectrograph (IRIS) provides spectral data in the two UV domains: the FUV band (1331.7 to 1358.4 Å and 1389.0 to 1407.0 Å) and NUV band (2782.7 to 2835.1 Å), with a large number of spectral lines cover-ing the photosphere, chromosphere, TR, and inner corona. Level 2 data are used for our study which are calibrated for the dark current removal and flat fielding effect (De Pon-tieu et al., 2014). We utilized Si IV (1393.78 Å), Mg II k (2796.20 Å), C II (1334.53 Å), and Ni I (2799.47 Å) spectral lines.
In our present work, we used dense raster data from IRIS for the time period 19:19:09 to 20:21:14 UTC on 13 April 2016, targeting the evolution of AR 12529 with a slit width of 0.35 in and a step cadence of 9.3 s, covering the field of view of 14100 in the x direction and 175 in in the
y direction and centered at the coordinates (Xcen, Ycen)=4 (-173 in, 275 in). The data are compensated for oscillations due to thermal variation using iris_orbitvarr_corr_l2.pro in the SSWIDL library. The rest wavelengths for different spec-tral lines used in our analysis are calibrated using neu-tral lines from the relatively quiet-Sun area of the raster. The rest wavelength of Ni I used is 2944.4697 Å. Mg II k was calibrated with respect to Ni I, which is found to be 2796.3574 Å. The Si IV line is calibrated with respect to the Fe I (1392.8052 Å) line, and C II is calibrated with respect to O I (1355.5987 Å). Thus, the calibrated wavelengths used for our analysis are 1393.7604 and 1334.5406 Å for Si IV and C II respectively.
The Doppler velocities are deduced using different spec-tral lines, i.e., Ni I 2799.47 Å, Mg II k 2796.20 Å, C II
the formation temperature of log(T /K)=4.2, 4.0, 4.3, and 4.8. The velocity resolution of IRIS is 1 km s−1(De Pontieu et al., 2014).
Si IV shows the characteristics of an optically thin line and is thus fitted with the single Gaussian curve, while Ni I is the absorption line and the inverse Gaussian curve is fitted. Mg II k and C II are fitted with single or double Gaussian, depending on their profile characteristics.
The corresponding SDO–AIA observations are also taken in the different filters covering the UV–EUV range, corre-sponding to a different temperature range in the solar at-mosphere. AIA provides full-disk multi-wavelength obser-vations of coronal lines, with a spatial resolution of 1.5 in, a pixel size of 0.6 in, and a temporal cadence of 12 s (Lemen et al., 2012).
The co-aligned Level 2 SDO–AIA data cube was used in which all the wavelengths are matched to the field of view of 1600 Å. To co-align with the raster images of Si IV (1393.78 Å), the near-time 171 Å image properly cross-correlated with 1600 Å was used to compensate for the differ-ent resolution of two instrumdiffer-ents. However, in our paper, we study the bulk plasma flows from the chosen moss region (in various boxes) by deducing the integrated spectral line pro-files of various IRIS lines. The plage regions are identified in SDO–AIA image data, and the location is mapped onto comparatively high-resolution IRIS data.
3 Observational results
Figure 1 shows the intensity emission of AR 12529, where the plage region and various loops anchored in the moss re-gion are visible in the 171 Å wavelength of SDO–AIA. The green emission predominantly indicates the highest emission representing the part of the moss region. The yellow box is overlaid to show the region of interest (ROI).
Figure 2.Mosaic representation of the zoomed-in view of the region of interest at different wavelengths of SDO–AIA, as mentioned in the corresponding panels.
[image:3.612.128.469.411.660.2]768 Y. K. Rao et al.: Doppler shifts in quiescent coronal loops
Figure 4.Differential emission measure maps of the plage region containing the moss associated to foot points of quiescent coronal loop systems.
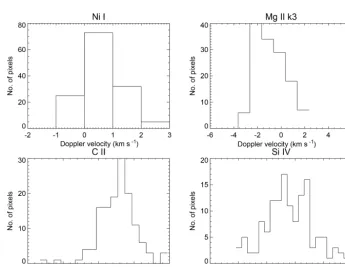
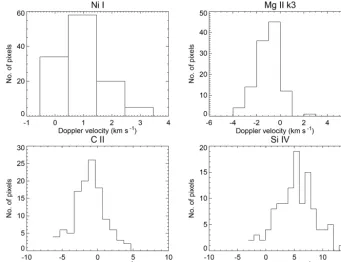
[image:4.612.129.467.421.661.2]Figure 6.The velocity distributions for different spectral lines corresponding to different temperatures at box B1.
[image:5.612.124.470.416.683.2]770 Y. K. Rao et al.: Doppler shifts in quiescent coronal loops
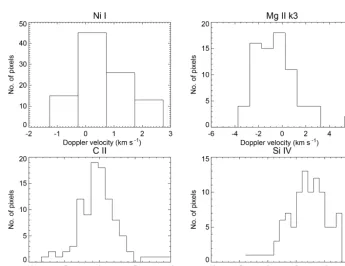
Figure 8.The velocity distributions for different spectral lines corresponding to different temperatures at box B3.
our analysis are not visible, since quiescent loops are domi-nated by emissions from the temperatures ranging from 0.7 to 1 MK, corresponding to SDO–AIA filters.
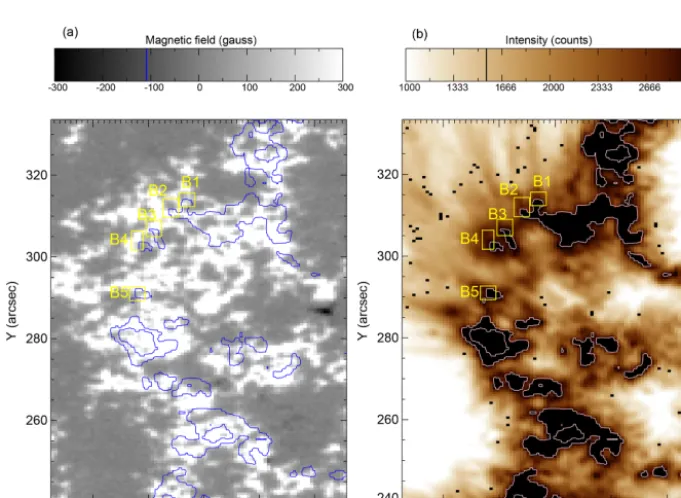
Figure 3a shows the line-of-sight magnetogram of the re-gion of interest (ROI) taken from the Helioseismic Magnetic Imager (HMI) aboard SDO (HMI/SDO), indicating the mag-netic polarities at the moss region as well as foot points of the quiescent coronal loops. Figure 3b is the emission of the 193 Å line, plotted in reverse color to identify the foot points. The different boxes of different sizes are then chosen around the foot points to cover the full strand of loop.
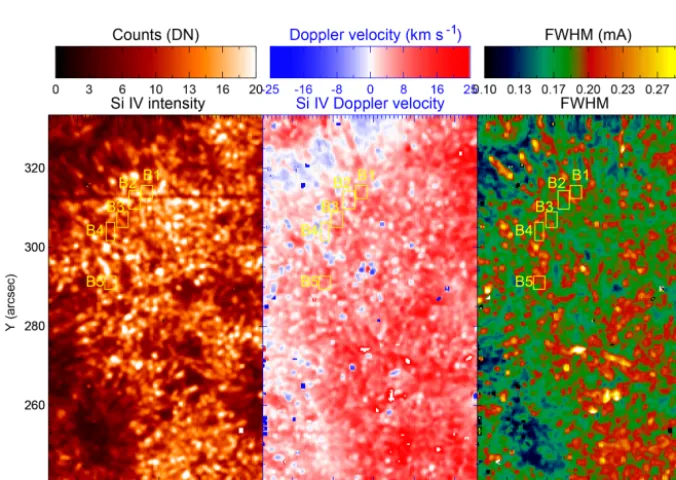
Figure 5 shows the parametric plots of the Si IV (1393.7604 Å), showing the intensity, Doppler velocity, and FWHM (full width at half maximum) maps where the values are indicated by the color bars over the plots. The Doppler velocity maps show that the TR is dominated by red shifts even in the plage region surrounding the moss in which foot points were taken for our analysis.
Figure 4 shows the differential emission measure (DEM) maps of the ROI, derived by using the automated method discussed by Hannah and Kontar (2012) in which plasma emission at different temperatures is shown. The color bar indicates the range of the DEM values. These maps show the presence of multi-thermal plasma at the foot points of the quiescent coronal loop systems shown by the boxes around it.
The Doppler velocity distribution is thus explored at dif-ferent locations, labeled as B1, B2, B3, B4, and B5. Positive
values (blue shifts) indicate upflows. The Doppler velocity at each pixel in first box (B1) for different spectral lines is then shown in Fig. 6. The velocity distribution for Ni I shows the spread around 0 km s−1, ranging from−0.8 to+2.2 km s−1. Mg II k shows the velocities, ranging from−5 to+1 km s−1, while C II ranges from −5 to +5 km s−1. Si IV shows red shifts with Doppler velocities ranging from 0 to+15 km s−1. The histogram of the Doppler velocity for different spectral lines indicates the red shifts in the Si IV line and very small or negligible flows at Ni I, Mg II k, and C II.
Similarly, such Doppler velocity distribution is shown in Figs. 7, 8, 9, and 10 for different boxes, labeled as B2, B3, B4, and B5.
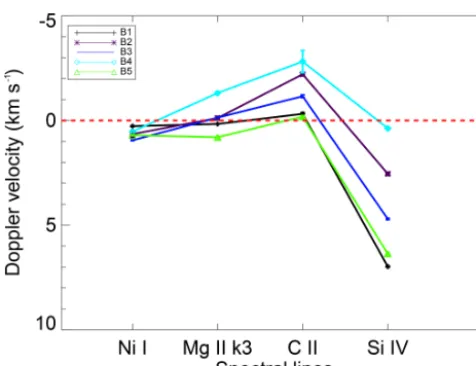
Figure 11 shows the average Doppler shift of different spectral lines as a function of their temperatures for different boxes chosen at the foot points of the loops. Ni I (2799.47 Å) corresponds to the upper photosphere, and Mg II k yields emission ranging from the mid-chromosphere to upper chro-mosphere. The core defined by (k3) forms little higher than the wings at 200 km below TR (Leenarts et al., 2013). The C II core yields emission from 2.1 Mm, while Si IV corre-sponds to the TR emission (Rathore et al., 2015).
tem-Figure 9.The velocity distributions for different spectral lines corresponding to different temperatures at box B4.
[image:7.612.123.469.417.683.2]772 Y. K. Rao et al.: Doppler shifts in quiescent coronal loops
Figure 11.Average Doppler velocity variations for different spec-tral lines dominating at different heights in the solar atmosphere for boxes B1, B2, B3, B4, and B5 at the foot points of quiescent coronal loops.
shifts (upflows) of−0.17 to−2.81 km s−1, but it is still neg-ligible when compared to chromospheric flows. The Doppler velocity variation at Si IV shows prevalent red shifts (down-flows) at all the locations corresponding to TR flows (0.37 to 6.97 km s−1). The 1σ error is shown as error bars, which is difficult to visualize in Fig. 11, owing to its very small values.
4 Discussions and conclusions
The co-spatial multi-spectral Doppler velocity trend at the foot points of quiescent coronal loops was studied. The Doppler velocity variation shows small flows (upflows and downflows) for Ni I and Mg II k in the photospheric as well as the chromospheric region. C II shows very blue shifts (−0.1 to−2.81 km s−1), indicating small upflows at the upper chro-mospheric region. The Doppler velocities then change to red shifts at the formation temperature of the Si IV line, corre-sponding to the TR.
It was previously shown that the moss regions show sig-nificant red shifts (downflows) in the TR, explaining the low-frequency heating (Bradshaw and Cargill, 2010). The high-and low-frequency mechanisms depend on the time taken by the loops to cool down when compared to heating frequency (Tripathi et al., 2008).
Our study of the flows at the quiescent coronal loops shows similar characteristics to the dynamically active loops, though the velocity values are smaller. The plasma predomi-nantly shows red shifts at TR temperatures which corroborate with the low-frequency heating of loops in the coronal part of the solar atmosphere. These observations thus agree with the coronal loops heated up by low-frequency nanoflares via an impulsive heating mechanism. Also, Patsourakos and
Klim-ing in the loops. Though it is possible to have asymmetries in the individual profile for which velocity distribution has been observed, our speculation supports the nanoflare-driven im-pulsive heating mechanism for the quiescent coronal loops.
The asymmetries may also cause the Doppler variation in the spectral profiles due to a difference in the pressures. (Mariska and Boris, 1983). Thus, other possibilities cannot be ruled out.
Data availability. All the data which we have used in the paper can be accessed publicly at http://www.iris.lmsal.com/search/ (last ac-cess: 19 July 2019).
Author contributions. All authors have contributed in an equal manner.
Competing interests. The authors declare that they have no conflict of interest.
Special issue statement. This article is part of the special issue “So-lar magnetism from interior to corona and beyond”. It is a result of the Dynamic Sun II: Solar Magnetism from Interior to Corona, Siem Reap, Angkor Wat, Cambodia, 12–16 February 2018.
Acknowledgements. We acknowledge the use of IRIS observations. IRIS is a NASA Small Explorer mission developed and operated by the Lockheed Martin Solar and Astrophysics Laboratory (LMSAL), with mission operations executed at the NASA Ames Research Cen-ter and major contributions to downlink communications funded by the Norwegian Space Centre (NSC; Norway) through an ESA PRODEX contract.
Financial support. Yamini K. Rao is fully supported by the finan-cial grant from the ISRO RESPOND project.
Review statement. This paper was edited by Viktor Fedun and re-viewed by two anonymous referees.
References
Bradshaw, S. J. and Cargill, P. J.: A New Enthalpy-Based Approach to the Transition Region in an Impulsively Heated Corona, Astrophys. J. Lett., 710, L39, https://doi.org/10.1088/2041-8205/710/1/L39, 2010.
Del Zanna, G.: Flows in active region loops observed by Hinode EIS, Astron. Astrophys., 481, L49, https://doi.org/10.1051/0004-6361:20079087, 2008.
Del Zanna, G. and Mason, H. E.: Solar active regions: SOHO/CDS and TRACE observations of quiescent coronal loops As-tron. Astrophys., 406, 1089, https://doi.org/10.1051/0004-6361:20030791, 2003.
Del Zanna, G., O’Dwyer, B., and Mason, H. E.: SDO AIA and Hin-ode EIS observations of “warm” loops, Astron. Astrophys., 535, A46, https://doi.org/10.1051/0004-6361/201117470, 2011. De Moortel, I. and Browning, P.: Recent advances in
coro-nal heating, Philos. T. R. Soc. Lond. S-A, 373, 20140269, https://doi.org/10.1098/rsta.2014.0269, 2015.
De Pontieu, B., Title, A. M., Lemen, J. R., Kushner, G. D., Akin, D. J., Allard, B., Berger, T., Boerner, P., Cheung, M., Chou, C., Drake, J. F., Duncan, D. W., Freeland, S., Heyman, G. F., Hoff-man, C., Hurlburt, N. E., Lindgren, R. W., Mathur, D., Rehse, R., Sabolish, D., Seguin, R., Schrijver, C. J., Tarbell, T. D., Wülser, J.-P., Wolfson, C. J., Yanari, C., Mudge, J., Nguyen-Phuc, N., Timmons, R., van Bezooijen, R., Weingrod, I., Brookner, R., Butcher, G., Dougherty, B., Eder, J., Knagenhjelm, V., Larsen, S., Mansir, D., Phan, L., Boyle, P., Cheimets, P. N., DeLuca, E. E., Golub, L., Gates, R., Hertz, E., McKillop, S., Park, S., Perry, T., Podgorski, W. A., Reeves, K., Saar, S., Testa, P., Tian, H., Weber, M., Dunn, C., Eccles, S., Jaeggli, S. A., Kankel-borg, C. C., Mashburn, K., Pust, N., Springer, L., Carvalho, R., Kleint, L., Marmie, J., Mazmanian, E., Pereira, T. M. D., Sawyer, S., Strong, J., Worden, S. P., Carlsson, M., Hansteen, V. H., Leenaarts, J., Wiesmann, M., Aloise, J., Chu, K.-C., Bush, R. I., Scherrer, P. H., Brekke, P., Martinez-Sykora, J., Lites, B. W., McIntosh, S. W., Uitenbroek, H., Okamoto, T. J., Gummin, M. A., Auker, G., Jerram, P., Pool, P., and Waltham, N.: The In-terface Region Imaging Spectrograph (IRIS), Solar Phys., 289, 2733, https://doi.org/10.1007/s11207-014-0485-y, 2014. Fletcher, L. and De Pontieu, B.: Plasma Diagnostics of Transition
Region “Moss” using SOHO/CDS and TRACE, Astrophys. J. Lett., 520, L135, https://doi.org/10.1086/312157, 1999. Hannah, I. G. and Kontar, E. P.: Differential emission
mea-sures from the regularized inversion of Hinode and SDO data, Astron. Astrophys., 539, A146, https://doi.org/10.1051/0004-6361/201117576, 2012.
Huang, Z., Xia, L., Li, B., and Madjarska, M. S.: Cool Transition Region Loops Observed by the Interface Region Imaging Spec-trograph, Astrophys. J., 810, 46, https://doi.org/10.1088/0004-637X/810/1/46, 2015.
Klimchuk, J. A.: On Solving the Coronal Heating Problem, So-lar Phys., 234, 41, https://doi.org/10.1007/s11207-006-0055-z, 2006.
Leenaarts, J., Pereira, T. M. D., Carlsson, M., Uitenbroek, H., and De Pontieu, B.: The Formation of IRIS Diagnostics. II. The For-mation of the Mg II h&k Lines in the Solar Atmosphere, Astro-phys. J., 772, 90, https://doi.org/10.1088/0004-637X/772/2/90, 2013.
Lemen, J. R., Title, A. M., and Akin, D. J.: The Atmospheric Imag-ing Assembly (AIA) on the Solar Dynamics Observatory (SDO), Solar Phys., 275, 17, https://doi.org/10.1007/s11207-011-9776-8, 2012.
Mariska, J. T. and Boris, J. P.: Dynamics and spectroscopy of asymmetrically heated coronal loops, Astrophys. J., 267, 409, https://doi.org/10.1086/160879, 1983.
Patsourakos, S. and Klimchuk, J. A.: Nonthermal Spectral Line Broadening and the Nanoflare Model, Astrophys. J., 647, 1452, https://doi.org/10.1086/505517, 2006.
Rao, Y. K., Srivastava, A. K., Kayshap, P., Wilhelm, K., and Dwivedi, B. N.: Plasma Flows in the Cool Loop Systems, As-trophys. J., 874, 56, https://doi.org/10.3847/1538-4357/ab06f5, 2019.
Rathore, B., Carlsson, M., Leenaarts, J., and De Pontieu, B.: The Formation of IRIS Diagnostics. VI. The Diagnostic Potential of the C II Lines at 133.5 nm in the Solar Atmosphere, Astrophys. J., 811, 81, https://doi.org/10.1088/0004-637X/811/2/81, 2015. Reale, F.: Coronal Loops: Observations and Modeling
of Confined Plasma, Living Rev. Sol. Phys., 11, 4, https://doi.org/10.12942/lrsp-2014-4, 2014.
Tripathi, D., Mason, H. E., Young, P. R., and Del Zanna, G.: Density structure of an active region and associ-ated moss using Hinode/EIS, Astron. Astrophys., 481, L53, https://doi.org/10.1051/0004-6361:20079034, 2008.
Warren, H. P. and Brooks, D. H.: The Temperature and Density Structure of the Solar Corona. I. Observations of the Quiet Sun with the EUV Imaging Spectrometer on Hinode, Astrophys. J., 700, 762, https://doi.org/10.1088/0004-637X/700/1/762, 2009. Young, P. R., O’Dwyer, B., and Mason, H. E.: Velocity