This is a repository copy of
Design and optimisation of a low-carbon ventilation technology
for buildings in warm/hot climate
.
White Rose Research Online URL for this paper:
http://eprints.whiterose.ac.uk/88713/
Version: Accepted Version
Proceedings Paper:
Calautit, J.K. and Hughes, B.R. (2015) Design and optimisation of a low-carbon ventilation
technology for buildings in warm/hot climate. In: Sustainable Development on Building and
Environment (SuDBE): Proceedings of the 7th International Conference. 7th International
Conference on Sustainable Development in Building and Environment, 27-29 July 2015,
Reading, UK. SuDBE . ISBN 9780993120701
[email protected] https://eprints.whiterose.ac.uk/
Reuse
Unless indicated otherwise, fulltext items are protected by copyright with all rights reserved. The copyright exception in section 29 of the Copyright, Designs and Patents Act 1988 allows the making of a single copy solely for the purpose of non-commercial research or private study within the limits of fair dealing. The publisher or other rights-holder may allow further reproduction and re-use of this version - refer to the White Rose Research Online record for this item. Where records identify the publisher as the copyright holder, users can verify any specific terms of use on the publisher’s website.
Takedown
If you consider content in White Rose Research Online to be in breach of UK law, please notify us by
Design and optimisation of a low-carbon ventilation technology for
buildings in warm/hot climate
John Kaiser Calautit, Ben Richard Hughes
Department of Mechanical Engineering, University of Sheffield, Sheffield S10 2TN, UK
Corresponding author, Email: [email protected], Tel: +44 (0) 7544158981
Abstract: The aim of this work was to evaluate the performance of a wind catcher integrated with passive heat-transfer
devices using numerical modeling and wind tunnel experiments. The main investigation parameters in determining the
viability of the design were the wind characteristic, indoor air flow rate and distribution and air supply temperature. The
wind catcher model was incorporated to a building, representing a small classroom of 15 occupants. Grid sensitivity
analysis was used to verify the programming and computational operation of the computational model. An experimental
scale model was created using rapid prototyping and was tested in a subsonic wind tunnel to validate the numerical data.
Good agreement was observed between both methods of analysis. Furthermore, the effect of varying the spacing of
theheat-transfer devices on the system’s ventilation and cooling performance were investigated. The study highlighted the potential of the proposed wind catcher in reducing the air temperature and supplying the required ventilation rates. The
technology presented here is subject to a patent application (PCT/GB2014/052263).
Key words: CFD, heat transfer, passive, sustainable, wind tunnel
1 Introduction
Commercial and residential buildings consume 40 % of the world’s energy usage and are responsible for nearly the same amount of emitted carbon [1]. Heating Ventilation and Air Conditioning (HVAC) systems consume about 60 % of the total energy use in buildings [2]. Hence, the use of low-carbon or passive techniques to reduce the energy consumption of buildings is highly desirable. Nowadays, architects and building engineers are encouraged to integrate passive cooling and ventilation strategies into the design of the built environment. An example of this is a natural ventilation wind catcher. A wind catcher is a shaft projecting on the roof as shown in Fig. 1a. It has a large opening facing the predominant wind that captures the air from high elevation and directs it downward into the building. Fig. 1b demonstrates the operation of a uni-directional wind catcher as part of a complete ventilation system. The system primarily depends on the air movement caused by the pressure differential, although convection produces the stack effect as well.
with the height of 10 meters were able to reduce the air temperature by 12 K.
Fig.1 (a) uni-directional wind catcher (b) operation of a wind catcher in a building [6].
Kalantar [7] evaluated the performance of a wind catcher with evaporative cooling spray using CFD. It was found that the wind catcher was able to decrease the air temperature by 10 K to 15 K at its optimum performance. Using the same CFD method, Calautit et al. [8] compared the thermal performance of an evaporative cooling and heat transfer device assisted cooling for traditional wind catchers. The heat transfer device system works on a similar principle of providing cooling but unlike evaporative cooling, which directly evaporates water to the airstream, a heat transfer device is an indirect cooling devices. Therefore, there is less increase in humidity compared to evaporative cooling techniques, making it viable for regions with moderate humid conditions. There is also less risk of contamination of the airstream (ex. waterborne bacteria). Furthermore, the study concluded that height was not a factor for the heat transfer device integrated wind catcher, making it viable for commercial devices.
In previous studies [8, 9], we evaluated the integration of heat transfer devices into wind catchers. The results showed that the system was capable of reducing the temperature and delivering the suggested fresh air rates. The previous works were completely CFD-based and hence assessment by experimental methods was of further interest. This study will use CFD and wind tunnel analysis to investigate the performance of a commercial wind catcher with heat transfer devices as shown in Fig. 2.
Fig.2 A commercial wind catcher with heat transfer devices.
The hot outdoor air enters the wind catcher through the louvers. The airflow is driven downwards and passed through the heat transfer device arrangement. The evaporator side (hot point) absorbs the heat from the airstream and transfers it to a parallel condenser unit (cold point). Control dampers are mounted at the bottom of the unit to control the delivery rate of the outdoor air, as variations in outdoor wind speed greatly
evaporator
condenser control damper
louvers
influence the air movement rate within the room. The cooled air is supplied to the room beneath the channel via the ceiling diffusers.
2 Method
2.1 Numerical methodology
The basic assumptions for the numerical simulation include a three-dimensional, fully turbulent, and incompressible flow. CFD code was used with the Finite Volume Method (FVM) approach and the Semi-Implicit Method for Pressure-Linked Equations (SIMPLE) velocity-pressure coupling algorithm with the second order upwind discretisation. The general governing equations include the continuity, momentum and energy balance for each individual phase. The standard k-epsilon transport model was used to define the turbulence kinetic energy and flow dissipation rate within the model. The governing equations are available in [10].
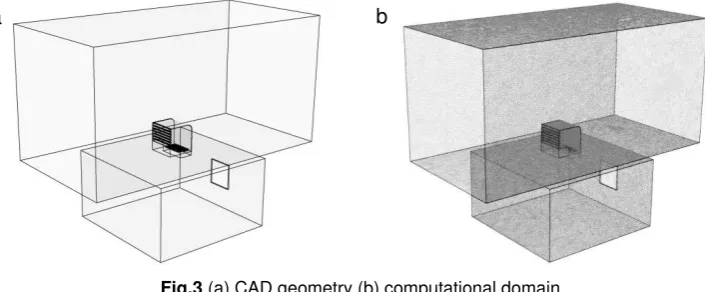
Fig. 3a shows the geometry modeled in Solid Edge CAD software. The CAD data was imported into the ANSYS Geometry to generate a computational model and mesh. The fluid volume was extracted from the solid model and meshed as shown in Fig. 3b. The fluid volume was separated into three parts: the macro-climate (outdoor), wind catcher and micro-climate (indoor). The macro-climate was created to simulate the airflow around the wind catcher model. A horizontal plane was used as a velocity inlet, while the opposite boundary wall was set as the pressure outlet (atmospheric). The velocity inlet was varied between 0 and 5 m/s. The external air temperature was set to 318 K to simulate a hot external environment. The macro-climate dimensions was 5 m x 5 m x 10 m. Based on the dimensions of the wind catcher (1 m x 1 m x 1 m), the model produced a blockage of 4.8 %. The micro-climate (3 m x 5 m x 5 m) represent a small class room [11]. An opening located at the leeward side of the room was set as pressure outlet (atmospheric) to extract the air out of the room. The heat transfer devices, each with an outer diameter of 0.02 m, were integrated in to the lower part of the wind catcher channel. In order to cool the air that was supplied to the room, the surface temperature of the heat transfer devices was set to 293 K. The horizontal spacing between each heat transfer device was 0.05 m. In order to determine the optimum cooling and ventilation performance of the wind catcher, the horizontal spacing of the heat transfer devices was varied between 0.05 m to 0.1 m.
Fig.3 (a) CAD geometry (b) computational domain.
Due to the complexity of the wind catcher model, an unstructured mesh was used to discretise the computational domains [12]. To be able to accurately calculate the flow fields near the critical areas of interest in the simulation, such as the heat transfer devices and louvers, size functions were applied in those areas
[image:4.595.116.469.575.721.2][13]. The mesh element size was varied from 0.005 m for the mesh near the heat transfer devices to 0.07 m for the middle of the space. Fig. 3b shows the generated mesh of the wind catcher and room using ANSYS Mesh.
The computational model was verified using mesh sensitivity analysis. The number of elements was increased until an acceptable compromise was reached between: number of elements; computational time to solve; and the posterior error indication. At 4.9 million elements the error indication between refinements was at its lowest; coupled with the computational time, made it an acceptable compromise.
2.2 Experimental methodology
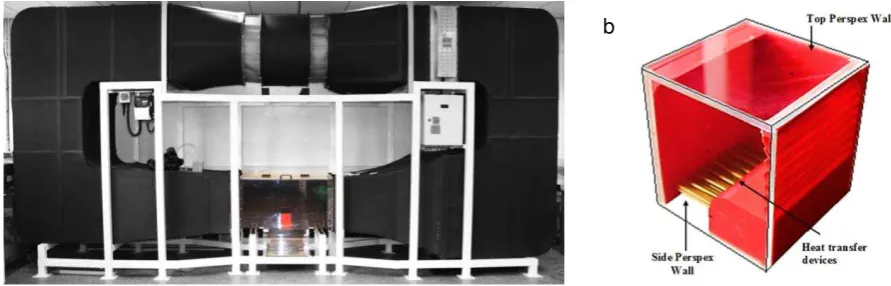
The experimental investigation was conducted using a closed-loop wind tunnel, detailed in [14]. The wind tunnel had a test section with the dimensions of 0.5 m, 0.5 m, and 1 m (Fig. 4). A 1:10 scale model of the wind catcher was constructed using rapid prototyping (Fig. 4b). Based on the dimensions of the scale model and the wind tunnel cross-section, the scale model produced a blockage of 4.8%, and no corrections were made to the measurements obtained [15, 16]. The model of the wind catcher was connected to a 0.5 m x 0.5 m x 0.3 m room, which was mounted underneath the test section [17]. An outlet window (0.1 m x 0.1 m) was located at the leeward side of the room. The airflow into the room was measured using a hot-wire anemometer, which was positioned below the channels of the wind catcher. The cross-sectional area of the wind catcher was divided into several portions and the supply rate through the channel was calculated. The hot-wire sensor gave airflow velocity measurements with uncertainty of ±1.0 % of rdg. at speeds below 8 m/s.
Fig.4 (a) closed-loop wind tunnel (b) 3D printed wind catcher model.
3 Results and discussion
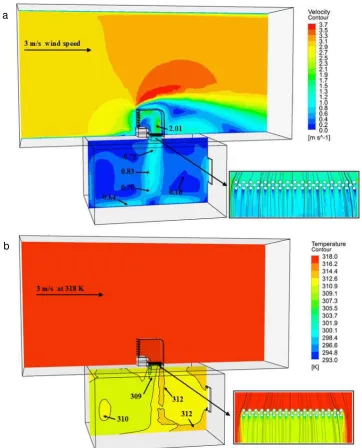
Fig. 5a shows a cross-sectional plot of the airflow velocity contours in the room and wind catcher. As observed, the outdoor wind decelerated as it approached the wind catcher opening. The velocity of the airflow before the louver section was around 1.2 m/s. Then, the airflow velocity increased (up to 2 m/s) as it passed
through the 90˚ bend of the wind catcher channel. Separation zone was observed near the lower edge of the opening. The heat transfer devices reduced the speed of the airflow entering the room by up to 20 %. High flow speeds were observed at the center of the room reaching up to 0.83 m/s. The air stream was circulated inside the structure and exited the opening located on the leeward side of the room. Figure 5b illustrates the predicted temperature distribution inside the room. At 3 m/s outdoor wind speed, the average temperature inside the room was 310.4 K.
[image:5.595.72.518.409.552.2]
Fig.5 (a) Velocity distribution (b) Temperature distribution.
Table 1 summarises the calculated supply rates for different external wind speeds. The Building
Regulation’s Approved Document F1A suggests that an air supply rate of 8 - 10 L/s per occupant is recommended for office spaces and classrooms [18,19]. The device did not meet this recommendation for an external wind speed of 1 m/s and lower. However, the system surpassed the recommended supply rates as the external velocity increased.
Table1 Effect of wind speed on the supply rates of the wind catcher with heat transfer devices.
Wind speed [m/s] Supply rate [L/s] [L/s/occupant] [L/s/m2]
1.0 145.0 9.7 2.6
2.0 325.0 21.7 5.8
3.0 485.0 32.3 13.0
4.0 695.0 46.3 19.4
5.0 840.0 56.0 27.8
a
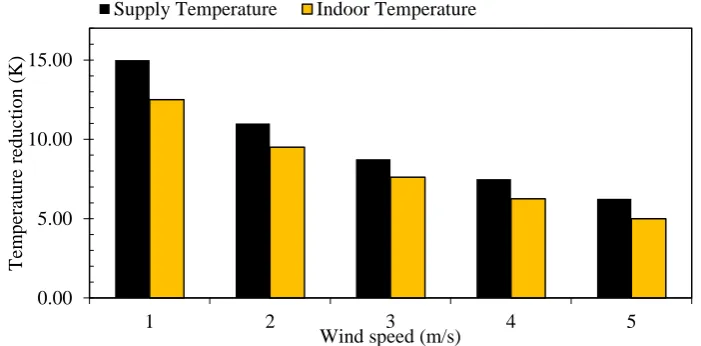
[image:6.595.110.473.79.528.2]Fig. 6 shows the effect of various external wind speeds on the thermal performance of the system. As observed, the cooling performance of the heat transfer device decreased as the speed of the airflow increased. At 5 m/s external wind speed, the indoor air temperature was only reduced by 5 K. Significant reduction in the indoor temperature was observed at lower wind speeds (1 – 2 m/s), up to 9.5 – 12.5 K reduction.
Fig.6 Effect of wind speed on the wind catcher thermal performance.
Fig.7 displays the comparison between the predicted and experimental results for the airflow velocity measurements below the wind catcher channel. Good agreement was observed between the CFD results and measurements, with the error below 10 %.
Fig.7 Comparison between the CFD and experimental results of the airflow velocity.
Fig. 8 shows the combined response of the velocity and temperature due to the variation of the horizontal spacing between the heat transfer devices. It was observed that the effect of the horizontal spacing on the airflow temperature was more significant compared to the effect on the airflow velocity. Reducing the spacing from 10 mm to 5 mm, improved the temperature drop by 3.48 K while the supply airflow velocity was reduced by only 0.12 m/s. Uavgand Tavg are the average predicted U and T values.
0.00 5.00 10.00 15.00
1 2 3 4 5
T
em
p
er
atu
re
red
u
ctio
n
(
K)
[image:7.595.128.479.173.346.2] [image:7.595.112.491.428.601.2]Fig.8 Effect of varying the horizontal spacing on the ventilation and thermal performance.
4 Conclusions
In hot climates, the utility of natural ventilation carries significant importance in reducing air-conditioning loads and its required power consumption for buildings. To allow for fresh air and reduced air temperatures, integration between a wind catcher and heat transfer devices was carried out in this study. The numerical investigation was carried out to simulate and analyse the airflow and temperature distribution around and through the wind catcher to the test room. The findings from the work highlighted that the system was capable of meeting the fresh air intake requirements per occupant of 10L/s at low wind speeds. Furthermore, the spacing between the heat transfer devices was varied to optimise the cooling and natural ventilation performance. It was found that the effect of varying the horizontal spacing on the supplied air temperature was more significant compared to the effect on the airflow velocity. Reducing the spacing from 10 mm to 5 mm improved the temperature drop by 3.48 K while the supply airflow velocity was reduced by only 0.12 m/s.
References
[1] Hughes B.R., Calautit J.K., Ghani, S.A. The Development of Commercial Wind Towers for Natural Ventilation: a review. Applied Energy. 2012,92:606-627.
[2] Sofotasiou P., Hughes B.R., Calautit J.K. Qatar 2022: Facing the FIFA World Cup climatic and legacy challenges. Sustainable Cities and Society. 2015,14:16-30.
[3] Calautit J.K., Hughes B.R., Ghani S.A. A Numerical Investigation into the Feasibility of Integrating Green Building Technologies into Row Houses in the Middle East. Architectural Science Review. 2013, 56:279-296.
[4] Bahadori M., Mazidi M., Dehghani A. R. Experimental investigation of new designs of wind towers. Renewable Energy. 2008,33:2273–2281.
[5] Saffari H., Hosseinnia S. Two-phase Euler-Lagrange CFD simulation of evaporative cooling in a Wind Tower. Energy and Buildings. 2009,41:991–1000.
[6] Fathy H. Natural energy and vernacular architecture: principles and examples with reference to hot arid climates. The University of Chicago Press Chicago and London. 1986.
[7] Kalantar V. Numerical simulation of cooling performance of wind tower (Baud-Geer) in hot and arid region. Renewable Energy. 2009,34:246–254.
[8] Calautit J.K., Chaudhry H.N., Hughes B.R., Ghani S.A. Comparison between evaporative cooling and a heat pipe assisted thermal loop for a commercial wind tower in hot and dry climatic conditions. Applied Energy. 2013,101:740-755.
[9] Calautit J.K., Hughes B.R., Chaudhry H.N., Ghani S.A. CFD analysis of a heat transfer device integrated wind tower system for hot and dry climate. Applied Energy. 2013,112:576-591.
[10] Calautit J.K., O’Connor D., Hughes, B.R. Determining the optimum spacing and arrangement for commercial wind towers for ventilation performance. Building and Environment. 2014,82:274-287.
[11] Calautit J.K., Hughes B.R. Wind tunnel and CFD study of the natural ventilation performance of a commercial multi-directional wind tower. Building and Environment. 2014,80:71-83.
[12] Calautit J.K., Hughes B.R., Ghani S.A. A Numerical Investigation into the Feasibility of Integrating Green Building Technologies into
Row Houses in the Middle East, Architectural Science Review. 2013, 56, 279-296.
[13] O’Connor, D.; Calautit, J.K.; Hughes, B.R. A Study of Passive Ventilation Integrated with Heat Recovery. Energy and Buildings. 2014, 82, 799-811.
[14] Calautit J.K., Chaudhry H.N., Hughes B.R., Sim L.F. A validated design methodology for a closed-loop subsonic wind tunnel. Journal of Wind Engineering and Industrial Aerodynamics. 2014,125: 180-194.
[15] Calautit J.K., Hughes B.R. Measurement and prediction of the indoor airflow in a room ventilated with a commercial wind tower. Energy and Buildings. 2014,84:367-377.
[16] Calautit J.K., O’Connor D., Sofotasiou P., Hughes B.R. CFD Simulation and Optimisation of a Low Energy Ventilation and Cooling System. Computation. 2015,3:128-149,.
[17] Calautit J.K., Hughes B.R., Shahzad S.S. CFD and wind tunnel study of the performance of a uni-directional wind catcher with heat transfer devices. Renewable Energy. 2015,83:85-99,.
[18] Calautit J.K., Hughes B.R., Ghani S.A. Numerical investigation of the integration of heat transfer devices into wind towers. Chemical Engineering Transactions. 2013,34:43-48