This is a repository copy of
Eurocode 7 and new design challenges using numerical
methods with different soil models
.
White Rose Research Online URL for this paper:
http://eprints.whiterose.ac.uk/93892/
Version: Accepted Version
Proceedings Paper:
Katsigiannis, G, Schweiger, H, Simpson, B et al. (2 more authors) (2015) Eurocode 7 and
new design challenges using numerical methods with different soil models. In: Winter, MG,
Smith, DM, Eldred, PJ and Toll, DG, (eds.) XVI European Conference on Soil Mechanics
and Geotechnical Engineering. XVI European Conference on Soil Mechanics and
Geotechnical Engineering, 13-17 Sep 2015, Edinburgh. ICE Publishing , pp. 4277-4282.
ISBN 978-0-7277-6067-8
https://doi.org/10.1680/ecsmge.60678.vol7.677
[email protected] https://eprints.whiterose.ac.uk/
Reuse
Unless indicated otherwise, fulltext items are protected by copyright with all rights reserved. The copyright exception in section 29 of the Copyright, Designs and Patents Act 1988 allows the making of a single copy solely for the purpose of non-commercial research or private study within the limits of fair dealing. The publisher or other rights-holder may allow further reproduction and re-use of this version - refer to the White Rose Research Online record for this item. Where records identify the publisher as the copyright holder, users can verify any specific terms of use on the publisher’s website.
Takedown
If you consider content in White Rose Research Online to be in breach of UK law, please notify us by
Eurocode 7 and new design challenges using numerical
methods with different soil models
Eurocode 7 et de nouveaux défis de conception en utilisant des
méthodes numériques avec différents modèles de sol
G. Katsigiannis*1 2, H.F. Schweiger3 , B. Simpson1, P. Ferreira2 and R. Fuentes4
1 Arup, London, United Kingdom
2 University College of London, London, United Kingdom
3 Graz University of Technology, Graz, Austria 4 University of Leeds, Leeds, United Kingdom
* Corresponding Author
ABSTRACTAccording to Eurocode 7, soil strength factoring can be achieved by applying the material partial factors to the effective
stress parameters c’ and ’ or to the undrained shear strength cu. Thus, in numerical analyses, material factoring is straightforward for
con-stitutive models with c’, ’ or cu as input parameters. While designers often use simple elastic-perfectly plastic soil models for ULS checks,
the use of more advanced constitutive models allows real soil behaviour to be simulated more realistically and can have significant ad-vantages. In this paper, the feasible use of different soil models for ULS design, increasing in sophistication, such as the Mohr-Coulomb (MC), the Hardening Soil (HS), the Hardening Small Strain (HSS) and the Soft Soil (SS) models, is highlighted and better understood in the context of the EC7 requirements using deep supported excavation examples in stiff clay. The challenges of factoring undrained shear strength when using effective stress model parameters are also discussed and the effect of the soil model is investigated.
RÉSUMÉ Selon l'Eurocode 7, le coefficient de sécurité sur la capacité d’un sol peut être obtenu en appliquant les coefficients de sécurité
partiels du matériau aux paramètres de contrainte effective c’ et ’, ou à la résistance au cisaillement non drainée cu. Ainsi, en calcul num
é-rique, la prise en compte du facteur de sécurité est évidente pour les modèles constitutifs requérant les paramètres d’entréec’, ’ ou cu.
Alors que les concepteurs font fréquemment usage de simples modèles élastoplastiques parfaits pour les vérifications ELU (état limite
ul-time), l’emploi de modèles constitutifs avancés permet une simulation plus réaliste de sols réels et peut présenter des avantages
significa-tifs. Dans cette publication, la faisabilité d’une conception ELU au moyen de différents modèles de sols plus sophistiqués tels que Mohr
-Coulomb (MC), Hardening Soil (HS), Hardening Small Strain (HSS), et Soft Soil (SS) est mise en avant et clarifiée dans le contexte des
exigences Eurocodes 7 pour les exemples d’excavations profondes en argile dure. Les défis d’une factorisation de la résistance au
cisaille-ment lors de l’utilisation de paramètres de contrainte effective sont égalecisaille-ment abordés, et l’effet du modelé de sol est étudié.
1 INTRODUCTION
While the Finite Element Method (FEM) has been traditionally used in geotechnical engineering to ob-tain deformations and check for Serviceability Limit State (SLS), there are still a number of issues that need further research before the Ultimate Limit State (ULS) design can be routinely performed with FEM. Simpson (2012) and Simpson & Junaideen (2013) give a good review of most of the challenges
associ-ated with the ULS design with FEM.In this paper,
the feasible use of different soil models such as the Mohr-Coulomb (MC), the Hardening Soil (HS), the
2 MATERIAL FACTORING STRATEGIES
EC7 suggests three different Design Approaches (DAs) and each National Standard Body has chosen which approach is preferable. DA1, which is adopted in the UK, has two different combinations (sets of partial factors). In general, we could say that DA1-1 and DA2 are Load Factoring Approaches (LFAs) as the factors are applied to actions or action effects while DA1-2 and DA3 are Material Factoring Ap-proaches (MFAs) as the soil strength parameters have to be factored.
[image:3.536.282.485.322.403.2]There are two different ways to factor soil strength in FEM in staged construction problems which have arisen from the lack of guidance in the code (Katsigiannis et al, 2014). In Strategy 1, the ma-terial parameters are factored from the beginning so the analysis is performed with the design values of soil strength. On the other hand, in Strategy 2, calcu-lations are performed with characteristic values and at critical stages the material parameters are reduced to their design values. A good description of the two strategies has been given by Simpson (2012). Katsigiannis et al. (2014) have also discussed the ad-vantages and disadad-vantages of the two strategies which are summarized in Table 1.
Table 1. Advantages and disadvantages of the two material
factor-ing strategies
Strategy 1 Strategy 2
It is straightforward and easy
More critical in terms of design structural forces
It can be applied in many situations, not only in staged construction problems
It can be used in con-junction with SLS and DA1-1.
X In some cases it might yield design structural forces with inadequate margins of safety
X It requires many extra construction stages
X Additional computation-al effort and time
3 BENCHMARK EXAMPLE
The challenges of deriving design prop forces us-ing FEM and the effect of the soil model used are ad-dressed for deep excavation in stiff, highly over-consolidated clay. The geometry of the problem is given in Figure 1.
3.1 Analysis Description
The computer software PLAXIS V12.01 was used for the analysis in its two-dimensional version. The analysis was repeated with different soil models as-suming undrained conditions: the Mohr-Coulomb (MC), Hardening Soil (HS) and Hardening Small Strain (HSS) models. In all the analyses, typical stiff highly OC clay total stress parameters were used
which are listed in Tables 2 and 3.The soil stiffness
properties for HS and HSS are taken from Schweiger (2010). The following modelling sequence was ana-lysed (an overdig of 0.5m is considered):
Stage 0 Initial state conditions
Stage 1 Wall installation and 10kPa surcharge
Stage 2, 4, 6, 8, 10 and 12 Excavation of 4m ofsoil
[image:3.536.51.255.404.523.2]
Stage 3, 5, 7, 9 and 11 Install strutTable 2. Mohr-Coulomb parameters
Total stress parameters
sat (kN/m3) 20
cu (kPa) 60+8z
Eu (kPa) 1000cu
Effective stress parameters
c’ (kPa) 0
’ (°) (°)
25 0
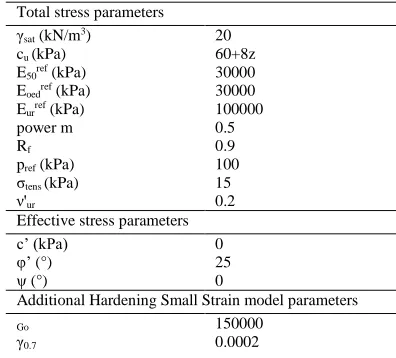
Table 3. HS and HSS model parameters
Total stress parameters
sat (kN/m3) 20
cu (kPa) 60+8z
E50ref (kPa)
Eoedref (kPa)
Eurref (kPa)
power m Rf
pref (kPa) tens (kPa)
'ur
30000 30000 100000 0.5 0.9 100 15 0.2 Effective stress parameters
c’ (kPa) 0
’ (°) (°)
25 0
Additional Hardening Small Strain model parameters
Go 0.7
[image:3.536.284.482.437.616.2]Table 4. Soft Soil model parameters
Effective stress parameters
sat (kN/m3) 20
c’ (kPa) 0
’ (°) (°)
* * ’
25 0 0.189 0.0092 1.435 0.2
Stiff clay
0 m
-4 m
-8 m
-12 m
-16 m
-20 m
-24 m
-31.5 m elevation Variable surcharge 10 kPa
cu=60+8z (kPa) Eu=1000cu
kN/m3
Strut 2
Strut 3
Strut 4
[image:4.536.278.492.195.337.2]Strut 5 Strut 1
Figure 1. Geometry of deep excavation supported by 5 levels of
props
3.2 Results
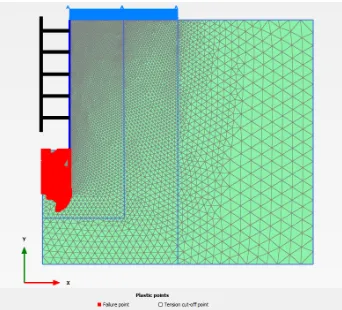
Factoring soil strength from the beginning (i.e. Strategy 1) has a very small effect on the calculated prop loads. In Strategy 2, however, the soil strength is suddenly reduced at each excavation stage. Shift-ing from characteristic to factored soil strengths has, as result, shown that the lowest prop receives a high-er load increment than the props above (see Figure 2). At the final excavation stage the load of the low-est prop increases relative to the characteristic by
17.5%, 25.8% and 32.8% for K0 values of 1, 1.2 and
1.5 respectively (only the K0=1.2 case is presented
here). The increase of the load of the lowest prop is due to the development of a plastic zone at the bot-tom of the excavation (see Figure 3). The larger the plastic zone is, the larger is the increase of the prop load when shifting from characteristic to factored strength.
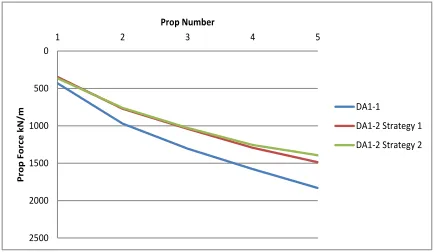
Figures 4 to 6 show computed prop loads for three different soil models, increasing in
sophistica-tion. In each case, DA1-1 returns the highest prop loads. For the simplest model (elastic-Mohr Cou-lomb), DA1-2 Strategy 1 returns significantly lower prop loads. Use of more advanced soil models such as the HS and HSS Plaxis models can result in much smaller differences in calculated prop loads from the two material factoring strategies of DA1-2. The dif-ference between the two DA1 combinations becomes smaller too.
1 2 3 4 5
characteristic 134 606 843 1088 1309
factored 164 638 875 1106 1647
0 200 400 600 800 1000 1200 1400 1600 1800
P
ro
p
f
o
rc
e
i
n
k
N
/m
Excursion at the final excavation stage
Figure 2. Prop loads before and after factoring soil strength in
Strategy 2 at the final excavation stage
[image:4.536.279.450.384.539.2]0
500
1000
1500
2000
2500
1 2 3 4 5
P
ro
p
Fo
rc
e
k
N
/
m
Prop Number
[image:5.536.45.263.78.201.2]DA1-1 DA1-2 Strategy 1 DA1-2 Strategy 2
Figure 4. Maximum prop loads from different factoring strategies
using MC soil model
0
500
1000
1500
2000
2500
1 2 3 4 5
P
ro
p
Fo
rc
e
k
N
/
m
Prop Number
[image:5.536.45.264.236.359.2]DA1-1 DA1-2 Strategy 1 DA1-2 Strategy 2
Figure 5. Maximum prop loads from different factoring strategies
using HS soil model
0
500
1000
1500
2000
2500
1 2 3 4 5
P
ro
p
Fo
rc
e
k
N
/
m
Prop Number
DA1-1 DA1-2 Strategy 1 DA1-2 Strategy 2
Figure 6. Maximum prop loads from different factoring strategies
using HSS soil model
4 CROSSRAIL CASE STUDY
The resulting discrepancies are now highlighted using a more realistic and deeper excavation based on the Crossrail Moorgate station box case study. The geometry and construction sequence are related to the proposal made by Zdravkovic et al. (2005).
However, a simplification of the geometry was un-dertaken in order to provide an easier understanding of the different factoring strategies.
4.1 Analysis Description
The computer software PLAXIS EA was used for the analysis in its 2D version. The Mohr-Coulomb (MC), Hardening Soil (HS) and Hardening Small Strain (HSS) soil models were again chosen. The fi-nite element mesh is shown in Figure 7. The concrete wall is 1.2m thick and is supported by 7 levels of steel tube props. The total stress soil parameters giv-en in Tables 2 and 3 were used for the FEM simula-tions.
Figure 7. Finite Element mesh
4.2 Results
[image:5.536.278.491.244.381.2] [image:5.536.45.262.394.520.2]0 500 1000 1500 2000 2500 3000 3500 4000 4500 5000
1 2 3 4 5 6 7
M a x P ro p Fo rc e i n k N /m Prop Number DA1-1
[image:6.536.46.260.78.211.2]DA1-2 Strategy 1 DA1-2 Strategy 2
Figure 8. Maximum prop loads from different factoring strategies
using MC soil model
0 500 1000 1500 2000 2500 3000 3500 4000 4500 5000
1 2 3 4 5 6 7
M a x P ro p Fo rc e i n k N / m Prop Number DA1-1
DA1-2 Strategy 1
[image:6.536.46.261.247.372.2]DA1-2 Strategy 2
Figure 9. Maximum prop loads from different factoring strategies
using HS soil model
0 500 1000 1500 2000 2500 3000 3500 4000 4500 5000
1 2 3 4 5 6 7
M a x P ro p Fo rc e i n k N /m Prop Number DA1-1 DA1-2 Strategy 1
DA1-2 Strategy 2
Figure 10. Maximum prop loads from different factoring
strate-gies using HSS soil model
5 FACTORING UNDRAINED STRENGTH
How the undrained soil strength should be fac-tored is one of the most common misunderstandings of EC7. In the analyses presented in this paper in Sections 3 and 4, total stress conditions were
as-sumed. The undrained shear strength cu was input,
i.e. the analysis was performed in terms of total stresses, so the software user could simply apply the partial factor of 1.4 as the code requires. However, when undrained analysis is performed with effective
stress parameters, cu is not input but it is the result of
the soil model used. What is usually overlooked dur-ing the design is that the designer should always
check that the calculated cu profile corresponds to the
characteristic one, factored by a specified sufficient value. While there is still an ongoing debate, the au-thors understand that the members of EG4 (the EC7 Evolution Group working on numerical methods) have agreed on a value of 1.4.
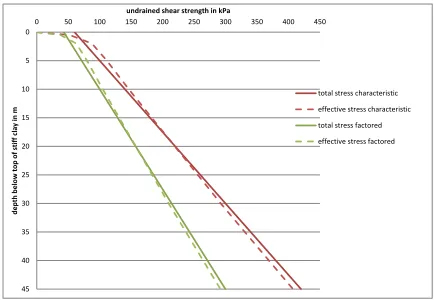
A series of triaxial undrained compression single element tests were performed with MC, SS, HS and HSS soil parameters at different depths (0.5, 2, 5, 10, 15, 30 and 45m below ground level) following iso-tropic consolidation. The SS parameters are based on the ones used by Schütz (2006). A pre-consolidation pressure of 2000kPa is applied while an under-drained profile is assumed in all cases. It can be seen in Figure 11 that, for this heavily overconsolidated clay, the calculated characteristic undrained shear strength profile from MC, SS and HS triaxial un-drained compression tests (in effective stresses) are
identical and in close agreement with the assumed cu
profile in total stresses.
0 5 10 15 20 25 30 35 40 45
0 50 100 150 200 250 300 350 400 450
d e p th b e lo w to p o f st if f cl a y i n m
undrained shear strength in kPa
total stress characteristic effective stress characteristic total stress factored effective stress factored
Figure 11. Characteristic and design undrained shear strength
pro-files using total and effective stress MC, HS and HSS parameters
Also, factoring tan ’ by 1.4 produces a set of
[image:6.536.46.262.406.539.2] [image:6.536.277.494.423.573.2]where the undrained strength is factored by a partial
factor cu=1.4. The agreement is not good with HSS
model as the stress path is different (see Figure 12).
0 20 40 60 80 100 120
-120 -100 -80 -60 -40 -20 0
q
i
n
k
P
a
p' in kPa
[image:7.536.46.261.125.266.2]HSS SS HS MC failure line
Figure 12. p-q stress paths using different soil models
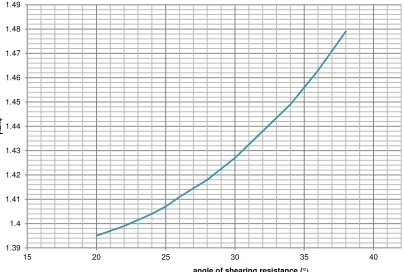
1.39 1.4 1.41 1.42 1.43 1.44 1.45 1.46 1.47 1.48 1.49
15 20 25 30 35 40
tan
angle of shearing resistance ()
Figure 13. tan’ for different values of angle of shearing resistance
Figure 13 gives the value of tan’ for different
values of angle of shearing resistance that results in a
calculated cu profile equal to the characteristic one,
factored by 1.4. The graph enables the designer to
use appropriate values of tan ’ when undrained
anal-ysis is performed with effective stress parameters. However, the graph is only correct when the triaxial stress path is vertical (in this case for the MC, HS and SS models). It is more difficult to draw general rules for non-vertical stress paths.
6 CONCLUSIONS
While a broader study is needed, some useful conclusions can be drawn from the work done in this article:
Use of more advanced soil models such as the HS
and HSS Plaxis models can result in much smaller differences in calculated prop loads from the differ-ent material factoring strategies for the geometries and materials considered in this study and for total stress analysis.
The choice between the two DA1-2 strategies is
not important in practice to DA1 so long as the de-sign is governed by DA1-1.
When using effective stress parameters for
un-drained analysis, the designer should always check that the calculated cu profile corresponds to the char-acteristic one, factored by 1.4 as EC7 requires.
REFERENCES
Katsigiannis, G. Ferreira, P. & Fuentes, R. 2014. Ultimate Limit State design of retaining walls with numerical methods. Proceed-ings, 8th European Conference on Numerical Methods in Ge-otechnical Engineering (Eds: Hicks,M.A., Brinkgreve, R.B.J. & Rohe, A.), Volume 1, 385-389. CRC Press.
Potts, D.M. & Zdravkovic, L. 2012. Accounting for partial materi-al factors in numericmateri-al anmateri-alysis, Géotechnique 62, 1053–1065. Schütz, R. 2006. Numerical analysis of deep excavations in Lon-don Clay. Diploma Thesis Graz University of Technology. Schweiger, H.F. 2010. Numerical analysis of deep excavations and tunnels in accordance with EC7 design approaches, Proceedings, Int. Conference Geotechnical Challenges in Megacities (Eds: Petrukhin, Ulitsky, Kolybin, Lisyuk, Kholmyansky), Moskau, 7.-10.6.2010, Vol. 1, 206-217
Simpson, B. 2012. Eurocode 7 – fundamental issues and some im-plications for users, Keynote Lecture, Proceedings, Nordic Ge-otechnical Meeting 2012, DGF Bulletin 27.
[image:7.536.54.256.301.437.2]