Editorial
Charting the Course for Future Developments in
Marine Geomorphometry: An Introduction to the
Special Issue
Vanessa Lucieer1,* , Vincent Lecours2 and Margaret F. J. Dolan3
1 Institute for Marine and Antarctic Studies, University of Tasmania, Tasmania 7000, Australia
2 Fisheries & Aquatic Sciences | Geomatics, School of Forest Resources & Conservation, University of Florida, Gainesville, FL 32653, USA; [email protected]
3 Geological Survey of Norway (NGU), Postal Box 6315 Torgarden, NO-7491 Trondheim, Norway;
* Correspondence: [email protected]; Tel.: +61-3-6226-6931
Received: 7 December 2018; Accepted: 10 December 2018; Published: 13 December 2018
Abstract: The use of spatial analytical techniques for describing and classifying seafloor terrain has become increasingly widespread in recent years, facilitated by a combination of improved mapping technologies and computer power and the common use of Geographic Information Systems. Considering that the seafloor represents 71% of the surface of our planet, this is an important step towards understanding the Earth in its entirety. Bathymetric mapping systems, spanning a variety of sensors, have now developed to a point where the data they provide are able to capture seabed morphology at multiple scales, opening up the possibility of linking these data to oceanic, geological, and ecological processes. Applications of marine geomorphometry have now moved beyond the simple adoption of techniques developed for terrestrial studies. Whilst some former challenges have been largely resolved, we find new challenges constantly emerging from novel technology and applications. As increasing volumes of bathymetric data are acquired across the entire ocean floor at scales relevant to marine geosciences, resource assessment, and biodiversity evaluation, the scientific community needs to balance the influx of high-resolution data with robust quantitative processing and analysis techniques. This will allow marine geomorphometry to become more widely recognized as a sub-discipline of geomorphometry as well as to begin to tread its own path to meet the specific challenges that are associated with seabed mapping. This special issue brings together a collection of research articles that reflect the types of studies that are helping to chart the course for the future of marine geomorphometry.
Keywords:bathymetry; digital terrain analysis; geomorphometry; geomorphology; habitat mapping; marine remote sensing
1. Introduction
Geomorphometry (or digital terrain analysis, digital terrain modelling) is the science of quantitative surface analysis [1,2] that evolved from mathematics, Earth sciences, and computer science [3]. Geomorphometry developed its roots in geomorphology, but its branches reached out to a variety of end-user disciplines, such as the environmental sciences, space exploration, and civil engineering [4]. The widespread integration of geomorphometric tools into Geographic Information Systems (GIS) made geomorphometric analyses accessible to a wide range of end-users, many of whom are not necessarily aware of the science underpinning the tools [5]. Over the last decade, efforts have been made (e.g., [6–13]) to bridge the gap between the discipline of geomorphometry, which has traditionally focused on terrestrial and planetary applications, and the marine sciences.
Geosciences2018,8, 477 2 of 9
Those efforts have resulted in the broader geomorphometry community becoming more aware of the challenges specific to the analysis of seafloor bathymetry data. Over the same period, the marine sciences community has become more aware of the field of geomorphometry, although some of its concepts, tools, and applications are still perhaps more widely recognized than others.
This special issue on Marine Geomorphometry is timely, as mutual recognition by the geomorphometry and marine sciences communities is higher than ever. The need to work together to solve emerging issues in quantitative seafloor analysis is also increasingly being acknowledged by both communities. This special issue explores existing and emerging trends where marine science applications and geomorphometry meet. As technology takes us deeper into the oceans and reveals its landscapes at increasingly higher resolution, there is much to learn about the seafloor. At the same time, it is important for the scientific community to show some restraint and critically assess the methods applied to analyze and explain these seafloor environments. Through this special issue, the community is demonstrating this restraint by questioning, assessing, and discussing the spatial geomorphometric techniques that they are applying to their seafloor data. The 17 papers in this issue address the five fundamental steps for implementing geomorphometric analysis, and these steps allow us to expose many of the important lessons learned to address various challenges. By continuing research along these lines, we will ensure that, as new characterization methods are developed, they are valid, repeatable, and robust to classification ontologies.
2. Five Steps to Implement Geomorphometric Analyses
The complete geomorphometry workflow involves five main steps [3]: sampling a surface, generating a digital terrain model (DTM) from the sampled surface, preprocessing the DTM (e.g., correcting for errors) for subsequent analyses, deriving terrain attributes and/or extracting terrain features from the DTM, and using and explaining those attributes and features in a given context. Early applications of marine geomorphometry often only focused on the analysis of the digital bathymetric model (DBM) and its application, disregarding the importance of the first three steps [7]. Over the last few years, however, end-user awareness about the impacts of the earlier steps of the geomorphometry workflow on applications has significantly increased [10]. The articles in this special issue highlight this trend, and Sections2.1–2.5summarize the contributions to this special issue according to each of those five steps.
2.1. Sampling the Depth of the Seafloor
Figure 1. The techniques used in the special issue to sample seafloor depths. Some articles combined multiple techniques. The category ‘other existing data’ includes, for example, navigational charts.
The use of radar altimetry to estimate depth has declined over the years due to its inability to capture seafloor morphology at scales relevant to many applications. Recognizing the poor state of global single-resolution ocean depth maps and the critical role that such knowledge plays in understanding our planet, the International Hydrographic Organization-Intergovernmental Oceanographic Commission (IHO-IOC) General Bathymetric Chart of the Oceans (GEBCO; information available at www.gebco.net) framework and the Nippon Foundation have joined forces to establish the Nippon Foundation-GEBCO Seabed 2030 Project. This represents an international effort with the objective of facilitating the complete mapping of the world’s oceans by 2030. The concept paper by Mayer et al. [20] outlines the ambitious Seabed 2030 initiative and the possibilities that these global data will bring to users worldwide and that will only be seen in the years to come. Methods to process these data will indeed require the support of the Global Data Assembly and Coordination Centre (GDACC), who will likely turn to the research community for efficient and robust spatial-data-processing methods to extract common and valuable variables of interest to the international marine community. This special issue provides a relevant summary of these methods (cf. Section 2.4) and the applications of these to multidisciplinary research (cf. Section 2.5).
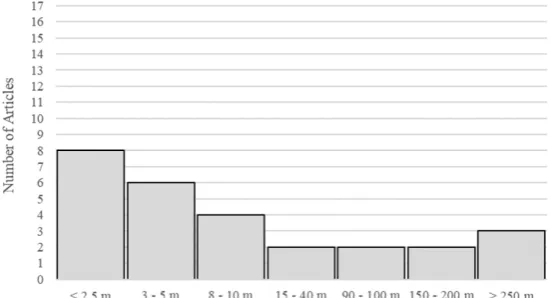
[image:3.595.160.436.604.753.2]In managing the oceans, it is widely recognized that one must first acknowledge their nature as a system, and in the large marine ecosystem paradigm, our perception of it is influenced by the scales at which they are examined, which are directly dependent on the sampling technique. Figure 2 shows that applications presented in this special issue looked at geosystems and ecosystems at a wide range of spatial scales. Finer-resolution data were most often produced by optical means (i.e., lidar and satellite imagery) and by acoustic means in shallower waters, while broader-resolution data were produced by acoustic methods in deeper waters and by using datasets with sparse coverage (cf. Section 2.2).
Figure 1.The techniques used in the special issue to sample seafloor depths. Some articles combined multiple techniques. The category ‘other existing data’ includes, for example, navigational charts.
The use of radar altimetry to estimate depth has declined over the years due to its inability to capture seafloor morphology at scales relevant to many applications. Recognizing the poor state of global single-resolution ocean depth maps and the critical role that such knowledge plays in understanding our planet, the International Hydrographic Organization-Intergovernmental Oceanographic Commission (IHO-IOC) General Bathymetric Chart of the Oceans (GEBCO; information available atwww.gebco.net) framework and the Nippon Foundation have joined forces to establish the Nippon Foundation-GEBCO Seabed 2030 Project. This represents an international effort with the objective of facilitating the complete mapping of the world’s oceans by 2030. The concept paper by Mayer et al. [20] outlines the ambitious Seabed 2030 initiative and the possibilities that these global data will bring to users worldwide and that will only be seen in the years to come. Methods to process these data will indeed require the support of the Global Data Assembly and Coordination Centre (GDACC), who will likely turn to the research community for efficient and robust spatial-data-processing methods to extract common and valuable variables of interest to the international marine community. This special issue provides a relevant summary of these methods (cf. Section2.4) and the applications of these to multidisciplinary research (cf. Section2.5).
In managing the oceans, it is widely recognized that one must first acknowledge their nature as a system, and in the large marine ecosystem paradigm, our perception of it is influenced by the scales at which they are examined, which are directly dependent on the sampling technique. Figure2shows that applications presented in this special issue looked at geosystems and ecosystems at a wide range of spatial scales. Finer-resolution data were most often produced by optical means (i.e., lidar and satellite imagery) and by acoustic means in shallower waters, while broader-resolution data were produced by acoustic methods in deeper waters and by using datasets with sparse coverage (cf. SectionGeosciences 2018, 8, x FOR PEER REVIEW 4 of 10 2.2).
Figure 2. The range of resolutions presented or discussed in the articles.
2.2. Generating a Digital Bathymetric Model
Methods to generate DBMs have not significantly changed in the last few years. For example, many studies, including [21], still use the CUBE (Combined Uncertainty and Bathymetric Estimator) algorithm [22] to grid multibeam echosounder data. Given the costs that are associated with collecting bathymetric data over large areas of seafloor, there has also been a growing interest in using data fusion to combine existing data from multiple sources. Zimmermann and Prescott [23] accomplished the feat of combining 18 million data points from more than 200 individual sources to produce the best bathymetric model to date of the Eastern Bering Sea, enabling them to study 29 canyons in the area and to confirm the legendary status of some pinnacles. Bourguignon et al. [24] used single-beam echosounders data and chart data to produce a 200-m resolution DBM by interpolating more than 150,000 points.
In some cases, the costs of data collection are not the only impediments to the production of DBMs, but our inability to travel through time may be: Goswami et al. [25]presented an innovative approach to produce a DBM representing a reconstruction of paleobathymetry from 94 Ma, with implications for paleoclimate studies, among others. This new bathymetric model at 0.1° × 0.1° resolution improves upon present global paleoclimate simulation model layers that are developed from bathtub-like, flat, featureless ocean bathymetry models, which are neither realistic nor suitable. This approach represents an important step forward for this type of application.
2.3. Preprocessing
Unlike in terrestrial applications of geomorphometry, for which DTMs need to be hydrologically corrected (e.g., by removing sinks), the preparation of DBMs for marine applications mainly consists in correcting errors and artefacts that could not be accounted for during the processing of raw data to generate the DBM or filling in data gaps to facilitate analyses and reduce potential edge effects. For instance, Porskamp et al. [26]used Delaunay triangulation to stitch multiple datasets and fill any holes in the final product.
While simple methods to correct for different types of artefacts in DBMs are still lacking, the awareness of artefacts and their potential impacts on applications is now regularly acknowledged and reported on (e.g., Ryabchuck et al. [27]),which used to be very uncommon [28,29]. In this special issue, Hughes Clarke [30] addresses the main factors that affect data quality in bathymetric data collected using multibeam echosounders. Multibeam acoustic swath systems are the common instrument of choice for a full-coverage bathymetric survey. Within each swath of data, the variables
Geosciences2018,8, 477 4 of 9
2.2. Generating a Digital Bathymetric Model
Methods to generate DBMs have not significantly changed in the last few years. For example, many studies, including [21], still use the CUBE (Combined Uncertainty and Bathymetric Estimator) algorithm [22] to grid multibeam echosounder data. Given the costs that are associated with collecting bathymetric data over large areas of seafloor, there has also been a growing interest in using data fusion to combine existing data from multiple sources. Zimmermann and Prescott [23] accomplished the feat of combining 18 million data points from more than 200 individual sources to produce the best bathymetric model to date of the Eastern Bering Sea, enabling them to study 29 canyons in the area and to confirm the legendary status of some pinnacles. Bourguignon et al. [24] used single-beam echosounders data and chart data to produce a 200-m resolution DBM by interpolating more than 150,000 points.
In some cases, the costs of data collection are not the only impediments to the production of DBMs, but our inability to travel through time may be: Goswami et al. [25] presented an innovative approach to produce a DBM representing a reconstruction of paleobathymetry from 94 Ma, with implications for paleoclimate studies, among others. This new bathymetric model at 0.1◦×0.1◦resolution improves upon present global paleoclimate simulation model layers that are developed from bathtub-like, flat, featureless ocean bathymetry models, which are neither realistic nor suitable. This approach represents an important step forward for this type of application.
2.3. Preprocessing
Unlike in terrestrial applications of geomorphometry, for which DTMs need to be hydrologically corrected (e.g., by removing sinks), the preparation of DBMs for marine applications mainly consists in correcting errors and artefacts that could not be accounted for during the processing of raw data to generate the DBM or filling in data gaps to facilitate analyses and reduce potential edge effects. For instance, Porskamp et al. [26] used Delaunay triangulation to stitch multiple datasets and fill any holes in the final product.
While simple methods to correct for different types of artefacts in DBMs are still lacking, the awareness of artefacts and their potential impacts on applications is now regularly acknowledged and reported on (e.g., Ryabchuck et al. [27]), which used to be very uncommon [28,29]. In this special issue, Hughes Clarke [30] addresses the main factors that affect data quality in bathymetric data collected using multibeam echosounders. Multibeam acoustic swath systems are the common instrument of choice for a full-coverage bathymetric survey. Within each swath of data, the variables of distance, azimuth, and elevation angles will influence significantly the quality of the data. This variability will translate through to the DBM and subsequent users, if unfamiliar with the original acquisition geometry, may potentially misinterpret such variability as real attributes on the seabed, particularly if the artefacts are at the same scale as the morphologic features of interest [31]. Hughes Clarke [30] warns of the uncertainty that can arise with the ever-increasing ambition of higher-resolution data and cautions that relief close to either the resolution limit or the scale of artefacts increases the risk of over-interpretation by morphological studies.
2.4. Analysing the Digital Bathymetric Model
Geosciences2018,8, 477 5 of 9 of distance, azimuth, and elevation angles will influence significantly the quality of the data. This variability will translate through to the DBM and subsequent users, if unfamiliar with the original acquisition geometry, may potentially misinterpret such variability as real attributes on the seabed, particularly if the artefacts are at the same scale as the morphologic features of interest [31]. Hughes Clarke [30] warns of the uncertainty that can arise with the ever-increasing ambition of higher-resolution data and cautions that relief close to either the higher-resolution limit or the scale of artefacts increases the risk of over-interpretation by morphological studies.
2.4. Analysing the Digital Bathymetric Model
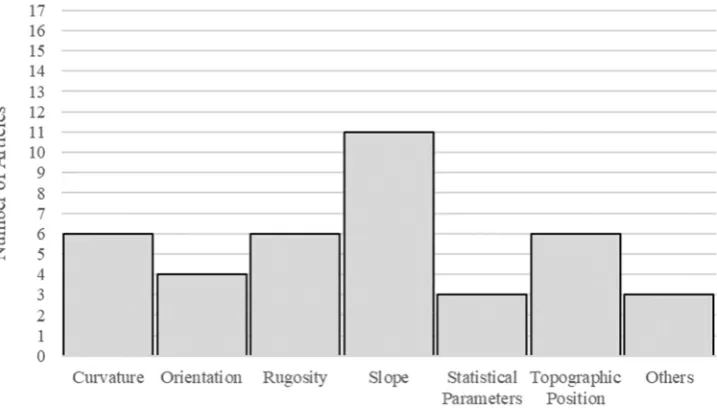
[image:5.595.121.480.88.293.2]There has not been much change in terms of general geomorphometry (which focuses on the derivation of terrain attributes) since the reviews by Lecours et al. [7,10]. As identified in Figure 3, slope remains the most commonly used terrain attribute, followed by measures of curvature, rugosity, and topographic position. Tools to automatically compute and analyze those measures are, however, increasingly being developed and made available to the broader community (see examples in [7]). In this special issue, Walbridge et al. [14] offers a review of such tools and toolboxes and presents the most recent developments to their Benthic Terrain Modeler (BTM) toolbox.
Figure 3. The categories of terrain attributes used in the articles of the special issue.
Specific geomorphometry, i.e., the branch of geomorphometry that deals with the extraction of terrain objects/features, is also well-represented in this special issue. Di Stefano and Mayer [21] developed a scale-based model for extracting and quantifying characteristics of submarine landforms (mainly sand dunes, ripples, mega ripples, and coral reefs) from high-resolution digital bathymetry. Their approach follows a two-part procedure wherein the first part the model extracts terrain features based on differential geometry principles and the second part evaluates the models for their relationships to scale-dependency, simulating their sensitivity to variation in the input parameters. Diesing and Thorsnes [32] present a methodology that combines image segmentation and random forest spatial prediction with the aim to derive maps of cold-water coral carbonate mounds with associated, spatially explicit measures of confidence. This approach is successful in mapping the presence and absence of carbonate mounds with high accuracy and confidence and shows promise for more widespread application. The variables used to facilitate carbonate mound detection include curvature, roughness, length, width, and bathymetric position index, demonstrating how general geomorphometry underpins further applied analysis and modelling. Finally, Masetti et al. [33] adapted the geomorphons concept introduced by Jasiewicz and Stepinski [34] for terrestrial and planetary settings to make it more meaningful for the study of marine bedforms. The identified “bathymorphons”, a term used by the authors, provide a robust and flexible way to segment acoustic
Figure 3.The categories of terrain attributes used in the articles of the special issue.
Specific geomorphometry, i.e., the branch of geomorphometry that deals with the extraction of terrain objects/features, is also well-represented in this special issue. Di Stefano and Mayer [21] developed a scale-based model for extracting and quantifying characteristics of submarine landforms (mainly sand dunes, ripples, mega ripples, and coral reefs) from high-resolution digital bathymetry. Their approach follows a two-part procedure wherein the first part the model extracts terrain features based on differential geometry principles and the second part evaluates the models for their relationships to scale-dependency, simulating their sensitivity to variation in the input parameters. Diesing and Thorsnes [32] present a methodology that combines image segmentation and random forest spatial prediction with the aim to derive maps of cold-water coral carbonate mounds with associated, spatially explicit measures of confidence. This approach is successful in mapping the presence and absence of carbonate mounds with high accuracy and confidence and shows promise for more widespread application. The variables used to facilitate carbonate mound detection include curvature, roughness, length, width, and bathymetric position index, demonstrating how general geomorphometry underpins further applied analysis and modelling. Finally, Masetti et al. [33] adapted the geomorphons concept introduced by Jasiewicz and Stepinski [34] for terrestrial and planetary settings to make it more meaningful for the study of marine bedforms. The identified “bathymorphons”, a term used by the authors, provide a robust and flexible way to segment acoustic seafloor data based on principles of topographic openness, pattern recognition, texture classification, object similarity, and multi-modality.
2.5. Applications
Geosciences2018,8, 477 6 of 9
of a deep-water level fall in the Early Holocene and multiple water-level fluctuations during this period. Also, in this special issue, Gafeira et al. [36] introduced a semi-automated approach to spatially delineate pockmarks of different shapes and sizes in different geological settings. Their approach proved to be less subjective and faster than traditional methods, such as manual expert identification and delineation. Sánchez-Guillamón et al. [37] used morphometry and size to classify deep seafloor mounds, such as domes and volcanoes, in the Canary Basin and proposed a growth model of those mounds informed by their geomorphometric characteristics.
Geosciences 2018, 8, x FOR PEER REVIEW 6 of 10
seafloor data based on principles of topographic openness, pattern recognition, texture classification, object similarity, and multi-modality.
2.5. Applications
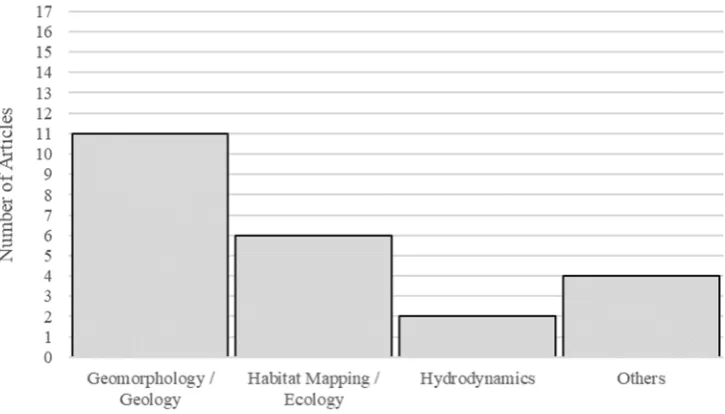
[image:6.595.117.480.194.401.2]In line with the review by Lecours et al. [10], the two main applications of marine geomorphometry remain in the general fields of geomorphology and habitat mapping (Figure 4). While Figure 4 shows a stronger representation of geomorphology, we note that the publisher for this special issue might have influenced the relative proportions of submissions from each field. Gardner [35] studied the Mendocino Channel, a deep-water sinuous channel, and quantitatively described its morphology and structural maintenance. The author asserts that the formation, maintenance, and modification of the Mendocino Channel have occurred through a combination of significant and numerous earthquakes and wave loading resuspension by storms forming turbidity currents. Ryabchuk et al. [27] used both a multibeam echosounder and a sub-bottom profiler to identify and map submerged glacial and post-glacial geomorphological features, enabling them to interpret the sedimentation regimes of two post-glacial basins in the Gulf of Finland. The geomorphological analysis has led to the identification of Late Pleistocene sediment and more modern bottom relief, which together indicated the occurrence of a deep-water level fall in the Early Holocene and multiple water-level fluctuations during this period. Also, in this special issue, Gafeira et al. [36] introduced a semi-automated approach to spatially delineate pockmarks of different shapes and sizes in different geological settings. Their approach proved to be less subjective and faster than traditional methods, such as manual expert identification and delineation. Sánchez-Guillamón et al. [37] used morphometry and size to classify deep seafloor mounds, such as domes and volcanoes, in the Canary Basin and proposed a growth model of those mounds informed by their geomorphometric characteristics.
Figure 4. The categories of applications that were presented in the special issue. Some articles had multiple applications; for instance, when the geomorphology was interpreted and then used to map habitats.
It is also noteworthy that many studies have both a geomorphological focus and a habitat-mapping focus that complement each other. For instance, Greene et al. [38]studied deep-water sand wave fields in the San Juan Archipelago of the Salish Sea, which form habitat for Pacific sand lances and sand-eels. Of note, their interpretation of the features and habitats also considers the complex hydrodynamics of the area. Linklater et al. [15]examined and compared reef morphology around the subtropical island shelves of Lord Howe Island and Balls Pyramid in the Southwest Pacific Ocean for the first time. Diverse accretionary and erosional geomorphic features were mapped, with highlights
Figure 4. The categories of applications that were presented in the special issue. Some articles had multiple applications; for instance, when the geomorphology was interpreted and then used to map habitats.
3. Discussion
Geomorphometric analysis continues to evolve across each of the five themes mentioned in this paper. There are several questions in seafloor quantitative characterization research that will occupy our attention for decades to come and for which this special issue may progress discussion. There is a complex interplay where new developments in this field will ebb between improved data collection and data-processing technique to create higher-resolution and more accurate DBMs and workflows with improved big data processing algorithms to handle larger and more complex automated methodologies for feature extraction. As the paper by Mayer et al. [20] rightly points out, new approaches to seafloor mapping will particularly enhance efficiency and coverage. However, as Hughes-Clarke [30] identifies, analysts unfamiliar with acquisition geometry may potentially misinterpret variability in the data as geomorphometric features, and similarly, sparse depth soundings can lead to a false impression of flat seabed terrain. Bathymetric coverage of the seabed at various resolutions builds up the quest for robust methods for the production and analysis of multiscale DBMs, which perhaps will become the next major demand for marine geomorphometry. Methods for multiscale grid structure applied to bathymetric data have been recently explored by Maleika et al. [40], whilst options for the generation of multiresolution surfaces are now available in some multibeam processing software [41]. Further down the line, data end-users now have the option to merge datasets at multiple resolutions and use these directly in an analysis through data management solutions, such as the ESRI®Mosaic Dataset. It is essential for the future integrity of marine geomorphometry that these various types of multiresolution DBMs are produced and analyzed with due regard for the additional complexities of multiresolution surfaces, supported by adequate documentation to make the methods transparent and verifiable. It seems likely that terrain analysis methods focused on an analysis of distance rather than pixels will become more applicable in providing suitable outputs from multiresolution surfaces.
Seafloor mapping is inherently a multidisciplinary task—a mix of hydrography, computer science, engineering, physics, and mathematics—that also delivers valuable data to many more disciplines, such as marine geology, oceanography, biology, habitat and species prediction modelling, remote sensing, and hydrographic surveying. New applications for marine geomorphometry will continue to be discovered as high-resolution data and marine geomorphometry becomes valued by even more applications, such as seafloor energy harvesting, marine archeology, and deep-sea resource assessment. Any new application areas will bring with them new challenges to marine geomorphometric analysis, which can best be met through a strong partnership between those advancing marine remote sensing and those developing geospatial techniques. We hope that this special issue identifies a breadth of perspectives and integrates ideas that will help to further establish the discipline of marine geomorphometry and provide the conduit to solve these future challenges.
Author Contributions:V.L. (Vanessa Lucieer), V.L. (Vincent Lecours), and M.F.J.D. conceived and designed the special review. V.L. (Vanessa Lucieer), V.L. (Vincent Lecours), and M.F.J.D. equally contributed to the writing of this paper.
Funding:This work was supported by the National Environmental Science Program (NESP) Marine Biodiversity Hub at the University of Tasmania (Lucieer), the University of Florida (Lecours) and the Geological Survey of Norway (Dolan).
Acknowledgments:We wish to thank all the authors and co-authors who published in this special issue, and the reviewers that have contributed to the success of this collection of high-quality and broad impact research.
Conflicts of Interest:The authors declare no conflict of interest.
References
1. Pike, R.J. Geomorphometry: Progress, practice, and prospect.Z. Geomorphol.1995,101, 221–238.
Geosciences2018,8, 477 8 of 9
3. Pike, R.J.; Evans, I.S.; Hengl, T. Geomorphometry: A Brief Guide, Geomorphometry—Concepts, Software, Applications; Hengl, T., Reuter, H.I., Eds.; Elsevier: Amsterdam, The Netherlands, 2009; Volume 33, pp. 3–30. 4. Bishop, M.P.; James, L.A.; Shroder, J.F., Jr.; Walsh, S.J. Geospatial technologies and digital geomorphological
mapping: Concepts, issues and research.Geomorphology2012,137, 5–26. [CrossRef]
5. Bishop, M.P.; Shroder, J.F., Jr. GIScience and mountain geomorphology: Overview, feedbacks, and research directions. InGeographic Information Science and Mountain Geomorphology; Springer Science & Business Media: Berlin, Germany, 2004.
6. Bouchet, P.J.; Meeuwig, J.J.; Salgado Kent, C.P.; Letessier, T.B.; Jenner, C.K. Topographic determinants of mobile vertebrate predator hotspots: current knowledge and future directions.Biol. Rev.2015,90, 699–728. [CrossRef] [PubMed]
7. Lecours, V.; Dolan, M.F.J.; Micallef, A.; Lucieer, V.L. A review of marine geomorphometry, the quantitative study of the seafloor.Hydrol. Earth Syst. Sci.2016,20, 3207–3244. [CrossRef]
8. Lecours, V.; Lucieer, V.; Dolan, M.F.J.; Micallef, A. An ocean of possibilities: Applications and challenges of marine geomorphometry. InGeomorphometry for Geosciences; Jasiewicz, J., Zwoli ´nski, Z., Mitasova, H., Hengl, T., Eds.; Adam Mickiewicz University in Pozna ´n—Institute of Geoecology and Geoinformation: Poznan, Poland; pp. 23–26.
9. Lecours, V.; Dolan, M.; Micallef, A.; Lucieer, V. Geomorphometry in marine habitat mapping: Lessons learned from the past 10 years of applications. In Proceedings of the 15th International Symposium GeoHab, Winchester, UK, 2–6 May 2016; 2016.
10. Lecours, V.; Lucieer, L.; Dolan, M.F.J.; Micallef, A. Recent and future trends in marine geomorphometry. In Proceedings of the Geomorphometry 2018, Boulder, CO, USA, 13–17 August 2018; pp. 1–4.
11. Lundblad, E.R.; Wright, D.J.; Miller, J.; Larkin, E.M.; Rinehart, R.; Naar, D.F.; Donahue, B.T.; Anderson, S.M.; Battista, T. A Benthic Terrain Classification Scheme for American Samoa. Mar. Geodesy2006,29, 98–111. [CrossRef]
12. Micallef, A.; Lecours, V.; Dolan, M.F.J.; Lucieer, V.L. Marine geomorphometry: Overview and opportunities. In Proceedings of the EGU General Assembly 2016, Vienna, Austria, 17–22 April 2016.
13. Wilson, M.; O’Connell, B.; Brown, C.; Guinan, J.C.; Grehan, A.J. Multiscale terrain analysis of multibeam bathymetry data for habitat mapping on the continental slope.Mar. Geodesy2007,30, 3–35. [CrossRef] 14. Walbridge, S.; Slocum, N.; Pobuda, M.; Wright, D. Unified Geomorphological Analysis Workflows with
Benthic Terrain Modeler.Geosciences2018,8, 94. [CrossRef]
15. Linklater, M.; Hamylton, S.; Brooke, B.; Nichol, S.; Jordan, A.; Woodroffe, C. Development of a Seamless, High-Resolution Bathymetric Model to Compare Reef Morphology around the Subtropical Island Shelves of Lord Howe Island and Balls Pyramid, Southwest Pacific Ocean.Geosciences2018,8, 11. [CrossRef]
16. Stumpf, R.P. Retrospective and future studies of coastal water clarity and sediment loads. In Proceedings of the Third Thematic Conference on Remote Sensing for Marine and Coastal Environments, Seattle, WA, USA, 18–20 September 1995; pp. 376–377.
17. Lyzenga, D.R.; Malinas, N.P.; Tanis, F.J. Multispectral bathymetry using a simple physically based algorithm. IEEE Trans. Geosci. Remote Sens.2006,44, 2251–2259. [CrossRef]
18. Traganos, D.; Reinartz, P. Mapping Mediterranean seagrasses with Sentinel-2 imagery.Mar. Pollut. Bull. 2018,134, 197–209. [CrossRef]
19. Hodúl, M.; Bird, S.; Knudby, A.; Chénier, R. Satellite derived photogrammetric bathymetry. ISPRS J. Photogramm. Remote Sens.2018,142, 268–277. [CrossRef]
20. Mayer, L.; Jakobsson, M.; Allen, G.; Dorschel, B.; Falconer, R.; Ferrini, V.; Lamarche, G.; Snaith, H.; Weatherall, P. The Nippon Foundation—GEBCO Seabed 2030 Project: The Quest to See the World’s Oceans Completely Mapped by 2030.Geosciences2018,8, 63. [CrossRef]
21. Di Stefano, M.; Mayer, L. An Automatic Procedure for the Quantitative Characterization of Submarine Bedforms.Geosciences2018,8, 28. [CrossRef]
22. Calder, B.R. Automatic statistical processing of multibeam echosounder data. Int. Hydrogr. Rev.2003,4, 53–68.
24. Bourguignon, S.; Bastos, A.; Quaresma, V.; Vieira, F.; Pinheiro, H.; Amado-Filho, G.; de Moura, R.; Teixeira, J. Seabed Morphology and Sedimentary Regimes defining Fishing Grounds along the Eastern Brazilian Shelf. Geosciences2018,8, 91. [CrossRef]
25. Goswami, A.; Hinnov, L.; Gnanadesikan, A.; Young, T. Realistic Paleobathymetry of the Cenomanian–Turonian (94 Ma) Boundary Global Ocean.Geosciences2018,8, 21. [CrossRef]
26. Porskamp, P.; Rattray, A.; Young, M.; Ierodiaconou, D. Multiscale and Hierarchical Classification for Benthic Habitat Mapping.Geosciences2018,8, 119. [CrossRef]
27. Ryabchuk, D.; Sergeev, A.; Krek, A.; Kapustina, M.; Tkacheva, E.; Zhamoida, V.; Budanov, L.; Moskovtsev, A.; Danchenkov, A. Geomorphology and Late Pleistocene–Holocene Sedimentary Processes of the Eastern Gulf of Finland.Geosciences2018,8, 102. [CrossRef]
28. Lecours, V.; Devillers, R.; Edinger, E.N.; Brown, C.J.; Lucieer, V.L. Influence of artefacts in marine digital terrain models on habitat maps and species distribution models: A multiscale assessment. Remote Sens. Ecol. Conserv.2017,3, 232–246. [CrossRef]
29. Lecours, V.; Devillers, R.; Lucieer, V.L.; Brown, C.J. Artefacts in marine digital terrain models: A multiscale analysis of their impact on the derivation of terrain attributes. IEEE Trans. Geosci. Remote Sens.2017,55, 5391–5406. [CrossRef]
30. Hughes Clarke, J. The Impact of Acoustic Imaging Geometry on the Fidelity of Seabed Bathymetric Models. Geosciences2018,8, 109. [CrossRef]
31. Spina, R. The pockmark stars: Radial structures in the seabed surrounding the Hawaii Islands. J. Environ. Geol.2017,1, 33–50. [CrossRef]
32. Diesing, M.; Thorsnes, T. Mapping of Cold-Water Coral Carbonate Mounds Based on Geomorphometric Features: An Object-Based Approach.Geosciences2018,8, 34. [CrossRef]
33. Masetti, G.; Mayer, L.; Ward, L. A Bathymetry- and Reflectivity-Based Approach for Seafloor Segmentation. Geosciences2018,8, 14. [CrossRef]
34. Jasiewicz, J.; Stepinski, T.F. Geomorphons-a pattern recognition approach to classification and mapping of landforms.Geomorphology2012,182, 147–156. [CrossRef]
35. Gardner, J. The Morphometry of the Deep-Water Sinuous Mendocino Channel and the Immediate Environs, Northeastern Pacific Ocean.Geosciences2017,7, 124. [CrossRef]
36. Gafeira, J.; Dolan, M.; Monteys, X. Geomorphometric Characterization of Pockmarks by Using a GIS-Based Semi-Automated Toolbox.Geosciences2018,8, 154. [CrossRef]
37. Sánchez-Guillamón, O.; Fernández-Salas, L.; Vázquez, J.-T.; Palomino, D.; Medialdea, T.; López-González, N.; Somoza, L.; León, R. Shape and Size Complexity of Deep Seafloor Mounds on the Canary Basin (West to Canary Islands, Eastern Atlantic): A DEM-Based Geomorphometric Analysis of Domes and Volcanoes. Geosciences2018,8, 37. [CrossRef]
38. Greene, H.; Cacchione, D.; Hampton, M. Characteristics and Dynamics of a Large Sub-Tidal Sand Wave Field—Habitat for Pacific Sand Lance (Ammodytes personatus), Salish Sea, Washington, USA.Geosciences 2017,7, 107. [CrossRef]
39. Picard, K.; Radke, L.; Williams, D.; Nicholas, W.; Siwabessy, P.; Howard, F.; Gafeira, J.; Przeslawski, R.; Huang, Z.; Nichol, S. Origin of High Density Seabed Pockmark Fields and Their Use in Inferring Bottom Currents.Geosciences2018,8, 195. [CrossRef]
40. Maleika, W.; Koziarski, M.; Forczma ´nski, P. A Multiresolution Grid Structure Applied to Seafloor Shape Modeling.ISPRS Int. J. Geo-Inf.2018,7, 119. [CrossRef]
41. Holland, M.; Hoggarth, A. Hydrographic processing considerations in the big data age: A focus on techonolgy trends in ocean and coastal surveys. IOP Conf. Ser.: Earth Environ. Sci. 2016, 34, 012016. [CrossRef]