ANTIMICROBIAL SUSCEPTIBILITY TESTING
THROUGH IMAGE ANALYSIS
Dissertation submitted to
T
he Tamil Nadu Dr. M. G. R. Medical University,
Chennai
in partial fulfillment of the award of degree of
MASTER OF PHARMACY
(PHARMACEUTICAL BIOTECHNOLOGY)
Submitted by
MUNAVIR.M.K.Under the guidance of
Dr.D.C. SUNDARAVELAN, M. Pharm., Ph.D. Department of Pharmaceutical Biotechnology
MARCH – 2009
COLLEGE OF PHARMACY
ANTIMICROBIAL SUSCEPTIBILITY TESTING
THROUGH IMAGE ANALYSIS
Dissertation submitted to
T
he Tamil Nadu Dr. M. G. R. Medical University,
Chennai
in partial fulfillment of the award of degree of
MASTER OF PHARMACY
(PHARMACEUTICAL BIOTECHNOLOGY)
MARCH – 2009
COLLEGE OF PHARMACY
CERTIFICATE
This is to certify that the dissertation entitled "ANTIMICROBIAL SUSCEPTIBILITY
TESTING THROUGH IMAGE ANALYSIS" being submitted to The Tamil Nadu Dr.M.G.R.
Medical University, Chennai in partial fulfillment of the Master of Pharmacy programme in
Pharmaceutical Biotechnology, carried out by Mr. MUNAVIR. M.K. in the Department of Pharmaceutical Biotechnology, College of Pharmacy, SRIPMS, Coimbatore, under supervision and direct guidance of Dr. D.C. SUNDARAVELAN, M.Pharm, Ph.D. to my fullest satisfaction.
Prof. S. Krishnan, M.Pharm., (Ph.D). Head, Department of Pharmaceutical Biotechnology, College of Pharmacy, SRIPMS, Coimbatore – 44
Place: Coimbatore
CERTIFICATE
This is to certify that the dissertation entitled "ANTIMICROBIAL SUSCEPTIBILITY
TESTING THROUGH IMAGE ANALYSIS" was carried out by Mr. MUNAVIR.M.K., in the
Department of Pharmaceutical Biotechnology, College of Pharmacy, Sri Ramakrishna Institute of
Paramedical Sciences, Coimbatore, which is affiliated to The Tamil Nadu Dr.M.G.R. Medical University, Chennai, under supervision and direct guidance of Dr.D.C.Sundaravelan, M.Pharm,
Ph.D. Department of Pharmaceutical Biotechnology, College of Pharmacy, SRIPMS, Coimbatore – 44.
Dr. T. K. RAVI, M. Pharm., Ph. D., FAGE., Principal, College of Pharmacy, SRIPMS, Coimbatore – 44.
CERTIFICATE
This is to certify that the dissertation entitled "ANTIMICROBIAL SUSCEPTIBILITY TESTING THROUGH IMAGE ANALYSIS" being submitted to The Tamil Nadu Dr.M.G.R.
Medical University, Chennai in partial fulfillment of the Master of Pharmacy programme in
Pharmaceutical Biotechnology, carried out by Mr. MUNAVIR.M.K. in the Department of Pharmaceutical Biotechnology, College of Pharmacy, SRIPMS, Coimbatore, under my direct guidance
and supervision to my fullest satisfaction.
Dr. D.C. SUNDARAVELAN, M.Pharm., Ph.D.
Assistant Professor, Department of Pharmaceutical Biotechnology, College of Pharmacy, SRIPMS,
Coimbatore – 44.
Place: Coimbatore
ACKNOWLEDGEMENT
As he is the first and the last, I thankfully bow with reverence before the Almighty who is the source of all wisdom and knowledge, the creature who by his mercy and blessings made me to attain successful completion of this dissertation.
It gives me immense pleasure to record my gratitude and indebtedness to my guide Dr. D.C. Sundaravelan, M.Pharm, Ph.D., Department of Pharmaceutical Biotechnology, College of Pharmacy, SRIPMS for all his excellent suggestion,
invaluable guidance, constant inspiration, sustained interest and encouragement that he had given throughout my work.
I extol of my profound gratitude to Prof. S. Krishnan, M.Pharm, Ph.D, Head of the Department, Department of Pharmaceutical Biotechnology, for his valuable
suggestions and for providing all the facilities in the department.
It is my pleasure in expressing my sincere thanks to Dr. Sumita Singh, M.Sc, Ph.D, Assistant Professor, Mrs. R.M. Akila, M.Pharm, (Ph.D). Lecturer, and Mr. P. Bharathi, M.Pharm, LecturerDepartment of Pharmaceutical Biotechnology for their support during my post graduate programme.
My sincere thanks and gratitude to our Principal Dr. T.K.Ravi, M.Pharm, Ph.D, FAGE, for his valuable support without which this work would not have attained this standard.
Ms.SivaSindhu, Mrs. Karpagam and Mrs. Beula deserve applauds for their timely help during this dissertation work.
I submit my indelet thanks to my classmates for their support and cooperation during the course of my work.
I forward my awesome thanks to my seniors and my juniors and the euphoric company of my good friends, whose help, support and encouragement had always been a source of inspiration throughout my project work.
My special thanks to M/S. Computer Park for their timely help is completing the project works.
Above all commit myself before my father, mother, and brothers, they given constant love and encouragement who lure the credit of success in whatever work I do.
CONTENTS
S.NO. TOPICS PAGE NO.
1 Objectives 1
2 Introduction
• Determination of anitbiotic activity
• Zone of inhibition formation theory
• Action on petri plate
• Factors influecing diffusion test
• Image analysis
• Advantages of image analysis on petri plate evaluation
2-28
3 Review of Literature 29- 35
4 Experimental Section
• Apparatus and Materials
• Methodology
36 – 44
5 Results & Discussion 45 – 82
6 Conclusion 83 – 84
INTRODUCTION
To manage and treat patients with infectious disease intelligently, the physician must know specifically which organism is the causative and which drug at which concentration is curative. In diagnosing infectious diseases, then it is necessary to isolate and identify the specific causative organism, of infectious and to predict which drug is active against it. In general clinical laboratory procedures have come about as a result of a very thorough knowledge of the physiological behavior of the different microorganism and the curative agent against them. Tests that identify disease producing microorganism and suitable drugs demonstrate the value to the medical world of a good knowledge of ‘microbial physiology’. The portion of microbiology that deals with procedures for diagnosing infectious diseases is generally known as clinical microbiology.
Many times the physicians, when treating an infection, wishes to know not only which organism is involved but also what antibiotics may be used to manage the infection. Many antibiotics lose their effectiveness against certain kinds of bacteria and therefore it becomes very necessary to test each specific infection, using organisms taken from that infection, against a series of potentially effective antibiotics. Even if the identity of the organism is known antibiotic susceptibility test must be performed.
The well or disc diffusion method of antibiotic susceptibility evaluation is deceptively simple on the surface and tends to mask the variables that must be considered in making a clear evaluation.
surface in 12 to 18 hours.
A standardized technique, known as the Kirby Bauer method, is now widely used in clinical microbiology laboratories to evaluate the effectiveness of antibiotics on organisms isolated from infections. This technique has the advantage of predicting the clinical effectiveness of a given drug with reasonable accuracy by noting the diameter of the zones of inhibition and comparing this data with a standard chart (L. Jack Bradshaw, 1979).
But as technology developed the early detections of the zones of inhibition through image analysis is possible. This can be done by several ways.
DETERMINATION OF ANTIBIOTIC ACTIVITY
After a pathogen is cultured its sensitivity to specific antibiotics serves as a guide in choosing antimicrobial therapy. Some pathogen such as Streptococcus pyrogen and Neisseria meningitides, usually have predictable sensitivity patterns to certain antibiotics. Most gram negative bacilli, enterococci, and staphylococcal species often show unpredictable sensitivity pattern to various antibiotics, and require susceptibility testing to determine appropriate antimicrobial therapy. The disk diffusion method is useful when susceptibility to an unusual antibiotic, not available in automated systems is to be determined (William A Strohl et al., 2001).
Classical method of assaying antibiotics is the agar zone diffusion technique in which there is a linear relationship between the response and the dose. This technique is still widely used, even though it suffers from the disadvantages that it is unsatisfactory when results are needed rapidly (A Denver Russell et al., 1983).
Kirby-Bauer Antimicrobial Sensitivity Test
The drug sensitivities of many pathogenic microorganisms are known, but it is sometimes necessary to test several agents to determine the drug of choice. A standardized filter-paper disc-agar diffusion procedure, known as the Kirby-Bauer method, is frequently used to determine the drug sensitivity of microorganisms isolated from infectious processes. This method allows for the determination of the efficacy of a drug by measuring the diameter of the zone of inhibition that results from diffusion of the agent into the medium surround the disc. In this procedure, filter-paper discs of uniform size are impregnated with specified concentrations of different antibiotics and then placed on the surface of an agar plate that has been seeded with the organism to be tested. The medium of choice is Mueller-Hinton agar, with a pH of 7.2 to 7.4, which is poured into plates to a uniform depth of 5 mm and refrigerated on solidification. The plates are then heavily inoculated with a standardized inoculom by means of a cotton swab to ensure the confluent growth of the organism.
The plates are examined for the presence of growth inhibition, which is indicated by a clear zone surrounding each dis. The susceptibility of an organism to a drug is determined by the size of this zone, which itself is dependent on variables such as:
1. The ability and rate of diffusion of the antibiotic into the medium and its interaction with the test organism.
2. The number of organisms inoculated. 3. The growth rate of the organism.
4. The degree of sensitivity of the organism to the antibiotic.
Serial Dilution Tube Technique
Serial dilution tests in which the concentration gradient is discontinuous are frequently used to determine the antibiotic sensitivity of strains bacteria and to assay the antibiotic activity of body fluids during treatment.
To each of a series of sterile stopper test tube a standard volume of medium that will support the growth and the test organism is added. Solution of the antimicrobial agent is prepared in broth and a serious doubling dilution prepared with sterile pipettes. The range of concentrations should extend from at level twice the highest concentration likely to be found in the tissues during treatment to half that which inhibits the growth of the most sensitive member of the species being tested compare with tubes contain (a) medium without antibiotic and (b) uninoculated medium. The inoculum, consisting of a suitable dilution of an overnight broth culture of the test or standard control organism, is added, one loopful to each tube.
The tubes are incubated at 37degree C, for 24 hour and examined for turbidity. The tube with the highest dilution showing no visible turbidity is minimum inhibitory concentration (bacteriostatic concentration). To measure the bactericidal concentration it is necessary to subculture from the tubes showing no visible growth on the agar or into broth free of the microbial agent. The highest dilution is bring no growth is the bactericidal concentration. Where available, a special neutralizer of the antimicrobial agent should be used in the subculture medium (Robert Cruickshan K, 1972).
THEORY OF ANTIBIOTIC INHIBITION ZONE FORMATION
antibiotics through agar gels. The formula may be written:
X2 = 4 DT 2.3 (log m
o – log m1)
in which X = the distance between the source of the antibiotic and the edge of the zone of inhibition (i.e. the zone size); D = the diffusion coefficient of the antibiotic; T = the time taken for the zone to be fixed; mo = the antibiotic concentration at source; m1 = the
critical concentration of the antibiotic which inhibits the test organism under conditions of diffusion.
Diffusion Coefficient
An antibiotic diffuses into an agar gel from a point source at a constant rate depending on the chemical and physical properties of the gel and the ionic charge on diffusing molecules. Two factors significantly affect this constant.
(1) Temperature. Forces which bring about diffusion of molecules are proportional to the absolute temperature. Most microbiological assays are carried out under uniform temperature conditions and the diffusion coefficient for a given antibiotic is likely to be relatively constant).
(2) Viscosity of the solvent. The charge on the solvent molecules set up a resistance to the diffusing molecules and therefore reduces the rate of diffusion. Most assays use water as solvent but other solvent may strongly influence the diffusion coefficient. If other substances are dissolved in the antibiotic solution (e.g. sugars) this too will have an effect on the diffusion coefficient.
The concentration of antibiotic diffusing from a reservoir and the size of the zone of inhibition (X)
results in large zones being produced. Low concentrations do not drive the inhibitory concentration so far out into the agar and the zones are correspondingly smaller. Where the difference between mo and m’ is large the concentration gradient is steep and the
zone edge tends to be crisp: where they are similar the resultant shallow concentration gradient may be in diffuse zone edges.
Under the normal conditions of assay, mo may be considered to be constant
throughout the period T. However, in disc susceptibility tests, the concentration of antibiotic at source is not known. The disc is impregnated with a known amount of the drug but this dissolves in an unknown volume of water in the sensitivity agar. Hence the concentration cannot be determined and, for this reason, it is not possible to relate directly the sizes of zones produced by solutions of known concentrations with discs of known amounts (A Denver Russell et al., 1983).
Critical inhibitory concentration of the antibiotic (m1 and MIC)
For each antibiotic there is a minimum concentration (m1) diffusing from the
reservoir which inhibits each test organism under conditions of diffusion. This is constant for each organism: it can be determined by extrapolation and, being independent of many factors such as temperature of incubation and inoculum size, is one of the most accurate determinations of sensitivity.
Invariably the m1 value is 2 to 4 times greater than the minimum inhibitory
concentration (MIC) for the same organism. The methods by which each is determined, however, are intrinsically different. MICs are determined by exposing the organism directly to the antibiotic at different concentrations from time zero: the m’ value is the inhibitory concentration of the antibiotic reaching the growing organism with time by diffusion.
Usually zones are measured after at least overnight incubation. The zone however, is fixed very much earlier, usually after a few hours from time 0. Thereafter the test organism grows up outside the zone to render of the edge of the zone visible and measurable. The critical time (T) is the required for the critical inhibitory concentration (m1) to reach the position in the agar where the zone edge will be formed. This coincides
certain density of bacteria.
Growth of the test organism
Time T is also the time required for the inoculum to reach a certain bacterial density by growth. From the moment of incubation the inoculum on seeded agar plate follows the normal laws of growth. After an initial lag phase, the inoculum moves fairly rapidly into a log phase of growth having a relatively constant doubling time. The time taken to reach the critical density will be dependent on many factors, including the biological nature of the organism under test, and particularly its doubling time, the nutritional status of the medium, the temperature of incubation and the size of the inoculum used. With dense inocula the time required to reach this critical density will be much shorter than with a light inoculum. Also, if very dense inocula are used, no zones of inhibition will be obtained even with high concentration of antibiotics. This illustrates the fundamental difference between diffusion and incorporation methods of sensitivity testing (A Denver Russell et al., 1983).
Growth of Microorganism
Growth in a bacterial cell involves coordinated increase in the mass of its constituent parts; it is not simply an increase in total mass since this could be due, for example, to the accumulation of a storage compound within the cell.
Thus, growth and reproduction are closely linked in bacteria, and the term ‘growth’ is generally used to cover both processes.
Factors affecting growth of microorganism
Bacteria grow only if their environment is suitable; if it’s not optimal, growth may occur at a lower rate or not all – or the bacteria may die, depending on species and conditions.
Essential requirements for growth include (i) s supply of suitable nutrients; (ii) a source of energy; (iii) water (iv) an appropriate temperature; (v) an appropriate pH; (vi) appropriate levels (or the absence) of oxygen(Paul Singleton et al., 1995).
Methods of identifying organisms for diagnosis purpose
Direct microscopic visualizations
Cultivation and identification
Detection of microbial antigens
Detection of microbial RNA or DNA
Detection of host immune response
ACTIONS ON PETRI PLATE
FIG :1 Resistant
No zone: growth occurs right up to the disc. Intermediate
A narrow growth-free zone surrounds the disc. Sensitive
A wide growth-free zone surrounds the disc.
Enzyme inactivation
A narrow growth free zone surrounds the disc. Unlike the intermediate zone, the edge of the zone is sharply defined and it contains somewhat heavier growth with some normal-sized or relatively large colonies.
Selective Action
This result can be obtained e.g. when the inoculum consists of two different strains which differ in their degree of susceptibility to the given antibiotic. Close to the disc, the concentration of antibiotic is high enough to inhibit both strains (narrow growth-free zone). Further from the disc (lower concentration of antibiotic) one strain is still inhibited while the other can grow.
Control Comparison
The ‘half-zone’ obtained with a control strain (one side of the disc) is opposite the ‘half-zone’ obtained with the test strain (other side of the disc). To make this comparison, the test and control strains are inoculated onto separate halves of the plate and the disc is placed between them.
The inoculum contained a small proportion of mutant cells which were able to form colonies under conditions which inhibited non-mutants. The mutants are usually antibiotic-resistant cells. There is, however, another type of mutant which grows only in the presence of a given antibiotic, and such mutants would also form colonies in an otherwise growth-free zone; for example, ‘streptomycin dependent’ mutants contain non-functional ribosomes which, in the presence of streptomycin appear to distorted in such a way that they become functional.
Contamination
The inoculum contained a mixture of organisms, at least one of which is resistant to the antibiotic.
Synergism
The two discs contain different antibiotics. The zone shows an inhibitory effect which is greater than the sum of the effects of each antibiotic acting alone; that is, the antibiotics are acting synergically.
Antagonism
The two discs contain different antibiotics. Here, the presence of one antibiotic inhibits the activity of the other (Paul Singleton et al., 1995).
FACTORS INFLUENCING DIFFUSION TESTS
Many variables influence the final result of antimicrobial diffusion tests in different ways at the same time. The more important variables that are readily subjected to experimental control are outlined below:
i. Inoculum density
iv. Composition of the agar medium
v. Growth characteristics of the test strain vi. Temperature of Incubation
vii. Incubation time
viii. Timing of drug application
ix. Concentration of antimicrobial agents in the reservoir x. Presence of serum proteins
(i) Inoculum density
The size of inoculums is the single most important variable that influences the results of susceptibility tests. The position of the zone of inhibition is determined when the critical cell mass is obtained. More time is required to reach that cell mass when the inoculums is light; consequently, the critical concentration of drug can diffuse further, resulting is larger zones of inhibition. Heavy inocula tent to give small zones of inhibition. For susceptibility testing moderately heavy inoculums of about 106 viable
cells per 15cm Petri Plate is generally recommended.
(ii) Visualization of the zone edge
Zones of inhibition on susceptibility test plates can not be measured with extreme degrees of precision. In all situations it is very important to standardize the intensity and angle of light used to illuminate the test plates when zone measurements are being determined.
(iii) Agar depth
(iv) Composition of the agar medium
The agar medium itself profoundly influences the zone sizes in three ways 1. It affects the activity of different antimicrobial agents
2. It influences the rate of diffusion of the antimicrobial agent 3. It affects the growth rate of the test organism.
(v) Growth characteristics of the test strain
The rate of growth on the test medium obviously affects the end result. In susceptibility testing, some strain-to strain variability in growth rate sis unavoidable. Growth conditions have been standardized for optimal results with most of the common rapid-growing bacterial pathogens.
(vi) Temperature of Incubation
To further complicate the situation, most antimicrobial agents diffuse more slowly at lower temperatures, partially because of the increased viscosity of the agar medium. A single plate placed on the metal shelf of an incubator may take about 1 hour to warm to within 1 degree Celsius of the incubator temperature. However if the test plates are stacked in piles five deep ,the center plate takes up to 4 hour to reach the same temperatures.
(vii) Incubation time
Since the position of the zone of inhibition is determined within the first few hours of incubation, the zones of inhibition may be measured as soon as microbial growth can be seen. With most of the common bacterial pathogens, definite zones of inhibition can be observed within 5 to 6 hr after inoculation.
(viii) Timing of drug application
prevent leaching of the antimicrobial agent from the disk into the layer of moisture that may be left immediately after inoculation of the agar medium.
(ix) Concentration of antimicrobial agents in the reservoir
Fundamental to all agar diffusion procedures is the relationship between the size of the zone of inhibition and the potency of the antimicrobial agent. For bioassay procedures, standard drug solutions are tested on each assay plate and drug concentrations (log 10 scale ) was plotted against the zone diameter (arithmetic scale). For most practical purposes, dose-response curves as essentially straight lines are being considered.
(x) Presence of serum proteins
Many antimicrobial agents are reversibly bound to serum proteins. Agar diffusion susceptibility tests are performed in the absence of serum proteins, and protein binding is a consideration only when attempting to translate the results into terms that would predict responsiveness of an individual patient (Victor Lorian 2005).
IMAGE ANALYSIS
Image analysis is the extraction of meaningful information from images, mainly from digital images by means of digital image processing techniques. Image analysis task can be symbol as reading bar coded tags or as sophisticated as identified a person from their face.
Computer image analysis largely contained for the field of computer or machine vision, and medical imaging, and makes heavy use of pattern recognition, digital geometry and signal processing. This field of computer science developed in the 1950s at academic institutions such as the originally as a branch of artificial intelligence and robotics.
Standard light or phrase-contrast microscopy, combined with specific staining techniques (such as the gram stain), is the most rapid method of establishing the presence and making the initial identification of most bacteria. Discernment of subcellular structure, however, requires the use of electron microscopy. Tranmission electron microscopy, in which electrons pass through ultrathin sections of the specimen, is used to observe internal structures, such as ribosomes, and layers of the cell envelop. Scanning electron microscopy, in which electrons are scattered off the surface of metal coated specimens, is used to observe details of the cell surface.
Reversal of image contrast when a positive print is made from a photographic negative represents, perhaps, the simplest and most practiced form of image processing. More sophisticated techniques were developed years to enhance images of the moon and other celestial objects the first to develop processing techniques to study the structures of biological specimens imaged by electron microscopy.
Humans are visual creatures. For example, we describe beauty in visual terms. We categorize visual features of importance to us. For example, we compared an object’s size with the size of a standard. We also compared the shape of an object with other familiar shapes. Image analysis attempts to formalize this type of process by the use of an image analyzer
the desired information from it.
But conventional or classical image analyzers have serious fundamental problems in the image features that they claim to measure. They usually merely count pixels. They are a product of a more or less cottage industry of numerous independent investigators who have, over a long period of time, introduced many an ‘image feature’ that purports to represent some characteristic of the image of an object. Unfortunately, most of these features are unreliable guides to the fundamental characteristics of the image of an object.
The terms image analysis and image processing are often incorrectly assumed to be synonymous, but they refer to different aspects of the treatment of image data. Image analysis involved the quantification and classification of images and images and objects of interest with in images. Image processing refers to any technique, which alters, and displays, in more tangible form, the information contained in images.
Thus an image analysis system is a tool for gathering data from an image. Image analysis methodology used to extract data from images rather than counting or measuring directly. The advantages are that the captured images are permanent, allowing more time for study, and they can be subjected to enhancement and automated analysis techniques to improve data quality.
Elements of Visual Interpretation
Recognizing targets is the key to interpretation and information extraction. Observing the differences between targets and their backgrounds involves comparing different targets based on any, or all, of the visual elements of tone, shape, size, pattern, texture, shadow and association.
Tone refers to the relative brightness or colour of objects in an image. Generally, tone is the fundamental element for distinguishing between different targets or features. Variations in tone also allow the elements of shape, texture, and pattern of objects to be distinguished. Shape refers to the general form, structure, or outline of individual objects. Shape can be a very distinctive clue for interpretation. Size of objects in an image is a function of scale. It is important to assess the size of a target relative to other objects in an scene, as well as the absolute size, to aid in the interpretation of that target. A quick approximation of target size can direct interpretation to an appropriate result more quickly. Pattern refers to the spatial arrangement visibly discernible objects. Typically an orderly repetition of similar tones and textures will produce a distinctive and ultimately recognizable pattern.
Digidoc, Digimizer, and Macro Auto System
AlphaEase FC software also included a broad array of analysis tools, including molecular weight calculation, Rf determination, I-D lane densitometry, 2-D spot densitometry, quantitative PCR, microtiter plate reading, object distance measuring, gel scoring, and automatic colony counting.
Applications of alphadigidoc Molecular weight determination
This opens a set of tools for entering the values of known molecular weight markets and determining the molecular weights of unknown bands on the image.
Calculating Rf values
To obtain accurate Rf values, specify the location of the wells.Once the origin and
dye from have been defined, they are used to calculate the Rf values of any bands that
are added.
ID Multi (Line Densitometry)
Access a set of densitometry tools with which bands on a gel can be scanned and quantities in a lane format. There are two different ways in which this can be done, Auto lane and Auto grid. Auto gird allows the user to manually define the lane number, lane shape, and scan width of the Grid. Auto lane is a completely automated feature which will automatically define lane number, and band finding parameters for the user.
Spot density tools
Spot Density measurements
As objects are drawn, their density data is automatically calculated and displayed in a data window. Any time an object is drawn or detected, the data in the window are updated.
Data definitions
# is the number assigned to each object on the image in the order in which they were drawn. This object number is also shown in the corner of the object.
IDV is the sum of all the pixel values after background correction
IDV = Σ (each pixel value – BACK)
% is the percentage that each box, ellipse, or freehand drawing contributes to the total density measured thus far, taking background correction into consideration. The sum of the values in this column will be 100.
AREA s the size (in pixels) of the region enclosed by the box, ellipse, or freehand drawing AVG is the average value (after background correction) of the pixels enclosed.
AVG = IDV ÷ AREA
BACK is the background value that will be subtracted from all the pixels in the object.
The ruler function
Before any measurements can be obtained, a standard scale must be established. The scale that is created will serve as the standard for all measurements. Therefore, it is necessary to draw the scale line according to some standard measurement within the image.
existing image on the computer. On the program when we are giving the file name of a particular image the software automatically finding out the image and analyzing it through different overlays steps.
Parameters of digimizer
Digimizer have the following parameters 1. Area
2. Length 3. Radius 4. Perimeter 5. Intensity 6. Units
7. Minimum area 8. Maximum area
Pixel
ADVANTAGES OF IMAGE ANALYSIS ON PETRI PLATE EVALUATION
Digimizer automated method is very rapid. By a single click we can get a lot of information regarding with the plates and zones.
Digimizer values are more accurate, than normal conventional values because here
the measurement is done by the computer with the help of software. In clinical field, if we are giving some particular barcode to particular plate, full information regarding with that plate will go directly to the patient data sheet.
PAE studies can be done on agar plate by the help of density values.
Different regional wise susceptibility studies can be easily done by the help of
image analyzing process
Computer can give the values in whatever be the unit we needed i.e., whether it is pixel, cm, or mm etc.
We can measures the combined drug action on a Petri, plate, whether it is synergic or antagonistic or mere additives because computer can recognize whatever be the shape of the zone.
By checking the intensity or density of different area we can tell how uniform the swabbing is.
The zone is affected by many factors like depth of the media, bacterial population
density etc, if we are taking the value in terms of density and minimizing the zone density from the growth density the errors due to different bacterial population and depth of the agars can be minimized.
By the time zone analysis of Petri plate we can get the growth curve and from that we can identify the doubling time.
By normal conventional way of measurement we can get only diameter, but here
we can are, perimeter, radius, average intensity, I.D.V, Avg Density etc by a single click.
analysis.
As outsourcing is becoming familiar now days in every field, the different research teams or organization of different parts of world can correlate their research result properly through image analysis.
If any different colour density is accruing due to contamination, computer can express it by mean of some digital values.
Even though if there is any irregularity in zones due to improper diffusion or
irregularities of disk or well happen computer can analyze and measure the required area.
OBJECTIVES
To perform complicated image processing functions to bring out relevant
features that may provide very useful information but are difficult to extract by
conventional means.
To develop a method to study antimicrobial susceptibility through automated
image analysis.
To perform the test in a relatively short duration of incubation time for
antimicrobial susceptibility studies to facilitate an early initiation of treatment
To study the rate of growth of organisms on agar plate and to crosscheck the
class of organism by doubling time determination, performed along with
REVIEW OF LITERATURE
IMAGE ANALYSIS ON PETRI PLATE EVALUATIONS
M. Kolbert et al. (2004) compared the measurement of inhibition zones by the automated OSIRIS system with manual measurement. Variations of +3 mm in zone size measurements were defined as tolerable. Very major errors (i.e., classification of a resistant isolate as susceptible by the OSIRIS system) occurred in <1% o tests).It was concluded that the OSIRIS system was a rapid and reliable system for measuring disk susceptibility test results on round and square agar plates.
A. Nijis et al. (2003) found the OSIRIS and SIRISCAN 2000 systems are two semi automated systems that can be sued to read and interpret the results on disk diffusion agar plates. He compared both systems versus the NCCLS standard method of visual reading with a ruler. The results obtained with both systems in comparison with those obtained by the classical non automated means of interpretation were excellent, with correlation coefficients of 0.96 for both systems. The overall agreements for susceptibility interpretation were 96.56 and 96.24% with the OSIRIS and SIRISCAN systems, respectively. Overall, both the OSIRIS system and the SIRISCAN systems are comparable and reliable systems for determination of interpretative categories from the zone diameters of standard disk diffusion test plates.
E. Kent Korgenski et al. (1998) investigated the BIOMIC system includes software and a video-assisted plate reader that functions with a personal computer to automate, speed read, and interpret standard antibiotic disk diffusion test plates. The video reader helps standardize endpoints, speeds quantitative measurements by 40 to 90%, and reduces fatigue and transcription and interpretation errors. He conclude that the video-assisted plate reader is a reliable system for determining interpretative categories from zone diameters of standard antibiotic disk diffusion test plates.
Schoevers E.J et al. (1992) developed a computerized image analysis system (IAS) for reading the agar diffusion test automatically. The inhibition zones were measured by hand and by the IAS directly from the bioassay plate. Both methods were positively correlated. It is concluded that the IAS methods is an objective and accurate alternative for reading the agar diffusion test.
Simon Johns (2003) found single radial immuno diffusion (SRD) is a simple yet powerful technique that is routinely sued in many clinical laboratories for a side variety of analyses. Despite its simplicity, the technique as currently practiced suffers from a major drawback due tot eh fact that in general, the measurement of the reaction zones generated by the assay is performed manually. This is a task that is time-consuming and error-prone. To overcome these problems, a novel method of automating inhibition zone measurement has been developed. The new system has been extensively tested and compared with the standard, manual method. He reports the performance of the new method in the assay of the potency of influenza vaccines.
APPLICATIONS OF IMAGE ANALYSIS
Michael Putman et al. (2005) determined bacterial colony counting is a significant technical hurdle for vaccine studies as well as various microbiological studies. He show that an automated colony counter can process images obtained with a digital camera or document scanner and that any laboratory can efficiently have bacterial colonies enumerated by sending the images to a laboratory with a colony counter via internet.
Feng Chen et al. (2001) found a novel nucleic acid stain, SYBR Gold, was used to stain marine viral particles in various types of samples. Viral particles stained with SYBR gold yielded bright and stable fluorescent signals that could be detected by a cooled charge-coupled device camera or by flow cytometry. Estimates of viral concentration based on digitized images were 1.3 times higher than those based on direct counting by epifluorescence microscopy. The potential application of digital image analysis and flow cytometry for rapid and accurate measurement of viral abundance in aquatic environments is discussed.
Corine M. et al. present new software (Root flow RT) for measuring the expansion profile of a growing root at high spatial and temporal resolution. The software implements an image processing algorithm using a novel combination optical flow methods for deformable motion. The algorithm operates on a stack of nine images with a given time interval between each (usually 10s) and quantifies velocity confidently at most pixels of the image.
recent molecular techniques for analyzing structure-function relationships in microbial communities and will help to characterize symbiotic interactions among microorganisms.
MODIFICATION AND EVALUATION OF ANITMICROBIAL SUSCEPTIBILITY METHODS
Harold J et al. (1970) modified agar-diffusion technique for micro bioassay of antimicrobial agents to increase sensitivity of the technique and to extend the range of antimicrobial agents to which it sis applicable. This micro technique requires only 0.02 ml of an unknown test sample for assay, and is capable of measuring minute concentrations of antibiotics in buffer, serum, and urine.
Arthur L et al. (1979) performed standard Bauer-Kirby disk tests. Each disk test was observed and zone diameters were measured under two lighting conditions (transmitted light and reflected light). The two lighting systems produced similar zone measurements (+2 mm) with 96% of the tests).
Antal Kabay (1971) described a rapid quantitative assay by the cylinder plate diffusion method, in which Bacillus Stearothermophilus ATCC 12980 was used as the test organism. After 4 hr of incubation at 65oC, the zones of inhibition can be read off
easily with the naked eye. The 4 hr assay was compared under identical conditions with the conventional 16 to 18 hr agar diffusion assay. No difference in accuracy between the two methods was detected. In both cases, the coefficient of variation for replicate tests was less than 2%.
volume of the agar wells, make it economically feasible to use pooled human serum for the standard antibiotic solutions. With this method, it has been possible to test large numbers of clinical specimens in a minimal time, and with accuracy consistently better than 10%.
Bauer et al. ((1966) demonstrated an antibiotic assay in which the bacterial broth suspension is streaked. Surplus suspension is removed from the swab. After the inoculum has dried. Plates are incubated within 30 min. After overnight incubation, the zone diameters (including the 6mm, disk) are measured with a ruler. The zone diameters are a recorded and interpreted.
APPARATUS AND MATERIALS
Apparatus
Conical Flask (250 , 500 ml) : Borosil
Sterile Swab : Himedia
Test tube : Borosil
Petri dishes : SD Fire-chem LTD
Non absorbent cotton : Jay Cot Industries
Micropipette : Varipipettes
Microtips : Tarsons
STD flask (10ml, 100ml) : Borosil
Measuring cylinder : Borosil
Zone scale : Himedia
Heating mandle : Guna enterprises Instruments
Hot air oven : Technico equipment
Autoclave : Universal autoclave
Horizontal laminar flow unit : Clear air instrument Inc
Incubator : Technico incubator
Image capturing system : Alpha DigiDoc RT Image analyzing system : Alpha DigiDoc RT,
Digmizer,Macroauto system
Compound microscope : Motic
Refrigerator : Kelvinator
Electronic balance : Shimadzu
DRUGS USED Ciprofloxacin injection (2mg/ml) : Cipla
Amikacin Injection (2mg/100ml) : Ikon Remedies Pvt. Ltd
MEDIA USED
Muller-Hinton Agar Media
Muller-Hinton broth gelled by the addition of 2% agar (bacteriological grade). Ingredients
Casein acid hydrolysate : 17.5gm/Lt
Beef infusion : 300 gm/Lt
Soluble Starch : 1.5 gm/Lt
Final pH at 25oC : 7.4+0.2
Preparation
aid of heat; pH was adjusted to 7.2 -7.6 using alkali or dilute acid.
Sterilization
The conical flask which containing Muller-Hinton agar was sealed with non-absorbent cotton cover and tied with paper . It was then autoclaved at a pressure of 15 psi (121oc) or not less than 15 min.
Organisms used
Staphylococcus aureus NCIM 2706 was collected from national Chemical Laboratory, Pune and stored in pharmaceutical Biotechnology Laboratory, College of Pharmacy, SRIPMS, Coimbatore – 44. The strains were confirmed for their purity and identity by Gram’s staining method and its characteristic biochemical reactions. The selected strains were preserved by sub culturing them periodically on agar slants and storing them under frozen conditions. For the study, fresh 24 hrs, broth culture was used.
Working conditions
The working area is cleaned with acetone. Before commencements of the work, the working areas are sterilized using UV light. The entire work was done using
METHODOLOGY
Determination of antibiotic activity using agar well technique
Muller-Hinton agar plates were prepared in asceptic condition. The plates were allowed to solidify and inverted to prevent the condensate failing on the agar surface. The plates were dried at 37oC before inoculation. The organisms were inoculated in the plates prepared earlier, by dipping sterile swab in previously prepared inoculums,
removing the excess of inoculums by pressing and rotating the swab firmly against the sides of the culture tube above the level of liquid and finally swabbing the swab all over the surface of the medium, rotating the plates and swab again. Finally press the swab round the edge of agar surface. It was allowed to dry at room temperature, with the lid closed. The agar well were made placed, on to which drug solutions were applied in the previously inoculated surface of the Muller-Hinton agar plate and it was kept in
refriegerator for 15 min to facilitate uniform diffusion of the drug. Plates were prepared in triplicate and overnight incubation had done. Observations were made for zone of inhibition around the drugs and recorded.
CAPTURING THE IMAGES
• Capturing the images was done by Alpha Digi Doc RT image analyzing systems.
• Kept petri plates inside the Digi Doc and adjusted the positions after switched on the camera and epi white
• Then checked the clarity by exposure view and if it was clear acquire the images.
• The exposure time was adjusted to 100 milliseconds.
• Auto contrast was given in contrast option
• In focus, it was given of autofocus
• 1024*768 resolution was selected
• 174 was kept as zoom control
METHODOLOGY FOR AUTOMATED ZONE READING SYSTEM Software used 1: Digimizer
FIG : 2
The images captured by alpha DigiDoc RT was opened in Digimizer window
• Selected & made a single click on the zone area of the images.
• Then we could see a list of information regarding with each zone, i.e., the area average intensity, length, perimeter, radius, maximum area, minimum area and unit.
• Set the mm as the unit
• The information we got by clicking on the focus area was copied to the MS- excel sheet and draw the graph we needed.
Software Used 2: Macro Auto System
• The images captured by alpha DigiDoc RT was saved into the system.
• Give the file name on the place of the program for macro calculations
• Intensity threshold of left and right and no of overlays was set
• Give the auto correction if necessary.
• Allow to run the program.
• After processing over took noted the values in terms of number of pixels.
Measuring zone of inhibition by using DigiDoc Software used : Alpha DigiDoc
FIG : 3
• The images were opened in alpha DigiDoc window.
• Inside the analyzing tool, select the spot denso tool.
• Selected the circle or ellipse option.
• On the image put a 30 mm circle which should cover the zone area with some growth field.
• In spot Denso data window we can get a set of information regarding with this circles, i.e. IDV area, AVG density, back ground value etc.
• By subtracting the values of average density of 30mm zone circle from growth field density we got the different values which were indirectly showing the different concentration.
• Analyzed all zone by this ways and plot the graph. Time zone studies for early detection of zone of inhibition
• By the conventional method prepare the agar plate, different concentration of drugs all 24 hours strain, on previous day of the experiment.
• On the day of experiment swab the plates and make the well and apply the drug.
• Images were taken in different time intervals.
• Nearly from the 8th hour on wards, took the reading of the diameters from images
captured.
• Plot the graph of 7, 7.30, 8, and 24th hour.
Growth curve and doubling time on agar plate
• The images captured at various time intervals were opened in alpha Digi Doc window.
• Opened the spot Deso tools on the analyzing options.
• Selected the circle and put the circle on different part of the image and noted the density values from different hours images.
• Plotted the graph by taking time on x axis and density on y axis.
• Selected the linear portion of growth curve and plotted their log value graph.
• Draw trend line for this log graph. And noted the trend line equations from the ms-excel.
RESULTS AND DISCUSSION
RESULTS
Antimicrobial susceptibility testing had been performed through image analysis. The susceptibility of staphylococcus aureus to the antibiotics ciprofloxacin was studied by keeping the volume of antibiotics as 30 µl by agar well diffusion method. The images captured by alpha digidoc were used for the analyzing purpose.
The antimicrobial activity of the ciprofloxacin was compared by different zone of inhibition measuring methods- conventional zone scale values, macro auto calculation system, automated digimizer and digidoc methods. For each antibiotic -microorganism combination the experiment was performed three times. The comparison of all these different methods and plates has also been done by the r2 values of each of their trend
line equation.
Program for macro auto calculations Macro for auto calculation
'#Uses "Constant.bas" Dim App As Object Dim Worksheet As Object Sub Main
Set App = CreateObject("SigmaScan.Application") Set Worksheet = App.GetWorksheet
Worksheet.Show
Worksheet.MakePermanent '* Turn off all measurements
Worksheet.SetCellText("A",1, "Preparing Measurement List, One Moment Please...") For i=0 To NUMMEASURES-1
App.DoNotCollectMeasurement(i) Next i
Worksheet.SetCellText("A",1, "") App.DrawMajMinAxes=False '* Load the image
ExeDirectory = App.GetExeFileDirectory() Dim Bacter3 As Object
Set Bacter3 = App.OpenImage(ExeDirectory + "images\ cipro 1.tif")
ResultCode = Bacter3.ChangeColorResolution(8, 4) ResultCode = Bacter3.ConvertToGrayScale
ResultCode = Bacter3.Show
ResultCode = Bacter3.MakePermanent Dim Left0(1) As Long
Left0(0) = 175
Dim Right1(1) As Long Right1(0) = 225
ResultCode = Bacter3.IntensityThreshold(1, 1, Left0, Right1)
Dim Left2(1) As Long Left2(0) = 175
Dim Right3(1) As Long Right3(0) = 225
ResultCode = Bacter3.IntensityThreshold(2, 1, Left2, Right3)
'* Run binary (overlay) filters on the objects
ResultCode = Bacter3.FilterOverlay(2, 2, 3, 3, 2) '* Erode, split objects ResultCode = Bacter3.FilterOverlay(5, 3, 4, 1, 2) '* Dilate everything ResultCode = Bacter3.FilterOverlay(6, 4, 5, 2, 2) '* Dilate, don't merge ResultCode = Bacter3.FilterOverlay(10, 5, 5, 1, 2) '* Remove edge objects ResultCode = Bacter3.AndOverlays(5, 1, 5) '* Logical AND overlays 1 and 5
ResultCode = Bacter3.HideOverlay(2) ResultCode = Bacter3.HideOverlay(3) ResultCode = Bacter3.HideOverlay(4)
'* Measure the objects '* Count the objects
App.CollectMeasurement(M_NUMOBJECTS, "B") ResultCode = Bacter3.CountObjects(5)
NumItems = Worksheet.GetCellValue("B",1)
' MsgBox("# Objects = " + CStr(NumItems) + " / " + CStr(ResultCode)+" \ "+CStr(M_NUMOBJECTS)) ' Exit Sub
'* For each object find its area and shape factor App.DoNotCollectMeasurement(M_NUMOBJECTS) App.CollectMeasurement(M_SHAPEFACTOR, "A") App.CollectMeasurement(M_AREA, "C")
ResultCode = Bacter3.MeasureObjects(5) '* Eliminate all objects not sufficiently round
MsgBox("Removing all non-compliant objects. Click OK to continue.") iNum=0
For ii = 1 To NumItems
Shape = Worksheet.GetCellValue("A",ii) ObjArea = Worksheet.GetCellValue("C",ii) If (Shape < 0.15) Or (ObjArea < 1500) Then '* Eliminate the object
ResultCode = Bacter3.EliminateObject(ii) iNum=iNum+1
End If Next ii
MsgBox(iNum+" objects removed. Click OK to finish.") 'Recorded Macro Ends
End Sub
Table no : 1
graph no:1 Cipro 1
y = 9.63x + 79.1 R2 = 0.9822
y = 5.2647x + 35.44 R2 = 0.9839
y = 2.14x + 15.9 R2 = 0.9891
y = 2x + 15 R2 = 1
0.0 20.0 40.0 60.0 80.0 100.0 120.0
0.25 0.5 0.75 1
Conc
Di
a
Auto DM DD HM
graph no :2Ciprofloxacin 2
y = 1.7x + 18.5 R2 = 0.9797
y = 1.56x + 19 R2 = 0.9477 y = 4.151x + 44.005
R2 = 0.9122 y = 6.9x + 95.7
R2 = 0.9494
0.0 20.0 40.0 60.0 80.0 100.0 120.0 140.0
0.25 0.5 0.75 1
Conc
Di
a
Auto DM DD HM
graph no: 9 Ciprofloxacin 3
y = 1.8857x + 20.4
R2 = 0.9429
y = 1.8783x + 21.449
R2 = 0.9467
y = 9.4571x + 109.43
R2 = 0.9368
y = 4.5043x + 51.055
R2 = 0.8925
0.0 20.0 40.0 60.0 80.0 100.0 120.0 140.0 160.0 180.0
0.25 0.5 0.75 1 1.25 1.5
Conc
Di
a
Auto DM DD HM
graph no :10 Amikacin 1
y = 8.86x + 67.04 R2 = 0.9616
y = 4.4614x + 32 R2 = 0.9591
y = 1.876x + 13.808 R2 = 0.9427
y = 1.8x + 13.4 R2 = 0.9878 0.0
20.0 40.0 60.0 80.0 100.0 120.0
0.5 1 1.5 2 2.5
Conc
D
ia
Auto DM DD HM
graph no :11Amikacin 2
y = 2x + 12
R2 = 1
y = 1.744x + 13.476
R2 = 0.9703
y = 4.3982x + 29.417
R2 = 0.9947
y = 8.09x + 65.17
R2 = 0.9903
0.0 20.0 40.0 60.0 80.0 100.0 120.0
0.5 1 1.5 2 2.5
Conc
Di
a
Auto DM DD HM
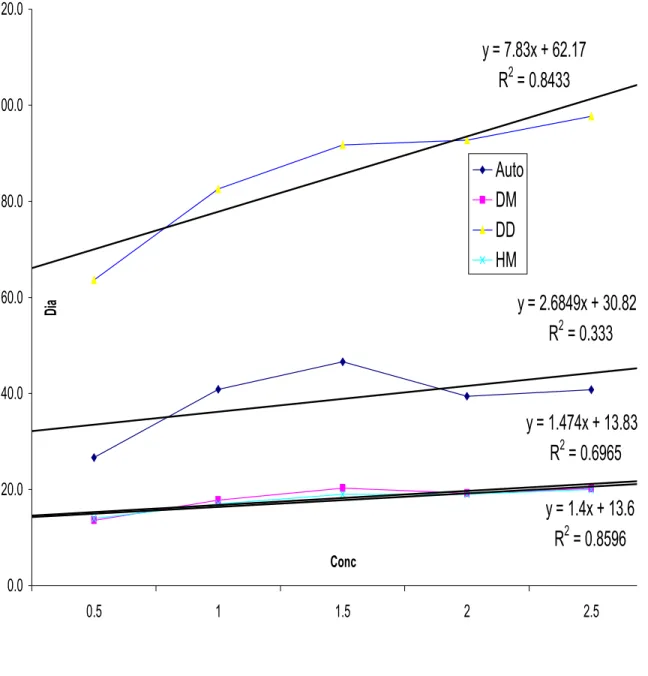
graph no:12 Amikacin 3
y = 1.4x + 13.6 R2 = 0.8596 y = 1.474x + 13.834
R2 = 0.6965 y = 7.83x + 62.17
R2 = 0.8433
y = 2.6849x + 30.822 R2 = 0.333
0.0 20.0 40.0 60.0 80.0 100.0 120.0
0.5 1 1.5 2 2.5
Conc
Di
a
Auto DM DD HM
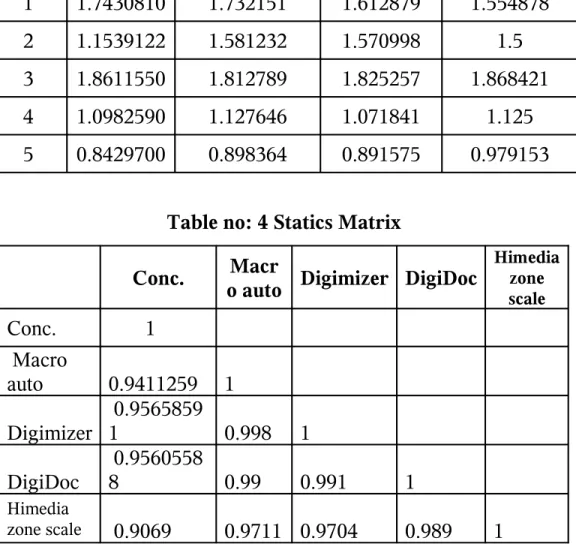
Table no: 3 Correlation Table
Serial no
Macro auto
Digimizer DigiDoc Himedia
zone scale
1 1.7430810 1.732151 1.612879 1.554878
2 1.1539122 1.581232 1.570998 1.5
3 1.8611550 1.812789 1.825257 1.868421
4 1.0982590 1.127646 1.071841 1.125
5 0.8429700 0.898364 0.891575 0.979153
Table no: 4 Statics Matrix
Conc. o autoMacr Digimizer DigiDoc Himedia zone scale
Conc. 1 Macro
auto 0.9411259 1
Digimizer
0.9565859
1 0.998 1
DigiDoc
0.9560558
8 0.99 0.991 1
Himedia
zone scale 0.9069 0.9711 0.9704 0.989 1
DIFFERENT STEPS OF OVERLAYS, FIG: 4
Fig: a Fig: b
Fig: c Fig: d
Fig: e Figs: f
Graph No.7: Himedia zone scale values
0
5
10
15
20
25
30
0
0.25
0.5
0.75
1
1.25
1.5
Concentrations(mcg/30mcl)
Zo
ne
o
f in
hi
bi
tio
n
(m
m
)
cipro 1
Graph No. 8: Digimizer automated values
Concentration (µg/30mcl)
DIGIMIZER AUTOMATED VALUES
0
5
10
15
20
25
30
0
0.25
0.5
0.75
1
1.25
1.5
Concentrations
Zo
ne
of
in
hib
itio
n (
mm
)
Graph No. 9: Zone of inhibition in terms of density difference Concentration (µg/30mcl)
ZONE OFINHIITION IN TERMS OF DENSITY
DIFFERENCE
0
5
10
15
20
25
30
35
0
0.25
0.5
0.75
1
1.25
1.5
Concentrations
Zo
ne
of
in
hib
itio
n
Graph No. 10: Himedia zone scale values
Concentration (µg/30mcl)
HIMEDIA ZONE SCALE VALUES
0
5
10
15
20
25
0
0.5
1
1.5
2
2.5
3
Concentration
Zo
ne
of
in
hib
itio
n (
mm
)
Graph No. 11: Digimizer automated values
Concentration (µg/30mcl)
DIGIMIZER AUTOMATED VALUES
0
5
10
15
20
25
0
0.5
1
1.5
2
2.5
3
Concentration
Zo
ne
of
in
hib
itio
n (
mm
)
Graph No. 12: Zone of inhibition in terms of density difference Concentration (µg/30mcl)
ZONE OF INHIBITION IN TERMS OF DENSITY
DIFFERENCE
0
5
10
15
20
0
0.5
1
1.5
2
2.5
3
Concentration
Zo
ne
of
in
hib
itio
n
STAPHYLOCOCCUS AUREUS VS CIPROFLOXACIN
CIPROFLOXACIN 1 CIPROFLOXACIN 2
Fig. 5 Fig. 6
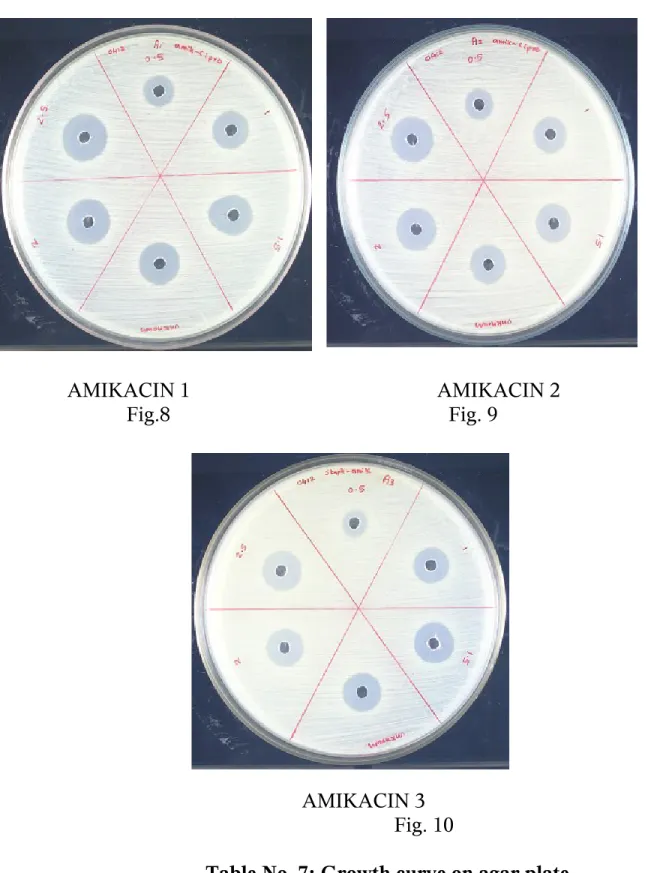
STAPHYLOCOCCUS AUREUS VS AMIKACIN
AMIKACIN 1 AMIKACIN 2
Fig.8 Fig. 9
AMIKACIN 3 Fig. 10
Sl. No.
Time (Hours)
Density of different hours
Cipro 1 Original
value
Cipro 2 Original
value
Cipro 3 Original
value
Cipro1 log value
Cipro2 log value
Cipro3 log value
1 2 198.7 198.7 201.3 2.2981 2.2981 .3039
2 3 209.7 210.3 205.7 2.3215 2.3229 2.3125
3 3.30 215.3 210.7 205 2.333 2.3236 2.3111
4 4 214.7 212 207 2.3318 2.3263 2.3160
5 4.30 213.7 213.7 208.7 2.330 2.330 2.3195
6 5 214 214.3 208.7 2.3304 2.3311 2.3195
7 5.30 215.3 214.7 209 2.333 2.3318 2.320
8 6 215.3 214.7 210.7 2.333 2.3318 2.3236
9 6.30 219.7 219 213.3 2.3418 2.3404 2.3291
10 7 224 222.7 218.7 2.3502 2.3477 2.3398
11 7.30 225.7 225.7 221 2.3535 2.3535 2.3441
12 8 229.3 229 224.7 2.3604 2.3598 2.3515
Graph No. 13: growth curve of normal values
190 200 210 220 230 240 250
0 5 10 15 20 25 30
Time (Hours)
D
en
si
ty
Graph 14: growth curve of log values
2.29 2.3 2.31 2.32 2.33 2.34 2.35 2.36 2.37 2.38 2.39 2.4
0 5 10 15 20 25 30
Time (Hours)
D
en
si
ty
cipro 1 cipro 2 cipro 3
y = 0.0066x + 2.3278
R2 = 0.9783
y = 0.0069x + 2.3259
R2 = 0.9937
y = 0.0071x + 2.3164
R2 = 0.9857
2.32 2.325 2.33 2.335 2.34 2.345 2.35 2.355 2.36 2.365
0 1 2 3 4 5 6
lo
g
of
d
en
si
ty
Series1 Series2 Series3
Derivation of an equation for doubling time on Petri plate
Equation for rate of growth Log 10 Nt-log 10N0
tt-t0
G.T =tt-t0/3.3(logNt-log10N0)
Ie, G.T =
= 0.303/m
Here,
G.T-generation time
Nt –no of organism at time t N0-no of organism at initial time tt-final time
t0-initial time
m-slope of the log trend line equations
slope of the 1st trend line equation is 0.0066
Therefore its generation time is 0.303/.0066 = 45.91 minutes
Slope of the 2nd trend line equation is 0.0069
Therefore its generation time is 0.303/.0069 = 43.9 minutes
Slope of the 2nd trend line equation is 0.0071
Therefore its generation time is 0.303/.0071 = 42.68 minutes
Table No: 8 CROSS CHECKING THE IDENTITY OF ORGANISM BY GENERATION TIME
Sl no
Microorganism
Gene ration time
1
E.Coli 20 Gram –ve rod Urinary tract infection, Local or systemic disease, Meningitis in infants Dysuria Lumbar pain Hematuria Chills Ciprofloxacin Ampicillin Cefotaxime 2 Pseudomonas aeroginosa 34 Gram –ve rod Localized infection, Systemic infection Eye.ear,skin infections Bacteremia Tobramycin Carbenicillin Ticarcillin 3 Bacillus species 18-2 8 Gram +ve rod Cutaneous anthrax, Pulmonary anthrax, Gastro intestinal form of anthrax Traumatic wounds, burns, Inflammation on lymph nodes Penicillin G Doxycyclin Ciprofloxacin 4 Clostridium
botulinum 34
Gram +ve blunt ended rods Botulism Paralysis, Vomiting Diarrhoea Constipation Penicillin G Antotoxin 5 Staphylococcus aureus 30 Gram +ve cocci Skin infection, Septicemia, Osteomyelitis Endocarditis, Toxic shock syndrome, Abscesses, Fever Diarrhea, hypotension Oxacillin Nafcillin vancomycin 6 Streptococcus
species 48
Graph 16: Zone Of Inhibition 0f Cipro 1, 2, 3 At
7h, 7.30h, 8h and 24th hour
0 5 10 15 20 25 30 35 40
0 0.2 0.4 0.6 0.8 1 1.2 1.4 1.6
concentration
zo
ne
s
( m
m
)
Graph 17: Average Zone Of Inhibition 0f Cipro 1, 2, 3 At
7h, 7.30h, 8h and 24th hour
y = 11.973x + 17.601
R2 = 0.969
y = 11.808x + 17.758
R2 = 0.9663
y = 12.061x + 17.412
R2 = 0.9621
y = 13.281x + 15.194
R2 = 0.9542
0 5 10 15 20 25 30 35 40
0 0.2 0.4 0.6 0.8 1 1.2 1.4 1.6
concentration
zo
ne
s
(m
m
)
Graph 18: Average Of 7h,7.30h, 8h And 24th Hour Zone
Of Inhibition Of Cipro1,2, And 3
y = 12.377x + 17.003 R2 = 0.9439
y = 13.305x + 15.568 R2 = 0.9513
y = 12.141x + 16.625 R2 = 0.9746
0 5 10 15 20 25 30 35 40
0 0.2 0.4 0.6 0.8 1 1.2 1.4 1.6
concentration
zo
ne
s
(mm)
cipro 1 cipro 2 cipro 3
FIG :11
Fig :a Fig :b 2 h 3 h
Fig :c Fig :d 3.30 h 4 h
Fig :e Fig :f 4.30 h 5 h
Fig :g Fig :h 5.30 h 6 h
Fig :i Fig :j 6.30 h 7 h
Fig :k Fig :l 7.30 h 8 h
DISCUSSION
The macro auto calculation system, Digimizer, and digidoc methods can read,
interpret and report the antimicrobial activity by agar well diffusion method.
The correlation of the zone of inhibition measurement of the himedia zone scale,
automated methods of macro calculation,digimizer and digidoc systems was observed as
good. The difference in the results were obtained from these four methods was
negligible.
In order to compare different types of agar plate by these methods, experiment
had been triplicated. The results obtained from these triplicated agar plates had been
compared by graphical representation. The results of the same plate by different
methods are compared by the help of MS- excel trend line equation and their r2 values.
If the r2 values are closer to 1 it indicate the better linearity of the graph. Comparison of
the different unknown predicted values was done by statics matrix.
The minimum time required for taking the zone of inhibition reading for
staphylococcus aureus against ciprofloxacin has been studied. The zone of inhibition
can be visible in between 6-8 hours. This zone of inhibition appeared is not having any
significant difference on 24 hours reading.
A growth curve of staphylococcus aureus against ciprofloxacin had been
performed. By the help of the trend line of the log density graph, derived an equation for