Open Journal of Geology, 2018, 8, 674-696 http://www.scirp.org/journal/ojg
ISSN Online: 2161-7589 ISSN Print: 2161-7570
DOI: 10.4236/ojg.2018.87040 Jul. 23, 2018 674 Open Journal of Geology
Rainfall Threshold Analysis and Bayesian
Probability Method for Landslide Initiation
Based on Landslides and Rainfall Events
in the Past
Hien Minh Do
1,2*, Kun Long Yin
11Faculty of Engineering, China University of Geosciences (Wuhan), Wuhan, China 2Vietnam Institute of Geosciences and Mineral Resources, Hanoi, Vietnam
Abstract
In this paper a rainfall threshold and a Bayesian probability model are pre-sented for the landslide occurrence of shallow landslides in Ha Giang city and the surroundings, Vietnam. The model requires the data on daily rainfall combined with the actual dates of landslide occurrences. Careful study on the database is a prerequisite for the paper. For this reason, selecting the input data was carried out carefully to ensure the reliable results of the study. The daily rainfall data covering a time span of 57 years was collected from a unique rain gauge station of National Centre for Hydro-meteorological Fore-casting of Vietnam (from 1957 to 2013) and a landslide database with some landslides (37 of total of 245 landslides) that containing dates of occurrence, was prepared from historical records for the period 1989 to 2013. Rainfall thresholds were generated for the study area based on the relationship be-tween daily and antecedent rainfall of the landslide events. The results shows that 3-day antecedent rainfall (with the rainfall threshold was established: RT =
40.8 − 0.201R3ad) gives the best fit for the existing landslides in the landslide
database. The Bayesian probability model for one-dimensional case was estab-lished based on 26 landslides for the period 1989 to 2009, daily rainfall data with the same time and the values of probability varies from 0.03 to 0.44. Next, the Bayesian probability model for two-dimensional case was generated based on 11 landslides, rainfall intensity and duration in three months (May, June and July) of 2013 and the values of probability ranges from 0.08 to 0.67,
and computed values of conditional landslide probability P(A|B) from
two-dimensional case of Bayesian approach are clearly controlled by rainfall intensity > 40 mm with rainfall duration > 0.3 day.
How to cite this paper: Do, H.M. and Yin, K.L. (2018) Rainfall Threshold Analysis and Bayesian Probability Method for Landslide Initiation Based on Landslides and Rainfall Events in the Past. Open Journal of Geolo-gy, 8, 674-696.
https://doi.org/10.4236/ojg.2018.87040
Received: June 13, 2018 Accepted: July 20, 2018 Published: July 23, 2018
Copyright © 2018 by authors and Scientific Research Publishing Inc. This work is licensed under the Creative Commons Attribution International License (CC BY 4.0).
http://creativecommons.org/licenses/by/4.0/
DOI: 10.4236/ojg.2018.87040 675 Open Journal of Geology
Keywords
Rainfall Threshold, Antecedent Rainfall, Bayesian Probability, Ha Giang
1. Introduction
Landslide occurs every where on over the world, especially in the small and me-dium river basin, along traffic road, mountain foot area in the mountainous areas in the countries under the influence of climate and storms.
Landslide studies have been carried out from very long time ago until now. The main objectives of these researches are to understand, manage, monitor, control, prevent and mitigate the huge impacts of this natural phenomenon to human’s life, socio-economic development, cultural infrastructure, environ-mental degradation…
To fulfill these objectives a lot of scientific articles related to this field were published. One of the most important landslide causative factors is rainfall data which are supposed as a triggering factor of landslide. The early studies about the rainfall intensities and duration associated with shallow landslides and debris flows were carried out by Caine [1]. He and some scientists who published their previous studies supposed that the effect of rainfall in producing shallow (less than 2 or 3 meters deep) landslide and debris flow activity is an obvious one, though one that is difficult to define precisely. This difficulty arises because rainfall only influences slope stability indirectly, through its effect on pore water conditions in the slope material and because its influence requires an interaction with other characteristics of the waste mantle.
Extreme rainfall conditions, when intensities remain high for long periods of time, must be accurately examined. In this case, any soil could become unstable. Hence, a better knowledge of the expected rainfall intensity and duration is fun-damental for understanding the relationship with soil failure initiation and to establish different warning thresholds [2]. Prediction of landslide occurrence is not only a fundamental goal of hazard management but also a test of how well the process is understood. Forewarning of landslides may be provided in differ-ent ways. By far the most common approach is the recognition of landslide sus-ceptibility from a spatial perspective [3].
H. M. Do, K. L. Yin
DOI: 10.4236/ojg.2018.87040 676 Open Journal of Geology
empirical thresholds refer to statistical analysis of the relation between rainfall and landslide occurrence [1][6][7].
Empirical methods for temporal probability assessment are based on the esti-mation of rainfall thresholds obtained by studying rainfall conditions that have resulted in landslides. They are usually contained in envelope curves based on variables such as cumulative rainfall, antecedent rainfall, rainfall intensity, and rainfall duration [1][2][3][4][5][9]-[19]. The most commonly used empirical model is based on the rainfall intensity and duration. This threshold model re-quires data with high quality and temporal resolution (at least hourly rainfall data), which are not frequently available. Other models based on antecedent rainfall work with daily rainfall data, which are relatively simple and inexpensive to measure over large areas [11].
Recent studies introduced improvements using statistical methods for a more precise constrain of the ID threshold. This is the case of Bayesian inference me-thod (e.g. [6][20][21] and the quantile regression [8]). Moreover, few attempts have been carried out to estimate temporal probability of slope failure [11][22].
In this paper, we propose a rainfall threshold for landslide initiation was esti-mated based on the relationship between the rainfall events and the historical landslide records. Then, the rainfall threshold was validated using the landslide events in 2000, 2007, 2008 and 2013. The method requires complete information on landslides including the dates of occurrence in order to correlate them with rainfall. Besides this method, Bayesian approach will be apply to estimate the probability of landsliding conditional to characteristics of rainfall events. The applications of these methods are based on the quality of landslide information (timing and location). So we used a data set consisting of 37 events that occurred between 1989 and 2013 from a database of 245 landslides occurred in the study area. Daily rainfall data were provided by a unique rain gauge station in the study area and collected rainfall data from 1957 to 2013.
This method is applied to assess landslide currently induced by rainfall in the Ha Giang city and the surroundings, one of the most high risk potential of landslide hazard in mountainous area of Vietnam as well as showing the level of the probability of landslide occurrence in the region. This study area was se-lected because of the availability of historical landslide records including the dates of occurrence of the landslides, and daily rainfall records from a rain gauge station.
2. Study Area
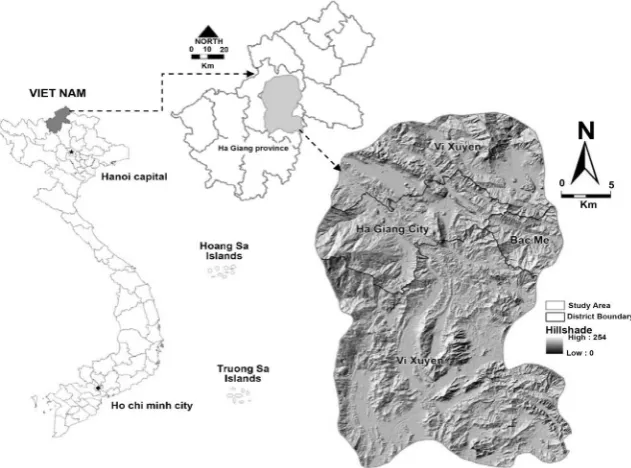
Ha Giang city and the surroundings are located in Ha Giang, one of the
north-ern mountainous provinces in Vietnam (Figure 1). It covers an area of about
779 km2 between longitudes 104˚52'E and 105˚18'E and latitudes 22˚34'N and
DOI: 10.4236/ojg.2018.87040 677 Open Journal of Geology
Figure 1. Location map of the study area.
karstic area is also representative of the north part of study area. Beside the drawback of terrain, here is also a tectonically active area with the complex of fracture zones, faults system and other important feature is dense drainage net-work with river and streams that landslides occur frequently as one of the most common natural disasters.
Geologically, the area comprises of limestone, sandstone, silty sandstone, black clay shale, quartz-biotite schist, sericite-chlorit schist, mica schist, green schist, and some kind of rock with small distribution such as: porphyritic biotite granite, granosyenite, olivine gabbro, gabbro diabase, conga diabase… The ages of rocks vary from Proterozoic to Trias. The bedrock of this study area is wea-thered strongly, the average thickness of weawea-thered layer is 3 - 5 meters, and the most thickness layer is 20 meters as observed in the cut slopes along the trans-portation road in the region.
The contact between bedrock and weathering soils is often exposed in the cuts slopes, which make them more susceptible to landslides due to the build-up of pore pressure on the contact [10][11]. Moreover, weathering alters the mechan-ical, mineralogic and hydrologic attributes of the regolith, and, hence, is an im-portant factor of slope instability in many settings [23].
The land use of the study area comprises of forest land, barren land and non-forest rocky mountain, agricultural land, residential areas, bush and grass areas and water surface.
H. M. Do, K. L. Yin
DOI: 10.4236/ojg.2018.87040 678 Open Journal of Geology
2013, the average annual rainfall of this area ranging from 2500 to 3300 mm/year where 90% of the total rainfall occurs in the summer (from May to October every year). Moreover, the frequency and intensity of the rainfall are concen-trated over a short period that triggers most of the disastrous hazards in the study area.
2.1. Landslide Database
Landslide database was collected from historical records of the previous projects. This data is based on landslide inventory from several projects such as: 1) “In-vestigation and assessment of the types of geological hazard in the territory of Vietnam and recommendation of remedial measures”. Phase II: A study of the northern mountainous province of Vietnam [24]; 2) “The report of investigation of natural hazards in the northwest of Vietnam’’ [25]; 3) “Status geo-hazards as-sessment in four mountainous provinces in North of Vietnam: Ha Giang, Tuyen Quang, Cao Bang, Bac Kan. Defining sources, prediction and propose preventive
measures and consequences mitigation” [26]; 4) “The State-Funded Landslide
Project” is a national program to systematically assess landslide susceptibility, hazard and risk for all of prone areas in Vietnam. The first phase of the project (2012-2014) some activities of landslide inventory mapping were implemented over the fourteen Northern mountainous provinces [27].
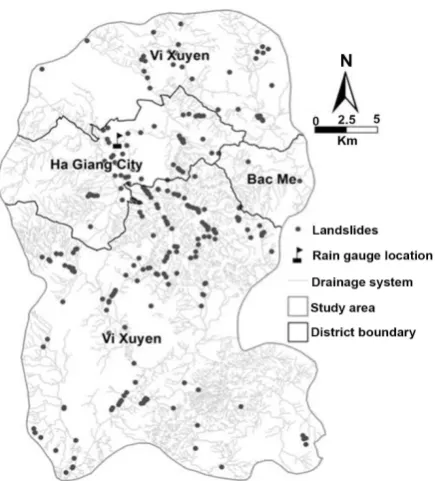
In the study area numerous landslides normally occur in the period from May to October. However, almost of landslide points which were collected from field work of previous projects are lacked of exactly dates of landslide occurrence. Some difficulties was mentioned by Hung [27] such as: few or no sources of his-toric information due to the isolated sites or little memory of small or medium size events; no updates developed by the surveyors after they finished their tasks. These problems caused a lot of difficulties when using landslide database for analyzing the relationship between rainfall evens in the past with historical landslide records. Figure 2 shows the landslide distribution in Ha Giang city and the surroundings. This landslide inventory map was established based on the landslide database collected from the projects was mention above. The total of landslides in the study area are 245 points, landslides are mostly shallow rota-tional slides with 107 points, the next type of movement is complex slides with 70 points, the shallow translational debris slides with 53 points, debris flows with 9 sites and finally is topple with 6 sites. The minimum size of landslides is 40 m3
and the maximum size is 9450 m3 and median = 134 m3 and the total of volume
of landslides is approximately 150.000 m3 but this type of natural disaster have
DOI: 10.4236/ojg.2018.87040 679 Open Journal of Geology
Figure 2. Map showing location of landslides, rain gauges and
the drainage system of the study area.
remaining 11 events occurred in 2013. Most of landslides occurred in July with 20 events, the next is in June with 10 events, both of May and August are having the same times with 3 events, and then in September with 1 events. Analysis of the landslide inventories shows that most of the slope failures in the study area were caused by rainfall infiltration into the soil causing an increase in soil pore-water pressure [24][26].
2.2. Rainfall Database
For the study area, daily rainfall data were collected from a unique rain gauge belonging to the National Centre for Hydro-meteorological Forecasting of Viet-nam from the period of time 1957 to 2013. The location of this rain gauge is shown in Figure 2 and some features of rainfall data is shown in Figure 3.
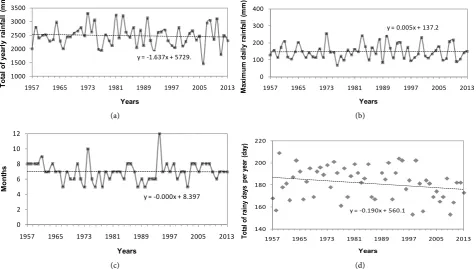
The total of yearly rainfall of study area was from 1957 to 2013 ranging from 2500 to 3300. The study of daily rainfall records reveals that the area experiences rainfall in two periods: rainy season, that the rainfall is always concentrate in May to October and the common highest month of rainfall is often July and dry season from November to April. The lowest recorded annual rainfall is 1465 mm
and the highest is 3305 mm (Figure 3(a)). The minimum of total number of
days with recorded rainfall is 153 days and the maximum of it is 209 days (Figure 3(d)). The maximum daily rainfall during in rainy season varies from
67.6 mm to 256.2 mm (Figure 3(b)). During 57 years (from 1957 to 2013) the
H. M. Do, K. L. Yin
DOI: 10.4236/ojg.2018.87040 680 Open Journal of Geology
(a) (b)
[image:7.595.61.538.79.349.2](c) (d)
Figure 3. Some characteristics of rainfall data in the study area from 1957 to 2013 and trend lines. (a) The average annual rainfall;
(b) Maximum daily rainfall; (c) The months happened maximum daily rainfall; (d) Total of rainy days per year.
Although in Vietnam, many landslide project have been completed during 20 recent years but we are really lack of some important information of historical landslide data. The first reason of this fact is because all the landslide field work of the previous projects was carry out in April or October. April is at the end of period of time of dry season and October is at the end of period of time of rainy season. This works is not suitable for collecting the landslide information be-cause almost of landslide in mountainous area of Vietnam is always occurs in rainy season from May to October, especially this natural phenomenon is oc-curred with the most frequently in 3 months from June to August. Due to the fact that, the landslide information collected is very hard to link with exactly date of rainfall episode. Although in the study area collected 245 landslides but most of them could not define the exactly date except 37 landslides triggering events as mention above. Most of these landslides have occurred in areas where the rainfall was relatively high with average daily rainfall occurred landslide is more than 76 mm, even having 9 of 37 landslides occurred the same day with maximum daily rainfall.
3. Probability of Occurrence of the Triggering Rainfall
Threshold
3.1. Determination of the Rainfall Threshold
One of the most difficulties when using antecedent rainfall measurements to predict landslide occurrence is the definition of the period over which to accu-y = -1.637x + 5729.
1000 1500 2000 2500 3000 3500
1957 1965 1973 1981 1989 1997 2005 2013
To tal o f year ly rai nf al l ( m m ) Years
y = 0.005x + 137.2
0 100 200 300 400
1957 1965 1973 1981 1989 1997 2005 2013
M axi m um d ai ly rai nf al l ( m m ) Years
y = -0.000x + 8.397
0 2 4 6 8 10 12
1957 1965 1973 1981 1989 1997 2005 2013
M on th s Years
y = -0.190x + 560.1
140 160 180 200 220
1957 1965 1973 1981 1989 1997 2005 2013
DOI: 10.4236/ojg.2018.87040 681 Open Journal of Geology
mulate the precipitation [6][22].
A detailed literature review revealed a complex relationship on the correlation between numbers of days for the antecedent rainfall with the triggering of a
landslide [22]. The days for antecedent rainfall have mentioned in many
pre-vious studies [1][4][6][9][10][11][28][29] have attempted to establish rain-fall-intensity thresholds so that slope failure predictions could be made accu-rately. These various works define rainfall threshold in terms of rainfall intensi-ty, duration vs. intensity ratio, cumulative rainfall in a given time, antecedent rainfall vs. daily rainfall ratio, event rainfall vs. yearly average rainfall ratio, and daily rainfall vs. antecedent excess rainfall ratio [29].
The thresholds using rainfall intensity-duration are the most widely used me-thod in the literature [30]. For rainfall threshold estimation, the most four com-mon variables used in the literature are as follows: daily rainfall [9], antecedent rain-fall [9][10][11], cumulative rainfall [28], and normalized critical rainfall [4]. In general, the selection of the right parameters in constructing rainfall threshold is mainly dependent on the landslide type [30].
In this study area where daily rainfall (covering a time span of 57 years from 1957 to 2013) and hourly rainfall data (only from May to October in the period of 4 years from 2010 to 2013) are available, so antecedent rainfall plays an im-portant role in estimation of landslide initiation introduced by Jaiswal and Van Westen [11] is applied in this paper.
As discussed in Section 2, landslide hazard in the area having strong relation-ship with certain intensity of rainfall. Hence, we suppose that the probability of occurrence of a landslide is related to the probability of occurrence of the trig-gering rainfall threshold. It means that landslide has to occur whenever a given rainfall threshold is exceeded may not hold always and everywhere. However, it is also expected that landslides will not occur below the rainfall threshold. Hence, for rainfall-triggered landslides, this assumption can be an acceptable first-approximation to work with and to estimate the frequency of landslides by establishing relations between the landslide trigger, its magnitude and the oc-currence of the landslides [11].
Depending on the type of landslides and their geo-environmental setting, the number of antecedent days can vary from 3 days for shallow landslides to 30 days for deep landslides [4][10][11]. In order to determine the suitable number antecedent days required for shallow landslides of the study area, we selected 29 landslide-triggering events (in total 37 landslide-triggering events have men-tioned in Section 2.1) that have occurred between 1989 and 2013 in this area. After analyzing the 3, 5, 7, 10, and 15-day antecedent rainfall, according to the method suggested by [10], the 3-day antecedent rainfall was considered suitable for the analysis.
3.2. Results
To determine the rainfall threshold (RT), a scatter plot was prepared showing
H. M. Do, K. L. Yin
DOI: 10.4236/ojg.2018.87040 682 Open Journal of Geology
with one or more triggered shallow landslides. The envelope curve is manually drawn such that it demarcates the lower end of the plotted points. The line can be represented by a linear mathematical equation [3][11].
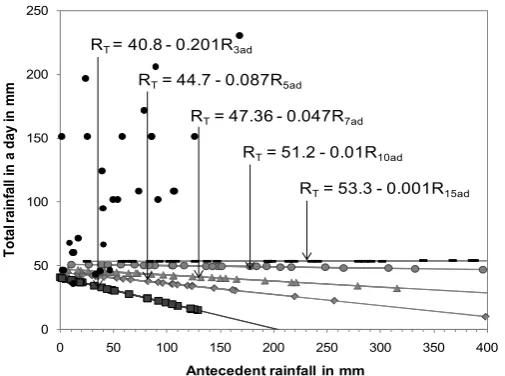
In this study area, RT above which a landslide can occur for the given 3-day
antecedent rainfall (R3ad) is represented by the equation RT = 40.8 − 0.201R3ad.
Besides, we also established the equations of rainfall threshold for 5, 7, 10 and 15-day antecedent rainfall and the landslides that occurred in study area were used for the threshold validation (Figure 4).
In some cases, landslides were also occurred in the days which no rainfall or with very few of daily rainfall was measured. These were the cases when high antecedent rainfall alone has resulted in landslides and other reason is the fail-ures to pore pressure rising due to water percolating from upslope areas. This holds for landslides associated with cut slopes because during excavation toe of such slopes are removed and the unsupported overburden mass becomes more prone to failure under the given condition. Thus, for all the listed thresholds, the lower boundary of the envelope curve was set to zero daily rainfall [11].
3.3. Validation of Rainfall Threshold Model
The rainfall thresholds can be used to predict landslides both spatially and tem-porally. The temporal aspect is related to the daily variations in rainfall and the spatial aspect can be related to the use of different thresholds for different areas. An indirect way to test the predicting capability of the thresholds is to validate them with the control data sets, which were not used in the model [11].
In order to validate the model, the historical landslide recorded in some years such as 2000, 2007, 2008, and 2013 were used. A part of the landslide events in
these years were also used in the rainfall threshold model creation. Figure 5
[image:9.595.248.501.482.670.2]shows the results of validation of rainfall threshold model of the study area.
Figure 4. Rainfall thresholds for the study area, RT is the threshold
rain-fall and R3ad, R5ad, R7ad, R10ad and R15ad are the different of antecedent rainfall days and black points are the landslides were used for the thre-shold validation.
0 50 100 150 200 250
0 50 100 150 200 250 300 350 400
To
ta
l r
ain
fa
ll
in
a
d
ay
in
m
m
Antecedent rainfall in mm
RT = 40.8 - 0.201R3ad
RT= 44.7 - 0.087R5ad
RT= 47.36 - 0.047R7ad
RT= 51.2 - 0.01R10ad
DOI: 10.4236/ojg.2018.87040 683 Open Journal of Geology (a) (b)
[image:10.595.59.538.71.385.2](c) (d)
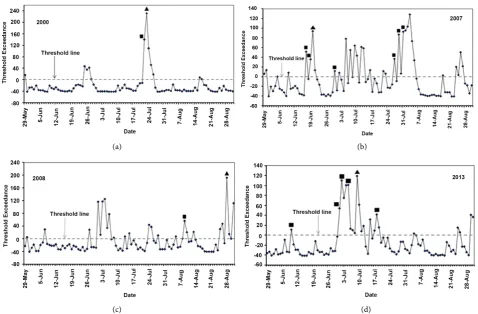
Figure 5. Validation of the threshold equation RT = 40.8 − 0.201R3ad for the study area. Validation was done for the year 2000,
2007, 2008 and 2013. Positive values on the vertical axis indicate threshold exceedance (R > RT). Black squares indicate the dates of landslide-triggering rainfall events considered in the model. Black triangles are the event dates that were not considered in build-ing the threshold model.
According to the results shows in Figure 5, in the period from 29 May to 31
August 2000, the rainfall threshold exceed 10 times and landslides occurred in the day that happened maximum daily rainfall in July and in the day having the second high of rainfall of the month as well. And in the 2007 witnessed many times the rainfall has exceeded the threshold curve. It was also one of the years having high average rainfall in the rainy season, especially in July with more than 1000 mm. In 2008 and 2013 was also recorded a lot of rainfall events exceed the threshold rainfall. Compare to 2000, the number of times which rainfall threshold exceed in the 2007, 2008 and 2013 were much more. Perhaps, it represented for extreme-weather condition influenced by global climate changes.
4. Bayesian Probability Model
H. M. Do, K. L. Yin
DOI: 10.4236/ojg.2018.87040 684 Open Journal of Geology
noted that subjective models are limited in that they are slow in revealing pre-viously unrecognized relationships. Experts can err in making complex forecasts, especially if they have to consider conflicting clues. “Clues” are defined as sepa-rate independent facts that impact on the forecast. Because the number and form of clues varies, it is therefore important to aid the experts’ judgments with a me-thodology to organize them. The Bayes probability model provides a structure for breaking a complex judgment into several smaller components and reducing expert error. Construction of the Bayes probability model requires four steps: 1) Decide on events to forecast; 2) Identify the clues; 3) Assess likelihood estimates; 4) Use Bayes formula to forecast [31].
4.1. One-Dimensional Case
Because of only have a unique rain gauge in the study area, so we selected Baye-sian probability model applied for one-dimensional case to calculate landslide
probability caused by daily rainfall (mm/day). According to Berti [21], Bayes’
theorem can be presented as below.
Bayes’ theorem is a direct application of conditional probabilities. The condi-tional probability is the probability of some event A (in our case a landslide) given the occurrence of some other event B (a rainfall episode with a certain magnitude, expressed in terms of total rainfall, intensity or any other variable). Conditional probability is written P A B
( )
and it is read “the probability a landslide (A) occurs given a rainfall episode (B)”. This probability is provided by the Bayes’ theorem:( )
P B A P A( )
( )
( )
P A B
P B
⋅
= (1)
where:
( )
P B A = conditional probability of B given A (also called the likelihood), that is the probability of observing a rainfall event of magnitude B when a landslide occurs,
P(A) = prior probability of A (or simply prior), that is the probability a landslide occurs regardless of whether a rainfall event of magnitude B occurs or not,
P(B) = marginal probability of B, that is the probability of observing a rainfall of magnitude B regardless of whether a landslide occurs or not,
( )
P A B = conditional probability of A given B (also called posterior
proba-bility), that is the probability of observing a landslide when a rainfall event of magnitude B occurs.
Bayesian probability is usually computed in terms of relative frequencies. Thus, if NR is the total number of rainfall events recorded during a given time
reference; NA is the total number of landslides occurred during the same period;
NB is the number of rainfall events of magnitude B; and N( )B A is the number of
DOI: 10.4236/ojg.2018.87040 685 Open Journal of Geology
( )
A RP A
≈
N N
(2a)( )
B RP B
≈
N N
(2b)( )
( )B A AP B A ≈N N (2c)
And Equation (1) reduces to P A B
( )
≈N( )B A NB .4.2. Two-Dimensional Case
Equation (1) can be easily extended to the case of two variables B and C:
(
,)
(
,(
)
)
( )
,
P B C A P A P A B C
P B C
⋅
= (3)
where: the notation B, C indicates the joint probability of having a certain value (or range of values) of the two variables. If, for example,
B I
≡
is rainfall inten-sity and C D≡ is rainfall duration, Equation (3) provides the probability of alandslide in response to a rainfall event of given duration and intensity.
In this paper, we selected Bayesian probability model applied for two-dimensional case to calculate landslide probability caused by two factors, rainfall intensity (mm/day) and rainfall duration (days).
4.3. Identification of Rainfall Events
According to Driver [31], construction of the Bayes probability model requires four steps and the first step is “decide on events to forecast”.
The first step in the evaluation of any rainfall threshold is to identify the rain-fall episodes that triggered the historical landslides, here referred as “triggering rainfall”. Ideally a triggering rainfall event should be a well-defined rainfall epi-sode, described by its duration, amount of precipitation, and intensity and clearly related to a given landslide. In some cases the identification is simple (for instance if the landslide occurred after a heavy rainfall preceded by a prolonged dry period) but usually it is not. Landslides may result from complex rainfall se-quences made of multiple bursts of variable duration and intensity that make it difficult to detect a well-defined triggering episode. The greatest uncertainties usually derive from the identification of the beginning of the triggering rainfall while the time of landsliding is taken as its end. A certain amount of time with-out rainfall (or limited rainfall) can be used as criterion to truncate the rainfall sequence that precedes a landslide event [21][32].
H. M. Do, K. L. Yin
DOI: 10.4236/ojg.2018.87040 686 Open Journal of Geology
We generally agreed to define the triggering event as a period of continuous or nearly continuous precipitation which starts with the onset of the rainfall (or with an abrupt increase of rainfall intensity in a period of light rain) and ends the day of occurrence of the landslide. For those landslides that have occurred after the end of the rainfall, the duration of the triggering event was set equal to the rainfall duration [21].
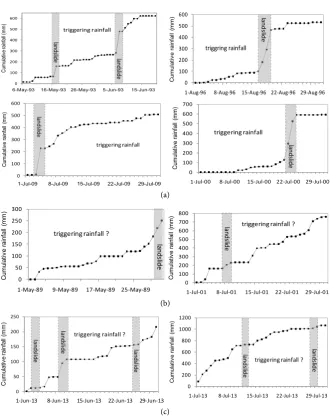
Based on the classification of Berti [21], each triggering rainfall was then clas-sified as 3 types: well-defined (type 1), uncertain (type 2), or undefined (type 3).
Type 1: Well-defined rainfall events can be clearly identified, as shown in the examples of Figure 6 (Type 1 Well-defined).
Type 2: Uncertain events consist of distinct rainfall episodes characterized by uncertain or subjective limits because of the presence of secondary rainfall epi-sodes (Figure 6, Type 2 Uncertain).
Type 3: Undefined events consist of all those landslides without a significant rainfall event close to the date of occurrence, such as landslides triggered during complex rainfall sequences (Figure 6, Type 3 Undefined). The difficulty to es-tablish the exact time of a landslide [6] and the influence of factors other than rainfall are of the main reasons for these undefined events.
4.3.1. One-Dimensional Case
In order to calculate the values of P(A), P(B), P(B|A), P(A|B) we selected only well-defined events (Type 1) for considering in Bayesian analysis. When using this method trigger rainfall must be reliably identified in order to get a reliable likelihood function P(B|A). Landslides triggered by other factors (Type 2 and 3) were then omitted [21].
Among 37 landslides triggered by rainfall events in the study area, we selected 26 well-defined rainfall events for the input data for Bayesian approach.
The analysis can be applied to the study area data set following the procedure described in Section 4.2.
The marginal rainfall probability P(B) is computed using the NR = 346 rainfall
events recorded (we only used rainfall data in the months that occurred landslide triggering rainfall events) in the period of 13 years (May of 1989; May and June of 1993; June of 1995; August of 1996 and 2008; July of 1997, 1998, 2000, 2001, 2004 and 2009; June and July of 2006; June, July and September of 2007). The conditional probability P A B
( )
using the NA = 26 well-definedrainfall that triggered the historical landslides. Prior landslide probability is therefore P(A) = NA/NR = 26/346 = 0.08. In Table 1 shows the database of the
study area which used to calculate the values of probability P(A), P B A
( )
, P(B)and P A B
( )
and the Table 2 shows the results after calculating. After that, weplotted the graphs to express the comparison of landslide probability P(A), prior rainfall probability P(B) and conditional probability P B A
( )
(Figure 7(a))and computed values of conditional landslide probability P A B
( )
with eachclassification of rainfall events (Figure 7(b)) as well.
DOI: 10.4236/ojg.2018.87040 687 Open Journal of Geology (a)
(b)
[image:14.595.207.538.60.479.2](c)
Figure 6. Some selection of triggering rainfall types based on cumulative rainfall in study
area. (a) Type 1: Well-defined; (b) Type 2: Uncertain; (c) Type 3: Undefined.
(a) (b)
Figure 7. One-dimensional Bayesian analysis in the period of 13 years of the study area:
(a) Comparison of prior landslide probability P(A), prior rainfall probability P(B), and conditional probability P(B|A) for three different classes of rainfall intensity; (b) Com-puted values of conditional landslide probability P(A|B) and comparison with prior landslide probability P(A).
0 100 200 300 400 500 600
6-May-93 16-May-93 26-May-93 5-Jun-93 15-Jun-93
Cum ulat ive r ainf all (m m ) triggering rainfall lan dslid e lan dslid e 0 100 200 300 400 500 600
1-Aug-96 8-Aug-96 15-Aug-96 22-Aug-96 29-Aug-96
C um ul at iv e r ai nf al l ( m m ) triggring rainfall la nd slid e 0 100 200 300 400 500 600
1-Jul-09 8-Jul-09 15-Jul-09 22-Jul-09 29-Jul-09
Cum ul at iv e r ai nf al l ( m m ) triggering rainfall lan dslid e 0 100 200 300 400 500 600 700
1-Jul-00 8-Jul-00 15-Jul-00 22-Jul-00 29-Jul-00
Cum ul at iv e r ai nf al l ( m m ) triggering rainfall lan dslid e 0 50 100 150 200 250 300
1-May-89 9-May-89 17-May-89 25-May-89
C um ul at iv e r ai nf al l ( m m )
triggering rainfall ?
la nd slid e 0 100 200 300 400 500 600 700 800
1-Jul-01 8-Jul-01 15-Jul-01 22-Jul-01 29-Jul-01
Cum ul at iv e r ai nf al l ( m m ) lan dslid e
triggering rainfall ?
0 50 100 150 200 250
1-Jun-13 8-Jun-13 15-Jun-13 22-Jun-13 29-Jun-13
C um ul at iv e r ai nf al l ( m m )
triggering rainfall ?
lan dslid e lan dslid e lan dslid e 0 200 400 600 800 1000 1200
1-Jul-13 8-Jul-13 15-Jul-13 22-Jul-13 29-Jul-13
C um ul at iv e r ai nf al l ( m m ) la nd slid e la nd slid e
triggering rainfall ?
0.85 0.06 0.09 0.31 0.15 0.54 0.0 0.1 0.2 0.3 0.4 0.5 0.6 0.7 0.8 0.9 1.0
0<I<40 40<I<65 I>65
Pr ob ab ili ty P(B) P(B|A) P(A)=0.08
Rainfall intensity, I (mm/day)
0.03 0.19 0.44 0.0 0.1 0.2 0.3 0.4 0.5
0<I<40 40<I<65 I>65
Pr
ob
ab
ili
ty
[image:14.595.210.536.522.657.2]H. M. Do, K. L. Yin
[image:15.595.57.539.102.154.2]DOI: 10.4236/ojg.2018.87040 688 Open Journal of Geology
Table 1. The information about the landslide events, total of rainfall events in 13 years and the classification of calculated
thre-sholds for daily rainfall intensity data.
Total rainfall
events
Number of daily rainfall intensity with
0 < I < 40 mm/day
Number of landslide with 0 < I < 40 mm/day
Number of daily rainfall intensity with
40 < I < 65 mm/day
Number of landslide with 40 <
I < 65 mm/day
Number of daily rainfall intensity with I > 65 mm/day
Number of landslide with I > 65 mm/day
Total landslide
346 293 8 21 4 32 14 26
Table 2. The probability values of one-dimensional Bayesian analysis that calculated based on daily rainfall intensity of the study
area in the period of 13 years.
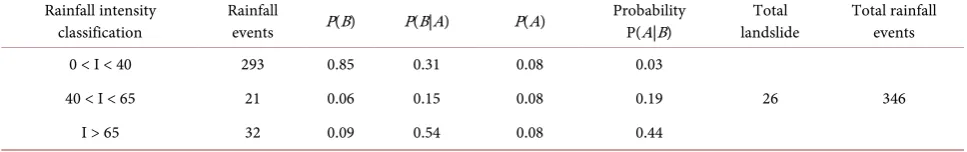
Rainfall intensity
classification Rainfall events P(B) P(B|A) P(A) Probability P(A|B) landslide Total Total rainfall events 0 < I < 40 293 0.85 0.31 0.08 0.03
26 346 40 < I < 65 21 0.06 0.15 0.08 0.19
I > 65 32 0.09 0.54 0.08 0.44
with two types of rainfall data that are daily rainfall and hourly rainfall for estimating the values of probabilities in two ways one-dimensional and two-dimensional Baye-sian analysis for only 2013. The results of one-dimensional BayeBaye-sian analysis shows in Table 3, Table 4 and Figure 8, and the results of two-dimensional Bayesian analysis will be presented in Section 4.4.2.
4.3.2. Two-Dimensional Case
Two-dimensional Bayesian analysis evaluates the conditional probability of the event given the joint occurrence of two control variables (Section 4.2).
In order to calculate the values of probability in two-dimensional Bayesian probability model requires the data collection in more detail and based on the rainfall intensity and duration. Because of the hourly rainfall data are not fre-quently available especially for a long period of time in the past. Therefore, we only had collected this type of data in 4 years, from 2010 to 2013 in 6 months of rainy seasons (from May to October). Although, our landslide database be col-lected to 2013 but these are unavailable in during three years from 2010 to 2012. So that, we have to be use the landslide data in three months, from May to July of 2013 for calculating the parameters of two-dimensional Bayesian probability model.
[image:15.595.56.540.201.277.2]DOI: 10.4236/ojg.2018.87040 689 Open Journal of Geology
Table 3. The information about the landslide events, total of rainfall events in June and July of 2013 and the classification of
cal-culated thresholds for daily rainfall intensity data.
Total rainfall events
Number of daily rainfall intensity with
0 < I < 40 mm/day
Number of landslide with 0 < I < 40 mm/day
Number of daily rainfall intensity with 40 < I < 65
mm/day
Number of landslide with 40 <
I < 65 mm/day
Number of daily rainfall intensity
with I > 65 mm/day
Number of landslide with I > 65 mm/day
Total landslide
[image:16.595.57.538.199.513.2]51 40 3 5 3 6 4 10
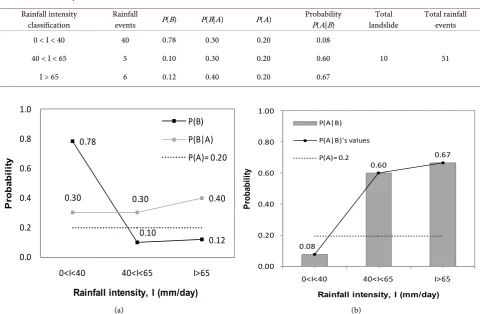
Table 4. The probability values of one-dimensional Bayesian analysis that calculated based on daily rainfall intensity of the study
area in June and July of 2013.
Rainfall intensity
classification Rainfall events P(B) P(B|A) P(A) Probability P(A|B) landslide Total Total rainfall events 0 < I < 40 40 0.78 0.30 0.20 0.08
10 51 40 < I < 65 5 0.10 0.30 0.20 0.60
I > 65 6 0.12 0.40 0.20 0.67
(a) (b)
Figure 8. One-dimensional Bayesian analysis in June and July of 2013: (a) Comparison of prior landslide probability P(A), prior
rainfall probability P(B), and conditional probability P(B|A) for three different classes of rainfall intensity; (b) Computed values of conditional landslide probability P(A|B) and comparison with prior landslide probability P(A).
rainfall threshold of the study area which established in Section 3.2 with RT=
40.8 − 0.201R3ad.
1) Rainfall events has I ≤ 40 mm/day and D ≤ 0.3 day, 2) Rainfall events has I ≤ 40 mm/day and D > 0.3 day, 3) Rainfall events has I >40 mm/day and D ≤ 0.3 day, and 4) Rainfall events has I >40 mm/day and D > 0.3 day.
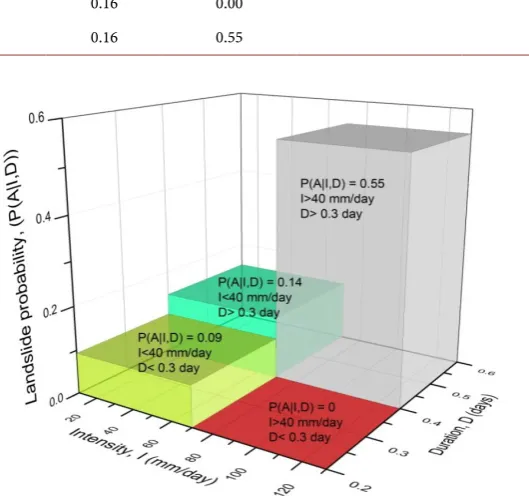
Based on Table 5, we calculated the values of P(I|D), P(I,D|A), P(A) and
P(A|I,D) and expresses in Table 6. The 3D bars of the conditional landslide probability for four different combinations of rainfall intensity and rainfall dura-tion shows in Figure 9.
0.78
0.10
0.12
0.30 0.30 0.40
0.0 0.2 0.4 0.6 0.8 1.0
0<I<40 40<I<65 I>65
P ro ba bi lit y
P(B) P(B|A) P(A)= 0.20
Rainfall intensity, I (mm/day)
0.08 0.60 0.67 0.00 0.20 0.40 0.60 0.80 1.00
0<I<40 40<I<65 I>65
Pr
ob
ab
ili
ty
Rainfall intensity, I (mm/day)
H. M. Do, K. L. Yin
[image:17.595.56.539.89.179.2]DOI: 10.4236/ojg.2018.87040 690 Open Journal of Geology
Table 5. Rainfall intensity-duration that did and did not result in landslides in May, June and July in 2013.
Classification of rainfall
intensity-duration (RID) RID did result in landslides RID did not result in landslides Total of RID events of each class Total of landslide events Total of RID events I ≤ 40 & D ≤ 0.3 4 39 43
11 68
[image:17.595.52.538.228.315.2]I ≤ 40 & D > 0.3 2 12 14 I > 40 & D ≤ 0.3 0 0 0 I > 40 & D > 0.3 6 5 11
Table 6. The probability values of two-dimensional Bayesian analysis that calculated based on rainfall intensity and duration of
the study area in May, June and July in 2013.
Classification of rainfall
intensity-duration (RID) P(I|D) P(I,D|A) P(A) P(A|I,D) Total of landslide events Total of RID events I ≤ 40 & D ≤ 0.3 0.63 0.36 0.16 0.09
11 68
[image:17.595.248.513.290.538.2]I ≤ 40 & D > 0.3 0.21 0.18 0.16 0.14 I > 40 & D ≤ 0.3 0.00 0.00 0.16 0.00 I > 40 & D > 0.3 0.16 0.55 0.16 0.55
Figure 9. 3D bars of conditional landslide probability for four
differ-ent combination of rainfall intensity and duration of study area in three months May, June and July in 2013.
5. Discussion
According to the main objectives of the paper, we proposed a rainfall threshold model for landslide initiation based on the relationship between the rainfall events and the historical landslide records. Besides this method, a Bayesian ap-proach to estimate the probability of landsliding conditional to characteristics of rainfall events to shows the possible risk of landslide occurrence.
DOI: 10.4236/ojg.2018.87040 691 Open Journal of Geology
implement. Data required for the model are derived from the landslide events in the past and daily rainfall records. The selection of the most suitable rainfall threshold model for the study area is based on historical landslide records and daily rainfall records in the period of 13 years, and the works to establish rainfall threshold equations from the relationships of landslides triggered by the rainfall events with antecedent rainfall in 3 days, 5 days, 7 days, 10 days and 15 days. Moreover, a validation of the rainfall threshold was also implemented and the results of this work has supported our selection is appropriate for the study area.
Jaiswal and Van Westen [11] have showed numerous publications on the
re-gionally-derived thresholds of rainfall intensity and duration for landslides are available [7][29]. Different climatic regions have shown different threshold val-ues for rainfall intensities. Guzzetti [7] have attributed the observed differences may be a direct result of climate on the meteorological conditions that result in shallow hill-slope failures, or an indirect consequence modulated through mor-phology, soil types, and vegetation cover.
Selection a rainfall threshold method that building based on rainfall intensity and duration for this study area is not suitable because of the limitation of his-torical landslide records, rainfall records as well as rain gauge station network.
Bayesian probability model applied to calculate the probabilities of landslide occurrence in the study area follow two cases, one-dimensional case and two-dimensional case. In the first case, we determined that the selection of the input data is the most important steps. Therefore, only 26 landslide events in the past selected to take part in the calculation of the model. Beside, the ideal to classify the rainfall intensity threshold applied for the study area was also eva-luated carefully basing on the fact of data. According to the rainfall threshold equation that we suggested for the study area in Section 3.2, the classification of rainfall intensity threshold to compute values of conditional landslide probabili-ty was applied from this rainfall threshold equation. In the second case, due to the unavailable of hourly rainfall database in the period of 13 years. The applica-tion of Bayesian probability model in the case of two-dimensional cannot carry out in this period. Hence, only the hourly rainfall data in May, June and July of 2013 (a unique hourly rainfall data that we collected) was took part in calculat-ing the values of probability of this case. In this area, two variables that used for evaluating of two-dimensional Bayesian probability were rainfall intensity and rainfall duration. The classification of rainfall intensity threshold was also based on the same way in one-dimensional Bayesian probability to compute the values of the conditional probability.
Computed values of conditional landslide probability-P(A|B) in one-dimensional case in the period of 13 years in comparison with the values of its in May, June and July of 2013 have the differential levels relative clearly. These differences can explain as a simple way by the unavailable of the database.
gen-H. M. Do, K. L. Yin
DOI: 10.4236/ojg.2018.87040 692 Open Journal of Geology
eration of landslide inventory maps and databases is a tedious procedure. Landslides have to be mapped and described one by one, and each one might have different characteristics. In most countries there is no single agency that has the responsibility for maintaining a landslide database. At best, several or-ganizations, such as the public works department or road department, will deal only with those landslides that have affected their area of interest (e.g., road network), resulting in incomplete and biased databases. Newspaper and other historical records only record those events that caused substantial damage. Uni-versities and research institutes do work on landslide inventory maps but mostly as part of a research project, with a limited duration, after which a landslide da-tabase is no longer kept up-to-date. Therefore, it is very difficult to obtain landslide inventory maps that are complete, both with respect to the area cov-ered and to the time period investigated [33].
Determining temporal probability is done either by correlating the data on landslide occurrences with those of the triggering factors (provided that the his-torical records are sufficient for this) or through dynamic modelling [33]. Jaiswal
and Van Westen [11] proposed a method that based on the Poisson model to
determine the temporal probability of landslide initiation along transportation routes. The model is applicable to shallow debris slides and debris flows asso-ciated with cut slopes and triggered by rainfall. This method is suitable with his study area because of the plenty of the historical landslide records and rainfall records and having a rain gauge station network good enough for applying Poisson model.
With the limitations of database and a lack of rain gauge station network that can be distributed regularly in the study area, so we cannot produce a map on spatial landslide probability distribution as in the research results of Berti [21]. Although we confront with many difficulties about the database but the results of this paper need to encourage and apply widely in the high risk areas of landslide hazard, especially in the mountainous area of Vietnam.
Finally, we still believe that the results of this paper can helps local authorities and local people to be aware of the negative impacts of landslides triggered by rainfall events as well as help them in the selection the most suitable develop-ment planning methods for the study area to avoid badly effects, risk mitigation and damages in the future.
6. Conclusions
In the study area, landslide triggering is significantly controlled by an empirical minimum rainfall threshold: RT = 40.8 − 0.201R3ad. The Bayesian probability
DOI: 10.4236/ojg.2018.87040 693 Open Journal of Geology
landslide probability P(A|B) from two-dimensional case of Bayesian approach are clearly controlled by rainfall intensity > 40 mm with rainfall duration > 0.3 day.
We have proposed an approach by combining an empirical minimum rainfall threshold model with a probability model for determining probability of landslide occurrence over an area by using Bayesian probability method. In this model, the value of minimum rainfall threshold of the study area is an important referential parameter related to rainfall intensity and rainfall duration for the application of Bayesian probability method in calculating the probability of landslide occurrence.
The model may not be applicable if the exact dates of landslide events in the past are not known. The results of the model will be better if the input data on daily rainfall, hourly rainfall from a well-distributed network of rain gauges is combined with the actual dates of landslide occurrences.
The computed landslide probability is dependent strongly on a well-distributed network of rain gauges in a well-defined area.
From the results of this research, we also want to continue our studies in other mountainous area of Vietnam as future works. To fulfill this objective, the in-stallation of a well-distributed network of rain gauges in mountainous area of Vietnam is a strong recommendation of us in order to test the practical effec-tiveness of the proposed method in a wide variety of geological conditions.
Acknowledgements
We acknowledge the help of the Vietnam Institute of Geosciences and Mineral Resources (VIGMR) for providing relevant data and support. This paper was carried out as a part of the first author’s PhD studies at the Faculty of Engineer-ing, China University of Geosciences (Wuhan), China. The authors also thank the three anonymous reviewers of Open Journal of Geology for relevant com-ments and Joanna Cheng, the Managing Editor, for assistance.
References
[1] Caine, N. (1980) The Rainfall Intensity-Duration Control of Shallow Landslides and Debris Flows. Geografiska Annaler A, 62, 23-27.
[2] Crosta, G. (1998) Rationalization of Rainfall Threshold: An Aid to Landslide Ha-zard Evaluation. Environmental Geology, 35, 131-145.
https://doi.org/10.1007/s002540050300
[3] Crozier, M.J. (1999) Prediction of Rainfall-Triggered Landslides: A Test of the An-tecedent Water Status Model. Earth Surface Processes and Landforms, 24, 825-833. https://doi.org/10.1002/(SICI)1096-9837(199908)24:9<825::AID-ESP14>3.0.CO;2-M
[4] Aleotti, P. (2004) A Warning System for Rainfall-Induced Shallow Failures. Engi-neering Geology, 73, 247-265.https://doi.org/10.1016/j.enggeo.2004.01.007
H. M. Do, K. L. Yin
DOI: 10.4236/ojg.2018.87040 694 Open Journal of Geology
[6] Guzzetti, F., Peruccacci, S., Rossi, M. and Stark, C.P. (2007) Rainfall Thresholds for the Initiation of Landslides in Central and Southern Europe. Meteorology and At-mospheric Physics, 98, 239-267.https://doi.org/10.1007/s00703-007-0262-7
[7] Guzzetti, F., Peruccacci, S., Rossi, M. and Stark, C.P. (2008) The Rainfall Intensi-ty-Duration Control of Shallow Landslides and Debris Flows: An Update.
Landslides, 5, 3-17.https://doi.org/10.1007/s10346-007-0112-1
[8] Saito, H., Nakayama, D. and Matsuyama, H. (2010) Relationship between the Initia-tion of a Shallow Landslide and Rainfall Intensity-DuraInitia-tion Thresholds in Japan.
Geomorphology, 118, 167-175. https://doi.org/10.1016/j.geomorph.2009.12.016
[9] Glade, T., Crozier, M. and Smith, P. (2000) Applying Probability Determination to Refine Landslide-Triggering Rainfall Thresholds Using an Empirical “Antecedent Daily Rainfall Model”. Pure and Applied Geophysics, 157, 1059-1079.
https://doi.org/10.1007/s000240050017
[10] Zêzere, J.L., Trigo, R. and Trigo, I. (2005) Shallow and Deep Landslides Induced by Rainfall in the Lisbon Region (Portugal): Assessment of Relationships with the North Atlantic Oscillation. Natural Hazards and Earth System Sciences, 5, 331-344. https://doi.org/10.5194/nhess-5-331-2005
[11] Jaiswal, P. and Van Westen, C.J. (2009) Estimating Temporal Probability for Landslide Initiation along Transportation Routes Based on Rainfall Thresholds.
Geomorphology, 112, 96-105. https://doi.org/10.1016/j.geomorph.2009.05.008
[12] Lee, D.-H., Lai, M.-H., Wu, J.-H., Chi, Y.-Y., Ko, W.-T. and Lee, B.-L. (2013) Slope Management Criteria for Alishan Highway Based on Database of Heavy Rain-fall-Induced Slope Failures. Engineering Geology, 162, 97-107.
https://doi.org/10.1016/j.enggeo.2013.04.012
[13] Zêzere, J.L., Pereira, T.V.S., Oliveira, S.C., Marques, R. and Garcia, R.A.C. (2015) Rainfall Thresholds for Landslide Activity in Portugal: A State of the Art. Environ-mental Earth Sciences, 73, 2917-2936. https://doi.org/10.1007/s12665-014-3672-0
[14] Lainas, S., Sabatakakis, N. and Koukis, G. (2016) Rainfall Thresholds for Possible Landslide Initiation in Wildfire-Affected Areas of Western Greece. Bulletin of En-gineering Geology and the Environment, 75, 883-896.
https://doi.org/10.1007/s10064-015-0762-5
[15] Afungang, R.N. and Bateira, C.V. (2016) Temporal Probability Analysis of Landslides Triggered by Intense Rainfall in the Bamenda Mountain Region, Came-roon. Environmental Earth Sciences, 75, 1032.
https://doi.org/10.1007/s12665-016-5835-7
[16] Palenzuela, J.A., Jiménez-Perálvarez, J.D., Chacón, J. and Irigaray, C. (2016) As-sessing Critical Rainfall Thresholds for Landslide Triggering by Generating Addi-tional Information from a Reduced Database: An Approach with Examples from the Betic Cordillera (Spain). Natural Hazards, 84, 185-212.
https://doi.org/10.1007/s11069-016-2416-8
[17] Naidu, S., Sajinkumar, K.S., Oommen, T., Anuja, V.J. and Samuel, R.A. (2017) Early Warning System for Shallow Landslides Using Rainfall Threshold and Slope Stabil-ity Analysis. China UniversStabil-ity of Geosciences, Geoscience Frontiers, Beijing, 1-12.
https://doi.org/10.1016/j.gsf.2017.10.008
[18] Peruccacci, S., Brunetti, M.T., Gariano, S.L., Melillo, M., Rossi, M. and Guzzetti, F. (2017) Rainfall Thresholds for Possible Landslide Occurrence in Italy. Geomor-phology, 290, 39-57. https://doi.org/10.1016/j.geomorph.2017.03.031
Acti-DOI: 10.4236/ojg.2018.87040 695 Open Journal of Geology
vation of Shallow Landslides in the Italian Alps: The Role of Environmental Condi-tioning Factors. Geomorphology, 303, 53-67.
https://doi.org/10.1016/j.geomorph.2017.11.009
[20] Floris, M. and Bozzano, F. (2008) Evaluation of Landslide Reactivation: A Modified Rainfall Threshold Model Based on Historical Records of Rainfall and Landslides.
Geomorphology, 94, 40-57.https://doi.org/10.1016/j.geomorph.2007.04.009
[21] Berti, M., Martina, M.L.V., Franceschini, S., Pignone, S., Simoni, A. and Pizziolo, M. (2012) Probabilistic Rainfall Thresholds for Landslide Occurrence Using a Bayesian Approach. Journal of Geophysical Research, 117, F04006.
https://doi.org/10.1029/2012JF002367
[22] Bui, D.T., Pradhan, B., Lofman, O., Revhaug, I. and Dick, O.B. (2013) Regional Pre-diction of Landslide Hazard Using Probability Analysis of Intense Rainfall in the Hoa Binh Province, Vietnam. Natural Hazards, 66, 707-730.
https://doi.org/10.1007/s11069-012-0510-0
[23] Long, N.T. (2008) Landslide Susceptibility Mapping of the Mountainous Area in a Luoi District, Thua Thien Hue Province, Vietnam. PhD Dissertation, Vrije Univer-sity of Brussel, Brussel, 255 p.
[24] Hue, T.T., Duong, T.V., Toan, D.V., Nghinh, L.T., Minh, V.C., Pho, N.V., Xuan, P.T., Hoan, L.T., Huyen, N.X., Pha, P.D., Chinh, V.V. and Thom, B.V. (2004) In-vestigation and Assessment of the Types of Geological Hazard in the Territory of Vietnam and Recommendation of Remedial Measures. Phase II: A Study of the Northern Mountainous Province of Vietnam. Institute of Geological Sciences, Vietnam Academy of Science and Technology, Hanoi, 361 p. (In Vietnamese) [25] Thinh, D.V., Dong, N.P., Hong, P.M., Hung, P.V., Khoi, T.N., Ke, T.D., Phu, D.V.,
Thang, P.X., Thanh, P.V., Thang, P.H., Thay, B.V., Thinh, N.T., Thien, T.V., Tu, M.T. and Vinh, B.X. (2005) The Investigated Report of Natural Hazards in the Northwest of Vietnam. Northern Geological Mapping Division, Hanoi. (In Viet-namese)
[26] Khien, N.X., Hung, L.Q., Long, N.T. and Hien, D.M. (2012) Assessment of Status Geohazards in Four Mountainous Provinces in North of Viet Nam. In: Giang, H., Kan, B., Bang, C. and Quang, T., Eds., Identification of Sources, Prediction and Propose Preventive Measures and Consequences Mitigation, Vietnam Institute of Geosciences and Mineral Resources, Hà Nội, 322. (In Vietnamese)
[27] Hung, L.Q., Van, N.T.H., Son, P.V., Ninh, N.H., Tam, N. and Huyen, N.T. (2017) Landslide Inventory Mapping in the Fourteen Northern Provinces of Vietnam: Achievements and Difficulties. 4th World Landslide Forum, Ljubljana, 29 May-2 June 2017, 501-510.
[28] Polemio, M. and Sdao, F. (1999) The Role of Rainfall in the Landslide Hazard: The Case of the Avigliano Urban Area (Southern Apennines, Italy). Engineering Geolo-gy, 53, 297-309. https://doi.org/10.1016/S0013-7952(98)00083-0
[29] Dahal, R.K. and Hasegawa, S. (2008) Representative Rainfall Thresholds for Landslides in the Nepal Himalaya. Geomorphology, 100, 429-443.
https://doi.org/10.1016/j.geomorph.2008.01.014
[30] Martelloni, G., Segoni, S., Fanti, R. and Catani, F. (2011) Rainfall Thresholds for the Forecasting of Landslide Occurrence at Regional Scale. Landslides, 9, 485-495.
https://doi.org/10.1007/s10346-011-0308-2
H. M. Do, K. L. Yin
DOI: 10.4236/ojg.2018.87040 696 Open Journal of Geology
[32] Brunetti, M.T., Peruccacci, S., Rossi, M., Luciani, S., Valigi, D. and Guzzetti, F. (2010) Rainfall Thresholds for the Possible Occurrence of Landslides in Italy. Natu-ral Hazards and Earth System Sciences, 10, 447-458.
https://doi.org/10.5194/nhess-10-447-2010