Experimental study of a new type of floating breakwater
Chun-Yan Jia, Xiang Chena, Jie Cuia,*, Zhi-Ming Yuanb , Atilla Incecikb
a School of Naval Architecture and Ocean Engineering, Jiangsu University of Science and Technology,
Zhenjiang 212003, China
b Department of Naval Architecture, Ocean and Marine Engineering, University of Strathclyde, Glasgow,
UK
Corresponding Author:
Dr. Cui Jie
Tel: +86-511-84414922
Mobile: +8615050856887
Fax: +86-511-84404433
E-mail: [email protected]
Abstract
A new type of floating breakwater (FB) was proposed in this paper. Its hydrodynamic performance
was tested. The structure of the new breakwater named cylindrical floating breakwater (CFB) consists of two parts: a main body of rigid cylinders, and a flexible mesh cage containing a number of suspending balls that are intended to absorb the wave energy into their mechanical energy. A series of experiments
were carried out on the new floating breakwater and traditional double pontoons and box floating breakwaters to compare their performances. A two-dimensional wave flume was used in the experiment;
the incident and transmitted waves, the tensions on the mooring lines and the motion responses of the floating breakwaters were measured. Results showed that the new floating breakwater had a better performance than the traditional double pontoons and the box floating breakwaters: wave transmission
was significantly reduced by the mesh cage with the balls, especially for long waves.
Keywords: Floating breakwater; Experimental study; New cylindrical type; Wave transmission
coefficient; Mooring forces; Motion responses
1. Introduction
Breakwater is a common coastal engineering structure. It is mainly used to protect engineering structures and ships in the harbor against waves. Traditional breakwaters are bottom-fixed. As the ocean
exploration gradually extends to deep sea, the cost of bottom-fixed breakwaters becomes huge and the construction becomes difficult. Therefore, the floating breakwater becomes one of the key technology of
harbor construction projects around the world.
The most common type of floating breakwater is of a single pontoon type. Pontoon floating
breakwater is generally made of ferroconcrete in cuboid shapes. Its width is about 8m and the draft ranges from 1.5m to 4m. S.A. Sannasiraj et al. (1998) conducted experimental and theoretical investigations on the behavior of pontoon-type floating breakwaters. The motion responses and mooring
forces were measured for three different mooring configurations. The comparison between the theoretical and experimental measurements showed good agreement except for the roll resonance frequency. The
configurations studied. Many novel floating breakwaters based on pontoons are designed to reduce the
wave transmission coefficient. Fang he et al. (2012, 2013) investigated experimentally the hydrodynamic performance of floating breakwaters with and without pneumatic chambers. The experimental results showed that the pneumatic chambers significantly enhanced the wave energy dissipation and reduced the
wave transmission. A 2D numerical wave tank model was used to simulate interactions between water waves and inclined-moored submerged floating breakwaters by Wei Peng et al. (2013); the applicability
and validity of the model were further confirmed by comparing the numerical and experimental results. In order to increase the inertia without increasing total mass, two single pontoons are connected to construct a double pontoons floating breakwater. Double pontoons floating breakwater attenuates waves
in the same way as a single pontoon, but in addition reduces the wave field through turbulence between the two floating bodies. In order to obtain hydrodynamic parameters or mooring line tension of the
double pontoons floating breakwater, various numerical and experimental methods were applied. The hydrodynamic properties of a dual pontoon floating breakwater consisting of a pair of floating cylinders of rectangular cross-section connected by a rigid deck have been investigated theoretically (A.N.
Williams and A.G. Abul-Azm, 1997). Results showed that the wave reflection properties of the structure depend strongly on the draft and spacing of the pontoons and the mooring line stiffness. A
two-dimensional numerical estimation method of calculating dynamics of a pontoon type submerged floating breakwater and the forces acting on its mooring lines due to the wave action were investigated (Md. Ataur Rahman et al., 2006). The comparison between the numerical and the experimental results
confirmed the validity of the numerical model and the good performance on wave energy dissipation. Weng Wen-Kai and Chou Chung-Ren (2007) compared experimental results and numerical results to find
a good agreement for a wide range of parameters. The results illustrated that the clear space has a great effect upon responses of the structure; it not only changes the natural frequency of the structure, but causes heave motion to have a peak response in high frequency range.
The results of the above studies show that a double pontoons floating breakwater is efficient to dissipate the wave energy of short waves, however, it is not as efficient in attenuating long waves.
Although the better attenuation effect can be obtained by increasing the width of the floating breakwater, it will greatly increase the cost. Since 98% of the wave energy is under the waterline, more and more researchers focus on designing new types of floating breakwaters that disturbs the particle orbit. Π shaped
floating breakwater was analyzed by Mohamed R. Gesraha (2006). Through comparison to a rectangular one with the same mass and under-tip clearance, it was found that adding side-boards results in higher
added mass and heave damping coefficients but lowers other damping coefficients, which resulted in smaller responses and transmission coefficient. In 1991, Mani designed a Y-frame floating breakwater with a row of cylinders installed under a pontoon. This structure disturbed particle orbit to reduce wave.
When B/L (B is the width of the breakwater and L the wave length) is 0.15, the transmission coefficient could be below 0.5. A study of spar buoy floating breakwater was conducted by Nai-Kuang Liang et al.
(2004). The results revealed that the maximum slant wire tension is influenced mainly by the pipe diameter and the wave, not the net buoyancy of the spar buoy and proved that the spar buoy floating breakwater can be a supplementary breakwater for traditional breakwaters or a beach for swimming. A. S.
Koraima and O. S. Rageh studied the hydrodynamic performance of floating breakwater with under connected plates experimentally in 2013. The results showed that the efficiencies of transmission and
reflection increase with the number of the plates.
The experimental results showed that the board-net floating breakwater, which is a simple and
inexpensive type of structure, can effectively protect fish and fish cages and may be adopted for aquaculture engineering in deep-water regions. Interaction of surface gravity waves with multiple vertically moored surface-piercing membrane breakwaters in finite water depth is analyzed based on the
linearized theory of water waves (D. Karmakar et al., 2012). The comparison of the results for various fixed and moored edge conditions is analyzed for reflection and transmission coefficients. The conclusion
showed that in the case of single surface-piercing membrane, with the increase in the length of the membrane and the tension of the membrane the wave reflection increases and the presence of multiple floating breakwater helps in the reduction of wave height in the transmitted region. A.S. Koraim (2013)
conducted study on a new type of breakwater which consisted of one or more horizontal rows of half pipes suspended on supporting piles. With the number of rows increasing, the efficiency of breakwaters
increases.
Although many scholars were devoted to increase the efficiency of the floating breakwaters, research development is still very limited. There is still a large gap between current technology and
demands. This paper presents a new configuration of floating breakwater. A series of experiments in a two-dimensional wave flume were conducted to investigate the wave attenuation of the new type of
breakwater. The physical model study of floating breakwaters focused on their transmission coefficients, motion responses, as well as the tension in their mooring lines, under regular wave conditions. Comparative experiments were also conducted among the new types of breakwaters, traditional double
pontoons breakwaters and box breakwater.
2. Configuration design
2.1 Configuration design of the new type of floating breakwater
As we know, double pontoons can increase the inertia to reduce motion responses without increasing mass. In addition, the use of double pontoons type increases the width of floating breakwater euphemistically. By this way, we can build wider floating breakwater to improve wave attenuation with the same materials.
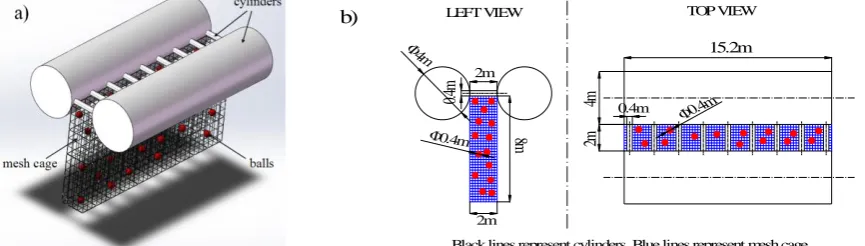
Therefore, a new type of floating breakwater based on the traditional double pontoon breakwater is designed in this paper. The main structure which is shown in Fig.1 is made out of two 4 m (diameter) ╳ 15.2 m (length) cylinders and nine 0.4 m (diameter) ╳ 2 m (length) cylinders. These cylinders are made of reinforced concrete. Since 98% of the wave energy is under the waterline, we designed a 15.2 m long, 2 m wide and 8 m high mesh cage hanging below the main structure. This flexible structure can disturb particle orbit and reduce the cost. Moreover, 1200 rubber hollow balls of 0.4m diameter are put into the mesh cage to enhance the wave energy dissipation. The density of the balls is similar to water so they can move freely.
2.2 Configuration design of comparative floating breakwaters
In order to research the effectiveness of balls, we designed a comparative configuration based on the new type of floating breakwater. This floating breakwater is made out of two 4 m (diameter) ╳ 15.2 m (length) cylinders and nine 0.4 m (diameter) ╳ 2 m (length) cylinders. And the 15.2 m long, 2 m wide and 8 m high mesh cage also be hung below the main structure. But there are no balls in it.
╳ 15.2 m (length) cylinders and nine 0.4 m (diameter) ╳ 2 m (length) cylinders without mesh cage and balls as the triditional double pontoons floating breakwater.
Meanwhile, the most common floating breakwater is the box type. So we designed a box floating breakwater to testify the effectiveness of the new type of floating breakwater. The box floating breakwater is 15.2 m long, 10 m wide and 4 m high.
Φ 4m
2m
0.
4m
8m
2m
Φ0.4m
15.2m
4m
2m
0.4m Φ0.4m
TOP VIEW LEFT VIEW
Black lines represent cylinders, Blue lines represent mesh cage, Red lines represent balls
b)
Fig.1 a) the 3-D sketch and b) the dimensions of the new configuration
3. Experiments
3.1 Experimental facilities and instruments
The experiments were conducted in a two-dimensional wave flume of the Hydraulics Modeling Laboratory of Ocean University of China. The wave flume is 60 m long, 3.0 m wide and 1.5 m deep. For this study, its width was reduced to 0.8 m, in order to be concordant with the chosen scale. A piston-type wave-maker was installed at one end of the flume and a wave-absorbing beach was located at the other end to reduce wave reflection.
3.2 Model scale
In accordance with the dimensions of the experimental facilities and the tested wave conditions, we used a geometrical similarity scale of 1:20 for the model.
3.3 Experimental models
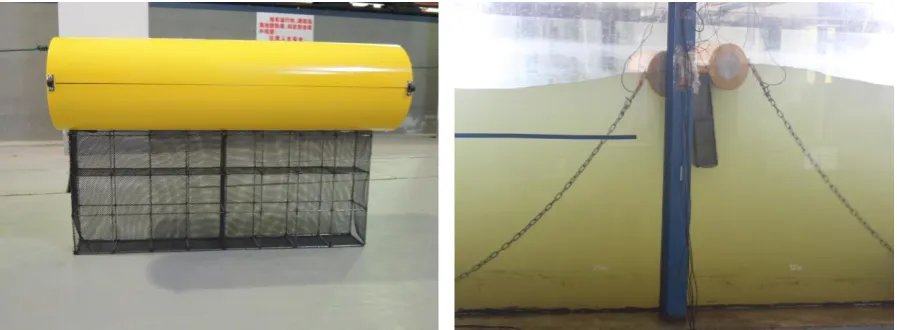
[image:4.595.79.512.175.298.2]In order to investigate the wave protection effect of the new type floating breakwater, four models were designed according to the similarity theory. Three of these models were cylindrical floating breakwaters. Model 1 was the traditional cylindrical floating breakwater without mesh cage and balls. To study the effect of the mesh cage and balls, Model 2 has a mesh cage but no balls, while Model 3 has both. Model 4, a traditional box type floating breakwater, was mainly used as comparison in wave attenuation to the new type floating breakwater. Main parameters of the four models are listed in Table 1 and photos are shown in Figs. 2-5.
Table 1
Main parameters of four models
Length
(mm)
Width
(mm)
Height
(mm)
Draught
(mm)
Mass
(kg)
Roll inertia
(kg*m2)
Gravity Center
[image:4.595.79.531.725.758.2]Model 1 760 500 200 100 19.1 0.474 100
Model 2 760 500 510 100 20.1 0.537 400
Model 3 760 500 510 100 20.1 0.537 400
[image:5.595.76.531.127.341.2]Model 4 760 500 200 100 28.6 0.669 71
[image:5.595.80.529.393.558.2]Fig. 2 Model 1
Fig. 4 Model 3
Fig. 5 Model 4
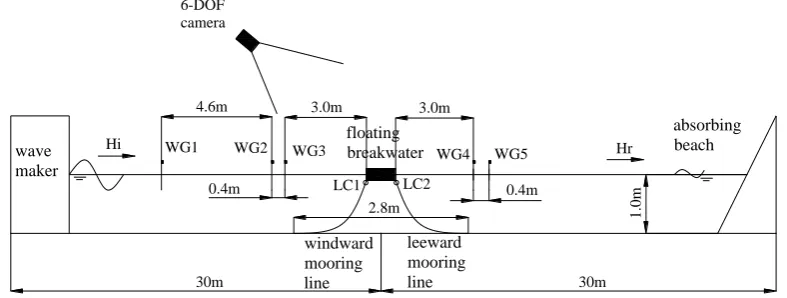
Figs. 6-7 show sketches of the experiment setups. In Fig. 6, the FB was slack-moored in its equilibrium position. Each mooring line was made of stainless steel and had a length of 1.6 m with a line density of 0.63 kg/m. To measure the forces acting on the mooring lines, two load cells (LCs) were connected with the windward and the leeward mooring lines, respectively.
wave maker
absorbing beach floating
breakwater
windward mooring line
WG1 WG2 WG3 WG4 WG5
leeward mooring line
Hi Hr
6-DOF camera
4.6m 3.0m 3.0m
0.4m 0.4m
30m 30m
2.8m
LC1 LC2
[image:6.595.109.503.595.744.2]Fig. 6 Sketch of floating breakwater
floating breakwater Incident
wave
X
Y O floatingbreakwater
Incident wave
Z
Y O
Fig. 7 The coordinate system of breakwater
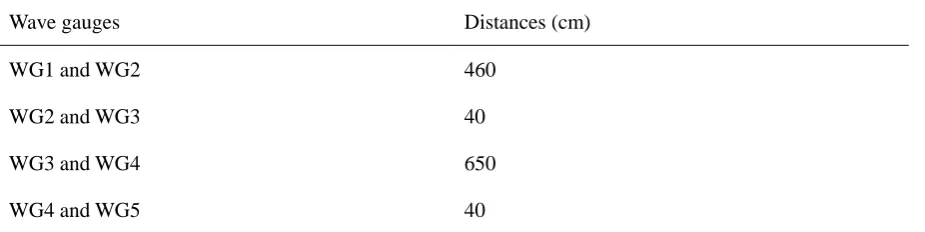
[image:7.595.75.538.383.499.2]Five wave gauges (WGs) were used to measure the surface elevation; one was close to the wave-maker to measure incident wave condition, two were placed in front of the models to distinguish the incident waves from the reflected waves, and the other two at the back of the models to distinguish the transmitted waves from the reflected waves from the wave absorbing beach. The distances between the wave gauges are listed in Table 2.
Table 2
Distances between wave gauges
Wave gauges Distances (cm)
WG1 and WG2 460
WG2 and WG3 40
WG3 and WG4 650
WG4 and WG5 40
3.4 Experimental conditions
[image:7.595.75.531.633.753.2]Regular waves were studied at the prototype water depth of 20 m. For regular wave, the prototype wave heights (Hp) were 2.0, 2.5, 3.0, 3.5 and 4.0 m; the prototype wave period (Tp) ranged from 4.02 to 6.26 s. According to the experimental model scales, the experimental wave periods (T) ranged from 0.9 to 1.4 s, and the experimental wave heights (H) from 0.1 to 0.2 m. Details are presented in Table 3.
Table 3
Experimental test conditions
Hp (m) Tp (s) H (m) T (s)
2.0 4.47 0.1 1
2.5 4.47 0.125 1
3.0 4.02, 4.47, 4.92, 5.37, 5.81, 6.26 0.15 0.9, 1.0, 1.1, 1.2, 1.3, 1.4
4.0 4.47, 4.92, 5.37, 5.81, 6.26 0.2 1.0, 1.1, 1.2, 1.3, 1.4
4. Result and discussions
Goda and Suzuki introduced a two-point method to separate the amplitudes of incident waves (Ai) and reflected waves (Ar) with the measured surface elevations. The amplitude of incident wave (Ai) is separated with the data from WGs 2-3 and the amplitude of transmitted wave (At) with WGs 4-5. We defined the transmission coefficient (Kt) as At/Ai.
Amplitudes of sway, heave and roll were collected by a 6-DOF camera. The amplitude of motion was defined as the oscillation amplitude relative to the mean position of the breakwater in waves.
Meanwhile, Fw and Fl were defined as the peak values of the forces acting upon the windward and the leeward mooring lines, respectively.
4.1 Wave transmission coefficients
0.075 0.100 0.125 0.150 0.175 0.200 0.225 0.0
0.1 0.2 0.3 0.4 0.5 0.6 0.7 0.8 0.9 1.0
Model 1 Model 2 Model 3 Model 4
Kt
H (m)
0.8 0.9 1.0 1.1 1.2 1.3 1.4 1.5 0.0
0.1 0.2 0.3 0.4 0.5 0.6 0.7 0.8 0.9 1.0
Model 1 Model 2 Model 3 Model 4
Kt
[image:8.595.321.501.335.469.2]T (s)
Fig. 8 Transmission coefficients of the four models
(T=1 s)
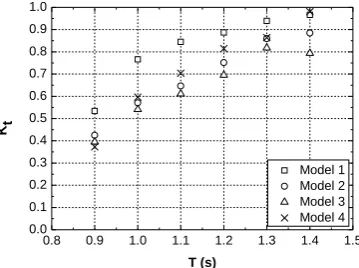
Fig. 9 Transmission coefficients of the four models
(H=0.15 m)
0.9 1.0 1.1 1.2 1.3 1.4 1.5
0.0 0.1 0.2 0.3 0.4 0.5 0.6 0.7 0.8 0.9 1.0
Model 1 Model 2 Model 3 Model 4
Kt
[image:8.595.204.385.549.695.2]T (s)
Fig. 10 Transmission coefficients of the four models (H=0.2 m)
model decreases when the wave height increases. For floating models, higher wave height means greater motion responses and a larger amount of dissipated energy. By comparisons among the four models, we found that the wave attenuation performance of Model 3 is always the best for different wave heights.
The results from Fig. 8 show that Model 3 becomes even more effective in wave attenuation than Model 1 with the increase of wave height, especially when the wave height is beyond 0.125 m (5/8 model height or the diameter of the big cylinder). When the wave height is 0.125 m, Kt of Model 3 is 26% smaller than Model 1. When the wave height is up to 0.2 m, Kt of Model 3 is 37% smaller than Model 1. These results reveal that the higher the wave height is, the more effective the mesh cage and balls will be in wave attenuation.
Fig. 9 and Fig.10 depict the variations of transmission coefficients with the wave period for the four models with the wave height being 0.15 m and 0.2 m, respectively. It is obvious that Kt of each model increases with wave period increasing.
For Model 1 and 4, when the wave period is beyond 1.3 s (the wave length is more than 2.6 m), there is almost no wave attenuation; but the wave attenuating effect of Model 3 is very obvious. Kt of Model 3 is 19% smaller than Model 4 and 16% smaller than Model 1 as T=1.4 s. Comparing Fig. 9 to Fig. 10 further, with the same wave period, the wave attenuating effect of Model 3 is better when the wave height is higher. In other words, Model 3 is the best for attenuating long and high waves.
In general, the mesh cage significantly improves the wave attenuation performance. With the mesh cage installed, the ability of the floating breakwater to disturb particle orbit is increased and the damping of wave dissipation is enhanced. Compared to Model 2, Model 3 has a modest increase in the wave attenuation performance. This is attributed to the balls. In addition, the effect of the balls is better at H= 0.2 m as reflected by Fig. 9 and Fig. 10. With greater movement of the balls, more wave energy is dissipated.
4.2 Motion responses
0.0750 0.100 0.125 0.150 0.175 0.200 0.225 10
20 30 40 50 60 70 80 90 100
Model 1 Model 2 Model 3 Model 4
S
wa
y
(
mm)
H (m)
0.0750 0.100 0.125 0.150 0.175 0.200 0.225 10
20 30 40 50 60 70 80 90 100
Model 1 Model 2 Model 3 Model 4
He
a
v
e
(
mm)
[image:9.595.321.505.514.648.2]H (m)
[image:9.595.94.278.515.650.2]0.0750 0.100 0.125 0.150 0.175 0.200 0.225 2 4 6 8 10 12 14 16 18 20 Model 1 Model 2 Model 3 Model 4 Ro ll ( ° ) H (m)
[image:10.595.90.272.100.234.2]0.8 0.9 1.0 1.1 1.2 1.3 1.4 1.5 0 10 20 30 40 50 60 70 80 90 100 Model 1 Model 2 Model 3 Model 4 S wa y ( mm) T (s)
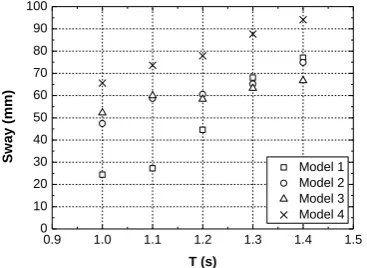
Fig. 13 Roll motion of the four models (T=1 s) Fig. 14 Sway motion of the four models (H=0.15 m)
0.8 0.9 1.0 1.1 1.2 1.3 1.4 1.5
0 10 20 30 40 50 60 70 80 90 100 Model 1 Model 2 Model 3 Model 4 He a v e ( mm) T (s)
[image:10.595.321.502.101.234.2]0.8 0.9 1.0 1.1 1.2 1.3 1.4 1.5 0 2 4 6 8 10 12 14 16 18 20 Model 1 Model 2 Model 3 Model 4 Ro ll ( ° ) T (s)
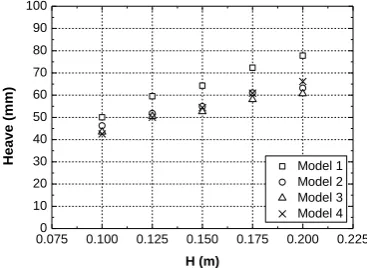
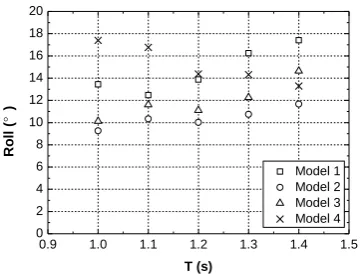
Fig. 15 Heave motion of the four models (H=0.15 m) Fig. 16 Roll motion of the four models (H=0.15 m)
0.9 1.0 1.1 1.2 1.3 1.4 1.5
0 10 20 30 40 50 60 70 80 90 100 Model 1 Model 2 Model 3 Model 4 S wa y ( mm) T (s)
0.9 1.0 1.1 1.2 1.3 1.4 1.5
0 10 20 30 40 50 60 70 80 90 100 Model 1 Model 2 Model 3 Model 4 He a v e ( mm) T (s)
[image:10.595.328.507.303.436.2] [image:10.595.88.273.304.437.2] [image:10.595.326.506.505.638.2] [image:10.595.93.277.506.640.2]0.9 1.0 1.1 1.2 1.3 1.4 1.5 0
2 4 6 8 10 12 14 16 18 20
Model 1 Model 2 Model 3 Model 4
Ro
ll
(
°
)
[image:11.595.212.393.98.235.2]T (s)
Fig. 19 Roll motion of the four models (H=0.2 m)
Figs. 11-13 show the relationship between motion responses and wave height for the four models when the wave period is 1.0 s. A tendency can be seen that the amplitudes of sway, heave and roll motions all increase with the wave height.
The results from Fig. 11 and 13 show that in different wave height conditions, the sway motion of Model 4 is more than 2.7 times as large as Model 1 and the roll motion of Model 4 is at least 18% larger than Model 1. Because the mash cage causes the new type of floating breakwater to suffer from greater wave forces, comparing to Model 1, the sway motions of Model 2 and 3 are larger. Howerver, the mesh cage also causes extra damping and roll inertia, therefore the roll motions of Model 2 and 3 are greatly decreased. In addition, the comparison between Model 2 and 3 shows slight effect of the balls on motion responses. For heave motion, all four models are similar. On the whole, the heave motion of Model 4 is slightly larger.
Figs. 14-19 reveal the changes in motion responses against the wave period for the four models as the wave height is 0.15 m and 0.2 m, respectively. The results show that the sway and heave motions of all models increase as the wave period increases.
Observing Figs. 14 and Figs. 17 carefully, we can discover that the sway motion of Model 3 increases slowly with the wave period when the period is relatively long. However, the increasing speed of the sway motion with the wave period is fast for Model 1. For example, as T=1.0 s, the sway motion of Model 3 is nearly twice as large as Model 1. But when T reached 1.4 s, the sway motion of Model 3 is close to that of Model 1. The sway motion of Model 4 is always the biggest. Fig. 14 shows that the sway motion of Model 3 is 9% smaller than Model 4 when H=0.15 m. However, the sway motion of Model 3 is 20% smaller than Model 4 as H=0.2 m.
Fig. 15 and Figs. 18 show that the heave motion of Model 3 is always distinctly smaller than that of Model 1. Moreover, the heave motion of Model 3 is close to that of Model 4 under short wave periods, but is smaller when the wave period is relatively long. For instance, the heave motion of Model 3 is 20% smaller than that of Model 4 as T= 1.4 s.
The roll motion of Model 1 is always bigger than that of Model 3. When the wave period increases, the roll motion of Model 3 increases, but for Model 4 it decreases. This led to the roll motion of Model 3 to be 50% smaller than that of Model 4 at T=1.0 s, but 10% larger than Model 4 when T increases to 1.4 s.
motion responses is slight.
4.3 Mooring forces
0.0750 0.100 0.125 0.150 0.175 0.200 0.225 15 30 45 60 75 90 105 120 135 150 Model 1 Model 2 Model 3 Model 4 Fw ( N) H (m)
0.075 0.100 0.125 0.150 0.175 0.200 0.225 10 12 14 16 18 20 22 24 26 28 30 Model 1 Model 2 Model 3 Model 4
Fl (
N)
[image:12.595.323.505.139.273.2]H (m)
Fig. 20 Forces acting on the windward mooring
[image:12.595.91.280.140.274.2]lines of the four models (T=1s)
Fig. 21 Forces acting on the leeward mooring
lines of the four models (T=1s)
0.8 0.9 1.0 1.1 1.2 1.3 1.4 1.5
0 10 20 30 40 50 60 70 80 90 100 Model 1 Model 2 Model 3 Model 4 Fw ( N) T (s)
0.8 0.9 1.0 1.1 1.2 1.3 1.4 1.5 10 12 14 16 18 20 22 24 26 28 30 Model 1 Model 2 Model 3 Model 4
Fl (
N)
[image:12.595.323.502.364.499.2]T (s)
Fig. 22 Forces acting on the windward mooring
[image:12.595.92.277.365.499.2]lines of the four models (H=0.15m)
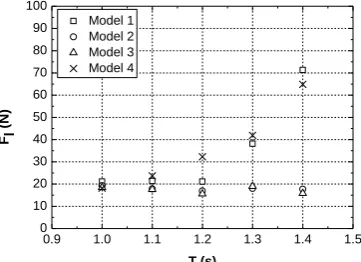
Fig. 23 Forces acting on the leeward mooring
lines of the four models (H=0.15m)
0.9 1.0 1.1 1.2 1.3 1.4 1.5
0 15 30 45 60 75 90 105 120 135 150 Model 1 Model 2 Model 3 Model 4 Fw ( N) T (s)
0.9 1.0 1.1 1.2 1.3 1.4 1.5
0 10 20 30 40 50 60 70 80 90 100 Model 1 Model 2 Model 3 Model 4
Fl (
N)
T (s)
[image:12.595.321.502.592.723.2] [image:12.595.92.275.592.724.2]lines of the four models (H=0.2m) lines of the four models (H=0.2m)
Figs. 20-21 show the variations of mooring forces with the increase of wave height for the four models when the wave period is 1.0 s. And Figs. 22-25 reveal the changes of mooring forces against the wave period for the four models as the wave height is 0.15 m and 0.2 m, respectively.
A tendency can be seen from Figs. 20-21 that Fw and Fl both increase with the wave height for all four models. This is similar to the way the motion responses change. The mooring forces of the model are different: Fw of Model 3 is at least 50% larger than that of Model 1 or Model 4. A possible reason is that Model 3 is subjected to greater wave force due to the mesh cage. Fws of Model 3 and Model 2 are nearly the same. The balls only make a small contribution to mooring forces.
For H=0.15 m and 0.2 m, the results from Figs. 22-25 show that Fws of model 2 and 3 decrease with increasing wave period. When the wave period is short, such as T=1.0 s, Fw of Model 3 is 75% larger than Model 1 and 4. However, with longer wave periods such as T=1.4 s and H=0.15 m, Fw of Model 3 is only 40% larger than Model 1 and 4. Moreover, for T=1.4 s and H=0.2 m, Fws of Model 1 and 4 exceed that of Model 2 and 3.
Fl of Model 1 increases with the wave period. In contrast, for Model 2 or 3, the variation of Fl is small.
Above all, a conclusion can be drawn that, under short wave period, Fw of Model 3 is larger than that of Model 1 and 4. When wave period increases, Fw of Model 3 decreases but Fws of Model 1 and 4 increase. It can be predicted that Fw of Model 3 will be smaller than Model 1 and 4 as wave period is long enough.
5. Conclusions
In the present study, we proposed a new type of floating breakwater. The corresponding experimental studies were carried out to validate this new model. Based on the results, the following conclusions can be drawn:
1) Compared to the box FB model, the double pontoons FB model and the new cylindrical
FB model only with the mesh cage, the new cylindrical FB model with both the mesh cage and the balls has the best performance of the wave attenuation, especially for the long and high waves. The mesh cage and the balls play significant roles in the wave attenuation.
2) The damping in heave and roll directions can be enhanced by using the mesh cage. In
this way, the heave and roll motions will be reduced, while the sway motion will increase.
3) In the new cylindrical FB model with mesh cage and balls, the use of the mesh cage may
increase the tensions on the mooring lines. If the wave period is small, the tensions on the windward mooring lines of the new cylindrical FB model with mesh cage and balls are larger than that of the box FB model and the double pontoons FB model. But for the waves with long period, the discrepancies of the tensions on the windward mooring lines of different models are very small.
of the wave energy, especially for the waves with larger amplitude. But the contribution of the balls to the motion responses and the tensions on the lines is not evident.
Through the experimental studies, we can conclude that the use of the cage and the balls can significantly improve the efficiency of the floating breakwater. However, the ways to reduce the tension on the mooring lines and the sway motion should be further investigated.
Acknowledgments
This study was supported financially by the National Natural Science Foundation of China (Grant no. 51379095) and the National Basic Research Program of China (973 Program; Grant no. 2013CB3610 0)
Reference
Dong, G..H., Zheng, Y.N., Li, Y.C., Teng, B., et.al., 2008. Experiments on Wave Transmission
Coefficients of Floating Breakwaters. Ocean Engineering 35, 931–938.
Gesraha, M.R., 2006. Analysis of Π Shaped Floating Breakwater in Oblique Waves. Applied Ocean Research 28 (5), 327-338.
Goda, Y., Suzuki, Y., 1976. Estimation of incident and reflected waves in random wave experiments. Proceedings of the 15th International Conference on Coastal Engineering. ASCE, 828–845.
He F., Huang, Z.H., Adrian, W.-K.L., 2012. Hydrodynamic Performance of a Rectangular Floating Breakwater with and without Pneumatic Chambers: An Experimental Study. Ocean Engineering 51,
16-27.
He F., Huang, Z.H., Adrian, W.-K.L., 2013. An experimental study of a floating breakwater with asymmetric pneumatic chambers for wave energy extraction. Applied Energy 106, 222-231.
Koraim, A.S., 2013. Hydrodynamic Efficiency of Suspended Horizontal Rows of Half Pipes Used as a New Type Breakwater. Ocean Engineering 64, 1–22.
Koraima, A. S., Rageh, O. S., 2013. Effect of Under Connected Plates on the Hydrodynamic Efficiency of the Floating Breakwater. China Ocean Engineering 28 (3), 349-362.
Karmakar, D., Bhattacharjee, J., Soares, C.G., 2012. Scattering of Gravity Waves by Multiple
Surface-piercing Floating Membrane. Applied Ocean Research 39, 40-52.
Liang, N.K., Huang, J.S., Li, C.F., 2004. A study of spar buoy floating breakwater. Ocean Engineering 31,
43-60.
Mani, J.S., 1991. Design of Y-Frame Floating Breakwater. Journal of Waterway, Port, Coastal and Ocean Engineering 117(2), 105-118.
Rahman, M.A., Mizutani,N., Kawasaki,K., 2006. Numerical modeling of dynamic responses and mooring forces of submerged floating breakwater. Coastal Engineering 53 (10), 799–815.
Sannasiraj, S.A., Sundar V., Sundaravadivelu R., 1998. Mooring forces and motion responses of pontoon-type floating breakwaters. Ocean Engineering 25 (1), 27-48.
Williams, A.N., Abul-Azm, A.G., 1997. Dual pontoon floating breakwater. Ocean Engineering 24 (5),
465-478.
Wei P, Lee K.H., Shin S.H., Norimi M., 2013. Numerical simulation of interactions between water waves
and inclined-moored submerged floating breakwaters. Coastal Engineering 82, 76–87.
Corresponding Author:
Dr. Cui Jie
School of Naval Architecture and Ocean Engineering
Jiangsu University of Science and Technology
Zhenjiang 212003, Jiangsu, China
Tel: +86-511-84414922
Mobile: +8615050856887
Fax: +86-511-84404433