Int. J. Electrochem. Sci., 14 (2019) 3916 – 3931, doi: 10.20964/2019.04.64
International Journal of
ELECTROCHEMICAL
SCIENCE
www.electrochemsci.org
Simultaneous Determination of Catechol and Hydroquinone
using N, P co-doped Carbon Derived from Ionic Liquid
Yan Ma1,2, Zhanping Cao1,2,*, Ye Wang1,2, Yingli Xia1,2, Chongchong He1,2, Leilei Wang1,2, Saisai Bao1,2, Pingmei Yin1,2, Lili Wang1,2, Jian Gao1,2, Hong Wang1,3,
Zhen Yin1,2,*
1 State Key Laboratory of Separation Membranes and Membrane Process, Tianjin Polytechnic University, Tianjin 300387, China
2 School of Environmental and Chemical Engineering, Tianjin Polytechnic University, Tianjin 300387, China
3 School of Material Science and Engineering, Tianjin Polytechnic University, Tianjin 300387, China *E-mail: [email protected]; [email protected]
Received: 19 November 2018 / Accepted: 27 February 2019 / Published: 10 March 2019
The N, P co-doped carbon (N-P-C) was prepared with the ionic liquid (IL) of hydrated pyridium dihydrate phosphate ([Hpdy]DHP). As precursors via one-pot pyrolysis. The N-P-C was used to modify the glassy carbon electrode (GCE) for simultaneous determination of hydroquinone (HQ) and catechol (CC). The obtained N-P-C was characterized by scanning electron microscopy (SEM), transmission electron microscopy (TEM), X-ray photoelectron spectroscopy (XPS), Raman spectroscopy and electrochemical techniques. Cyclic voltammetry (CV) and differential pulse voltammetry (DPV) techniques were employed to investigate the catalytic performance of simultaneous determination of HQ and CC. The N-P-C/GCE exhibits wide linear responses (from 5 to 400 μM), low detection limit (0.98 μM for HQ and 0.61 μM for CC, ratio of signal-to-noise 3) and superior sensitivity of 1.1 AM-1 cm-2 for HQ and 1.4 AM-1 cm-2 for CC in the simultaneous detection of HQ and CC, demonstrating superior detection performance even compared with the state-of-art carbon materials, such as N-doped graphene, graphene oxide or carbon nanotubes. Moreover, it displayed the favorable reproducibility and good long-term stability.
Keywords:Ionic liquids, N, P co-doped carbon, Hydroquinone, Catechol, Simultaneous determination
1. INTRODUCTION
their strong toxicity and weak degradability [3-5]. The HQ and CC can result in human disease even with extremely low concentration. For example, HQ can cause headache or kidney damage while CC can decrease liver function [6, 7]. Furthermore, HQ and CC usually coexist in products owing to their very similar structures and properties, leading to a challenging work for their identification [8]. Up to now, various analytical techniques have been adopted to detect HQ and CC, including spectrophotometry and liquid chromatography [9, 10]. However, most of these methods have obvious drawbacks, such as complex preparation, long test time, high cost and/orlow sensitivity [11].
In recent years, the electrochemical methods provide a facile and rapid way for environmental analysis owing to its high sensitivity, fast response and low cost [12]. Therefore, the electrochemical methods have been considered as one promising method for simultaneous detection of the phenolic compounds basing on the anodic oxidation [13]. However, HQ and CC can exhibit similar oxidation peaks or an overlapped response on the bare working electrodes because of their isomorphic nature, leading to great difficulty of simultaneous detection [14]. It’s still one great challenge to obtain superior working electrodes possessing available electrocatalysts via a facile procedure, although extensive efforts have been devoted to modifying the working electrodes with various materials, such as Au [15, 16], polyaniline/MnO2 nanofibers [17].
During the past decades, the carbon-based materials as metal-free electrocatalysts have attracted intensive attention due to their potential application in fuel cells, water splitting, catalysis and gas storage [18-21]. Although the booming development of nanocarbons have been reported, such as nanotubes and graphene [22-25], it still must face tremendous obstacles in large scale application. As we all know, the pristine carbon is inert for the electrochemical reaction or detection. To enhance the electrocatalytic activity of carbon materials, the non-metal elements doping, such as N, S or P, has been considered as one efficient method. The doping method can modulate the electronic state density of carbon and exhibit much more active sites [26, 27]. In our previous works, one facile method was developed to prepare carbon-based catalysts with the ionic liquid (IL) as precursor, which displayed superior catalytic activity towards oxygen reduction reaction [21, 28, 29]. Actually, the structure of IL can allow for a volatile combination of anions and cations, leading to easiness to adjust the composition and amount of heteroatom in the resulting carbon material [30]. Moreover, the preparation process of doped carbon with IL is facile and easy to scale up compared with other synthetic methods.
In the present work, one simple method to prepare the N, P co-doped carbon (N-P-C) with IL to modify glassy carbon electrode (GCE) was described. The N-P-C demonstrated excellent performance for the simultaneous detection of HQ and CC. The results confirmed that the N-P-C was sensitive and selective for simultaneous determination of HQ and CC because of the doping effect of N and P elements. As far as we know, it’s the first time to report the N, P co-doped carbon derived from the IL as the electrocatalyst to detect simultaneously HQ and CC.
2. EXPERIMENTAL SECTION
2.1. Materials and reagents
Tianjin Sailboat Chemical Reagent Technology Co., Ltd. Nafion (5 wt%), carbon black, i.e. Vulcan XC-72 (Carbot), HQ and CC were ordered from the Alfa Aesar. Phosphate buffer solution (0.1 M PBS, pH = 7) was obtained through mixing NaH2PO4 (0.1 M) and Na2HPO4 (0.1 M). The ultrapure water was used to prepare the solutions.
2.2. Apparatus
Scanning electron microscope (SEM) was performed on a Gemini SEM 500. Transmission electron microscope (TEM) was conducted on a Hitachi H7650. The structure of IL was investigated by the 1H NMR spectra (Bruker Avance-III 400 spectrometer) and Fourier transform infrared spectroscopy (FT-IR, Nicolet 6700, Thermo Fisher). The Raman spectra and X-ray photoelectron spectra of sample were collected on the XploRA PLUS and Thermo Fisher, respectively. All electrochemical experiments were performed on a CHI 760E electrochemical workstation (CH Instruments, Chenhua Co., Shanghai, China). The three-electrode system was used. A platinum electrode was used as an auxiliary electrode. The Ag/AgCl (saturated KCl) electrode was used as a reference electrode. The N-P-C dispersed on a GCE was used as the working electrode. The PBS solution (0.1 M) was used as the supporting electrolyte. Differential pulse voltammetry (DPV) electrochemical parameters: pulse amplitude 50 mV, pulse width 50 ms, incremental potential 4 mV, pulse period 0.5 s.
2.3. Preparation of N, P co-doped carbon
The synthesis process of N-P-C was shown in Scheme 1.
N
H3PO4
3h stirring 800℃
Pyrolysis
+ 50℃ [Hpdy]DHP N-P-C
Scheme 1. Synthesis route of N, P co-doped carbon.
[image:4.596.210.402.71.229.2]
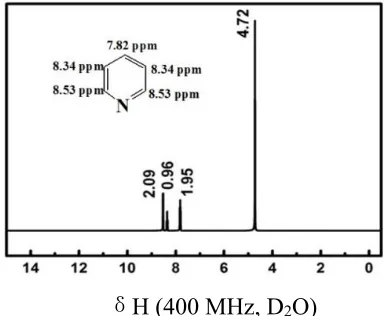
δH (400 MHz, D2O)
Figure 1. 1H NMR for hydrolyzed pyridine dihydrogen phosphate ([Hpdy]DHP).
Figure 2. Photograph of ILs (left) and N-P-C powder (right).
For comparison, two counter samples doped with only P (P-C) and N (N-C) were prepared under conditions similar with that for N-P-C. For P-C, phosphoric acid was slowly added dropwise to carbon black Vulcan XC-72. After stirring for 3 hours, the mixture was calcined at 800 °C for 1 h. The N-doped carbon wasprepared withsimilar process using the pyridine as N precursor. The mixture of N-P-C and carbon black (termed as MC) was also prepared for comparation by mixing the N-P-C and XC-72 (N-P-C/C) in a mass ratio of 1:1. The N-doped graphene (N-G) was also prepared as the control sample via the reported procedure [31, 32].
2.4. Electrode preparation
[image:4.596.205.394.279.423.2]
3. RESULTS AND DISCUSSION
3.1. Characterization of catalyst
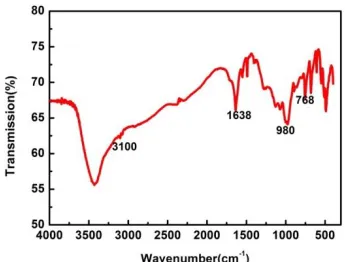
[image:5.596.212.385.260.391.2]The structure of [Hpyd]DHP was determined and confirmed by the 1H NMR spectra and FT-IR tests. The results are presented in Figure 1 and Figure 3. The bands at 3100 cm-1 and 1638 cm-1 can be assigned to the stretching vibration of unsaturated C-H bonds in the pyridine ring and deformation vibration of pyridine ring, respectively. The peak at 768 cm-1 should be due to the out-of-plane bending vibration of C-H bonds in the pyridine ring [33]. Moreover, a band at 980 cm-1 was present due to the stretching vibration of P-O bonds [34].The morphology of the N-P-C was investigated observed by SEM and TEM, as shown in Figure 4.
Figure 3. FT-IR spectra of [Hpdy]DHP.
Figure 4. SEM (A, B) and TEM (C) images of N-P-C.
The carbon particles consists of vast carbon microspheres. Furthermore, it indicates that some carbon particles possess thin layer structure, which may be caused by the exfoliation of graphite during the pyrolysis process.
[image:5.596.93.504.439.550.2]
of IL. During the pyrolysis process, the gradual dehydration and condensation of phosphoric acid into polyphosphates would occur [37].
Figure 5. XPS survey spectra (A) and high resolution XPS spectra of N 1s (B) and P 2p (C) and Raman spectra (D) of N-P-C.
Meanwhile, the P atoms would interact with enlarged aromatic carbon ring system and incorporate into the carbon matrix. The N-P-C consisted of C (42.7 at.%), O (44.8 at.%), P (9.7 at.%) and N (2.8 at.%) based on the full survey of XPS spectra. One point must be noticed that part of P may be resulted from the formation of phosphide or adsorption of P oxides on the surface of carbon, resulting in the very high P content on the carbon surface. The high resolution spectra of N 1s peak and P 2p peak were analyzed to investigate the chemical state of N and P atoms. As shown in Figure 5B, the N 1s peak can be further fitted into three different peaks at about 398.5, 401.1 and 404.1 eV, corresponding to pyridinic-N, graphitic-N and N-oxide, respectively, confirming that N atoms have been incorporated into the carbon.
The P 2p peak can be deconvoluted into three peaks at the binding energy of 131.8, 133.7 and 134.9 eV, respectively. The peak of P 2p at about 131.8 eV can be assigned to the P-C bonding, confirming the successful incorporation of P atoms into the carbon structure [35]. The peak of P 2p located at 133.7 eV can be ascribed to the P-N coordination, indicating the formation of P-N bonds [38]. In addition, the peak at around 134.9 eV belongs to the P-O bonding, implying the formation or adsorption of P-oxide on the carbon surface. As shown in Figure 5D, one Raman peak located at 1345 cm−1 can be assigned to D band, another located at 1588 cm−1 belongs to G band [39]. The intensity ratio of the D to G band (ID/IG) implies the degree of disorder or defects in carbon [40]. The ID/IG value was
[image:6.596.152.437.123.344.2]
3.2. Electrochemical behavior of HQ and CC
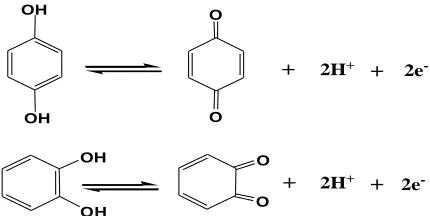
The cyclic voltammetry (CV) technique was employed to investigate the electrochemical behaviors of HQ and CC on the bare GCE and N-P-C/GCE in PBS solution (0.1 M, pH = 7) with a potential range from -0.3 to 0.6 V (vs. Ag/AgCl). As shown in Figure 6A, in the PBS, no obvious peak was found on the GCE. However, a higher background current was obtained at N-P-C/GCE, indicating a larger effective surface area of N-P-C. The CV curves obtained over the GCE and the N-P-C/GCE with 150 μM HQ (B) and 150 μM CC (C) were presented, respectively. The possible oxidation reactions of HQ and CC can be described in Scheme 2.
Scheme 2. The expected mechanism of HQ and CC at N-P-C/GCE.
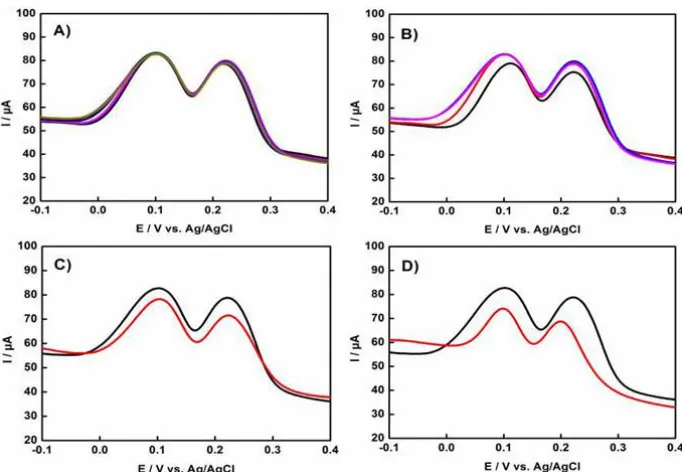
Figure 6. CV curves in 0.1 M PBS (pH = 7) at the GCE and N-P-C/GCE: (A) blank solution; (B) with 150 μM HQ; (C) with 150 μM CC; (D) with 150 μM HQ + 150 μM CC.
In the presence of HQ (Figure 6B), a pair of much obvious redox peaks can be recorded for HQ (curve b in Figure 6B) and CC (curve b in Figure 6C) over N-P-C/GCE compared with that of the bare GCE (curve a in Figure 6B-C), indicating higher N-P-C electro-oxidation activity and selectivity for the electro-oxidation of HQ and CC [42].
Over the bare GCE (curve a in Figure 6B-C), the potentials of oxidation and reduction peak of HQ and CC located at around 0.36/-0.09 V and 0.42/0.04 V, respectively. Thereby, the separation of peak potential (ΔEp) for HQ and CC on the GCE were 450 and 380 mV, respectively. In contrast, on the N-P-C/GCE (curve b in Figure 6B-C), the anodic and cathodic peak potential for HQ and CC appeared at ca.
O
O
2H+ 2e
-2H+ 2e
-OH
OH
O
O OH
[image:7.596.191.406.235.344.2]
0.12/0.07 V (ΔEp= 50 mV) and 0.23/0.18 V (ΔEp= 50 mV), respectively. The sharply decreased ΔEp of only ca. 50 and 50 mV for HQ and CC over the N-P-C/GCE demonstrated the high electro-oxidation activity and quick electron transfer between electrode and HQ (or CC) owing to the introduction of N-P-C. Moreover, the smaller ΔEp indicates that the overpotential of HQ and CC on N-P-C/GCE had dramatically decreased, implying that the electrochemical reversibility of HQ and CC oxidation on N-P-C/GCE is greatly improved. Hence, compared with the GCE, the N-P-C can facilitate the electron transfer between the electrode and organics and exhibit superior electrocatalytic performance towards the HQ and CC oxidation, leading to decrease the oxidation overpotential of CC and HQ and improve electrochemical reversibility of electro-oxidation [43].
The electrochemical responses of simultaneous detection of the mixture of 150 μM CC and 150 μM HQ over the bare GCE and N-P-C/GCE is shown in Figure 6D. Two weak electro-oxidation peaks are recorded due to the peaks overlap of HQ and CC oxidation, confirming that it is very hard to separate HQ and CC from each other over the bare GCE through the CV method. By contrast, two obvious independent peaks of CC (at about 0.23 V) and HQ (at about 0.13 V) oxidation with higher currents can be found over the N-P-C/GCE. Furthermore, the gap between the two different oxidation peaks (ca. 100 mV) was large enough to differentiate the two isomers. These results demonstrated that the N-P-C modified GCE can be employed to simultaneously detect CC and HQ because the superior catalytic activity. The catalytic activity results from high electrochemical active areas and abundant active sites or defects of the carbon resulting from the doping effects of N and P heteroatoms. In addition, excellent ability of electron transfer of the N-P-C is also favorite for the enhancement of electrochemical responses of CC and HQ.
3.3. Effect of pH and scan rate
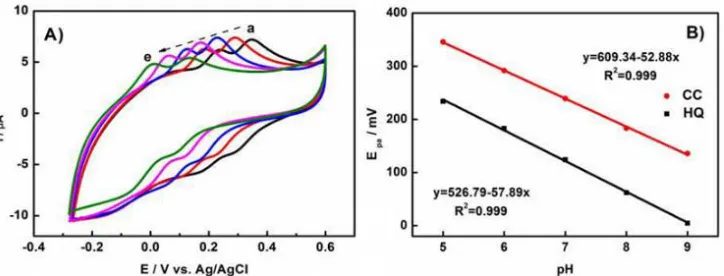
Figure 7. (A) CVs of 150 μM HQ and 150 μM CC in PBS solution at N-P-C/GCE with different pH values: (a) pH = 5, (b) pH = 6, (c) pH = 7, (d) pH = 8, (e) pH = 9, scan rate is 10 mV/s and (B) Relationship of pH versus Epa of HQ and CC.
[image:8.596.120.482.483.621.2]
9.0, indicating the ΔEp between HQ and CC kept constant in solution with different pH value and the protons were involved directly in the electrochemical reaction [44]. For HQ and CC, the relationship of peak potentials and the pH value of electrolyte can be fitted to: Epa = 526.79-57.89 pH (mV, R2 = 0.999) and Epa = 609.34-52.88 pH (mV, R2 = 0.999), suggesting the linear relationship between Epa of HQ and CC and the pH value of electrolyte solution. The equation slopes for the HQ and CC were 57.89 and 52.88 mV/pH, respectively, close to the theoretical value of 60 mV/pH, implying that the electro-oxidation of HQ and CC are involved in equal numbers of electrons and protons [44]. The electron transfer number (n) of HQ (CC) is calculated to be 2 based on the relationship between Ep and pH, demonstrating that two electrons participate in the electrochemical oxidation and reduction processes of HQ (CC). Hence, the electrochemical reaction of HQ (CC) on the N-P-C/GCE electrode would be one process of two electrons and two protons [45]. Additionally, the oxidation peak currents raised with pH increase from 5.0 to 7.0, and reach the maximum value at pH 7.0. When the pH was higher than 7.0, the peak current declined. Therefore, pH 7.0 was selected in the subsequent electrochemical experiments in order to obtain better determination sensitivity.
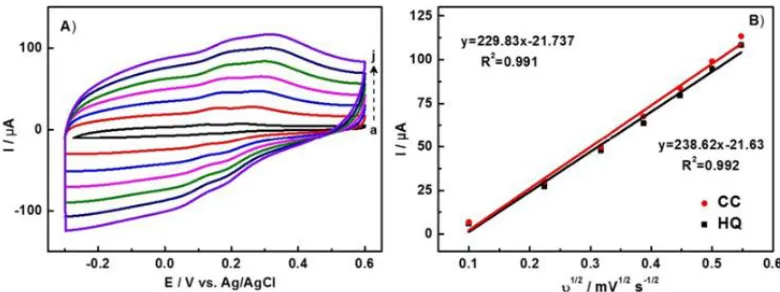
Figure 8. (A) CVs of 150 μM HQ and 150 μM CC in PBS solution at N-P-C/GCE with different scant rates (a→j: 10, 50, 100, 150, 200, 250, 300 mV/s); (B) Linear fit of the peak currents of HQ and CC versus the square root of the scan rates.
Meanwhile, the effect of scan rate on the oxidation of two isomers over N-P-C/GCE was also investigated by CV method (Figure 8A). The anodic peak currents raised with increase of scan rate. The square of scan rate is linear to the anodic peak current (Ipa) in the range of 10 to 300 mV s-1. The linear equations can be expressed as: Ipa (μA) = 229.83ν1/2-21.737 (ν in mV s-1) for HQ and Ipa (μA) = 238.62ν1/2-21.63 (ν in mV s-1) for CC. The correlation coefficient R2 was 0.991 and 0.992, respectively. Apparently, the electrochemical redox processes of HQ and CC with N-P-C/GCE can be controlled by the diffusion process [44, 46, 47].
3.4. Simultaneous detection of HQ and CC
[image:9.596.101.491.331.477.2]
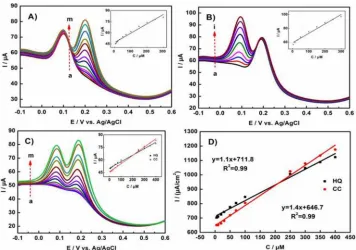
concentration of another species. As shown in the Figure 9A, the CC oxidation peak currents increased linearly when the concentration of CC raised from 5 to 300 μM with the constant HQ concentration (150 μM), demonstrating the oxidation peak current is proportional to the CC concentration. The linear relationship can be fitted into: Ipa = 0.1259x + 46.9, (μA, μM, R2 = 0.98). Hence, the linear range of CC was 5-300 μM (R2 = 0.98). The DPVs with the different concentrations of HQ and 150 μM CC were shown in Figure 9B, confirming that the oxidation current was proportional to the concentration of HQ. The relationship can be expressed as: Ipa = 0.1363x + 59.018, (μA, μM, R2 = 0.98). Therefore, the linear range of HQ was 5-300 μM (R2 = 0.98). The simultaneous detection of HQ and CC mixture with various concentrations (5-400 μM) were shown in the Figure 9C. Two obvious and separated peaks assigned to the oxidation of HQ (at 0.08 mV) and CC (at 0.19 mV) can be observed.
Figure 9. DPVs of N-P-C/GCE: (A) in the presence of 150 μM HQ with different concentrations of CC (a→m: 5, 10, 15, 20, 30, 50, 70, 100, 120, 150, 200, 250, 300 μM); (B) in the presence of 150 μM CC with different concentrations of HQ (a→i: 5, 15, 30, 50, 100, 150, 200, 250, 300 μM); (C) the simultaneous detection of HQ and CC with different concentrations of HQ and CC (a→m: 5, 7.5, 10, 15, 20, 30, 50, 70, 100, 250, 300, 350, 400 μM; equal concentrations of HQ and CC); Insert: calibration plots of CC, HQ and CC + HQ; 0.1 M PBS (pH = 7.0). (D) Relationship between the amperometric responses and the concentrations of HQ and CC, respectively.
[image:10.596.121.477.255.505.2][image:11.596.128.466.70.320.2]
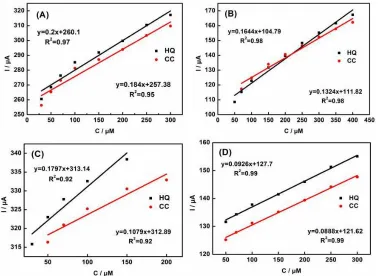
Figure 10. DPVs in the presence with equal concentrations of HQ and CC over the (A) P-C, concentration from down to up: 30, 50, 70, 100, 250, 300 μM; (B) N-C, concentration from down to up: 50, 70, 100, 150, 200, 250, 300, 350, 400 μM; (C) MC, concentration from down to up: 30, 50, 70, 100, 150, 200 μM; and (D) N-G, concentration from down to up: 50, 70, 100, 150, 200, 250, 300 μM.
Figure 11. Linear relationship between the amperometric responses and the concentrations of HQ and CC from the DPV curves in the Figure 10: (A) P-C; (B) N-C; (C) MC; (D) N-G.
[image:11.596.111.490.403.679.2]
were shown in the Figure 10 and Figure 11. Compared with the N-C, P-C and MC, the N-P-C/GCE displayed a wider linear range, confirming the superior simultaneous detection ability of N-P-C derived from the IL (Table 1). More importantly, it should be noticed that the N-P-C modified GCE exhibits remarkable electrocatalytic performance for HQ and CC sensing in terms of the linear range and LOD, compared to those previously reported carbon-based materials, as listed in Table 2.
Table 1. Performance comparison of other control samples for CC and HQ detection. Details of preparation of these samples can be found in the part of 2.3-2.4.
Catalysts on the GCE Linear range (μM)
HQ CC
P-C 30-300 30-300
N-C 50-400 70-400
MC 30-150 50-200
N-G 50-300 50-300
N-P-C 5-400 5-400
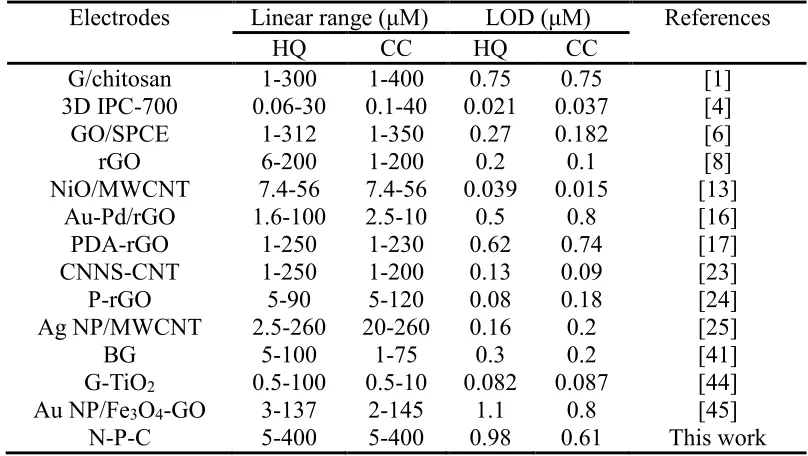
Table 2. Performance comparison of N-P-C/GCE for CC and HQ detection with other electrodes.
Electrodes Linear range (μM) LOD (μM) References
HQ CC HQ CC
G/chitosan 1-300 1-400 0.75 0.75 [1]
3D IPC-700 0.06-30 0.1-40 0.021 0.037 [4]
GO/SPCE 1-312 1-350 0.27 0.182 [6]
rGO 6-200 1-200 0.2 0.1 [8]
NiO/MWCNT 7.4-56 7.4-56 0.039 0.015 [13]
Au-Pd/rGO 1.6-100 2.5-10 0.5 0.8 [16]
PDA-rGO 1-250 1-230 0.62 0.74 [17]
CNNS-CNT 1-250 1-200 0.13 0.09 [23]
P-rGO 5-90 5-120 0.08 0.18 [24]
Ag NP/MWCNT 2.5-260 20-260 0.16 0.2 [25]
BG 5-100 1-75 0.3 0.2 [41]
G-TiO2 0.5-100 0.5-10 0.082 0.087 [44]
Au NP/Fe3O4-GO 3-137 2-145 1.1 0.8 [45]
N-P-C 5-400 5-400 0.98 0.61 This work
Note: G: graphene.
IPC: interconnected porous carbon. CNNS: carbon nitride nanosheets. BG: boron-doped graphene.
[image:12.596.95.499.378.606.2]
of HQ and CC on the N-G were not obvious, even with high concentrations. In addition, as listed in the Table 1, the linear range of N-G was rather narrow (50-300 μM for the HQ and CC). Hence, it is reasonable to believe that the N-P-C would be a promising candidate towards the simultaneous detection of dihydroxybenzene isomers, even compared with other reported carbon-based or metal-based materials.
3.5. Repeatability and stability of N-P-C/GCE
Figure 12. DPVs of N-P-C/GCE in the presence of 150 μM HQ and 150 μM CC: (A) comparison of 10 measurements over the same electrode; (B) four different electrodes fabricated independently under the same conditions; (C) comparison of initial results and results after three weeks; (D) addition of the interfering substances (with 150 mM resorcinol, phenol and p-nitrophenol).
Ten consecutive amperometric measurements of N-P-C/GCE in 150 μM CC and 150 μM HQ provided reproducible responses with a relative standard deviation (RSD) of 2.9% and 5.2%, respectively (Figure 12A). Moreover, four newly N-P-C/GCE fabricated independently with the same conditions were used to detect HQ and CC, and an RSD value of 2.3% for HQ and 2.7% for CC, respectively (Figure 12B). These results confirmed that the fabricated N-P-C/GCE exhibited superior reproducibility for simultaneous determination of HQ and CC.
In addition to sensitivity, selectivity and repeatability, the stability was also one important parameter to assess the suitability of electrochemical detector. As shown in the Figure 12C, even after three weeks, the electrochemical current of HQ oxidation was approximately 95% of the initial value, and the CC current response remained about 91% of the original value, indicating good stability. Hence, the N-P-C/GCE would be one promising electrode to determine CC and HQ in possession of superior reproducibility and great long-term stability.
[image:13.596.128.469.208.444.2]
NH4+, Cl-, SO42-, NO3-, ascorbic acid and uric acid. It was found that the N-P-C/GCE only provides obvious responses for HQ and CC electro-oxidation, revealing that the introduction of other species didn’t show an evident influence on the potential and current of anodic peak. In addition, other possible interfere of other organics, such as resorcinol, phenol and p-nitrophenol were also investigated, which may interfere the simultaneous detection of HQ and CC. The results showed that no other oxidation peaks appeared after adding 100 times the above substances. The oxidation current reduce caused by the interfering substances was only 10% (Figure 12D), which indicating that our N-P-C/GCE displayed excellent anti-interference ability.
4. CONCLUSION
In the present work, we developed a facile procedure to obtain N, P co-doped carbon derived from the IL, which can be used for the modification of GCE (N-P-C/GCE) to simultaneous determination of HQ and CC. In the CV tests, the N-P-C/GCE can exhibit two clear voltammetric peaks of independent oxidation peaks for CC and HQ. The peak potential separation over the N-P-C/GCE is about 100 mV, enough for simultaneous detection. Compared with the bare GCE, doped commercial carbon and other reported carbon-based materials, it can demonstrate the wider linear range, superior sensitivity and lower LOD of simultaneous detection of HQ and CC over the N-P-C/GCE via the DPV tests, resulting from the superior catalytic activity due to the N, P co-doping effect and excellent ability of electron transfer of N-P-C. The proposed N-P-C can simultaneously detect HQ and CC selectively and reliably, which would be a significantly promising electrode material for practical HQ and CC monitoring in environmental analysis and protection. Meanwhile, our present method would provide a facile way to prepare metal-free carbon-based electrocatalysts with superior catalytic performance.
ACKNOWLEDGEMENTS
The authors gratefully acknowledge the financial support of National Natural Science Foundation of China (No. 21872104, 21776219 and 21676200), the Program for Innovative Research Team in University of Ministry of Education of China (Grant No. IRT-17R80), College Students' Innovation and Entrepreneurship Project (No. 201710058048).
References
1. H. Yin, Q. Zhang, Y. Zhou, Q. Ma, T. liu, L. Zhu, S. Ai, Electrochim. Acta, 56 (2011) 2748-2753. 2. Y. Xiang, H. Liu, J. Yang, Z. Shi, Y. Tan, J. Jin, R. Wang, S. Zhang, J. Wang, Electrochim. Acta,
261 (2018) 464-473.
3. Z. Li, Y. Yue, Y. Hao, S. Feng, X. Zhou, Microchim. Acta, 185 (2018) 215.
4. Y. Xiang, L. li, H. liu, Z. Shi, Y. Tan, C. Wu, Y. Liu, J. Wang, S. Zhang, Sens. Actuators B, 267 (2018) 302-311.
5. J. Li, J. Xia, F. Zhang, Z. Wang, Q. Liu, Talanta, 181 (2018) 80-86.
7. M. Deng, S. Lin, X. Bo, L. Guo, Talanta, 174 (2017) 527-538.
8. L. Chen, Y. Tang, K. Wang, C. Liu, S. Luo, Electrochem. Commun., 13 (2011) 133-137. 9. Y. Shen, D. Rao, Q. Sheng, J. Zheng, Microchim. Acta, 184 (2017) 3591-3601.
10.V. Nagaraja, M.K. Kumar, N. Giddappa, Spectrochim Acta A., 173 (2017) 407-417.
11.H. Zhou, T. Huang, D. Chen, S. Li, H. Yu, Y. Li, Q. Song, Sens. Actuators B, 249 (2017) 405-413. 12.M. Asnaashari, R.E. Kenari, R. Farahmandfar, K. Abnous, S.M. Taghdisi, Food Chem., 271 (2019)
54-61.
13.L.A. Goulart, L.H. Mascaro, Electrochim. Acta, 196 (2016) 48-55.
14.A. Ayala, M. Stoytcheva, R. Zlatev, Z. Velkova, V. Gochev, B. Valdez, G. Montero, Electroanalysis, 30 (2018) 1913-1917.
15.R.N. Goyal, V.K. Gupta, N. Bachheti, R.A. Sharma, Electroanalysis, 20 (2008) 757-764.
16.Y. Chen, X. Liu, S. Zhang, L. Yang, M. Liu, Y. Zhang, S. Yao, Electrochim. Acta, 231 (2017) 677-685.
17.L. Zheng, L. Xiong, Y. Li, J. Xu, X. Kang, Z. Zou, S. Yang, J. Xia, Sens. Actuators B, 177 (2013) 344-349.
18.X. Liu, L.M. Dai, Nat. Rev. Mater., 1 (2016) 16064.
19.D.S. Su, S. Perathoner, G. Centi, Chem. Rev., 113 (2013) 5782-5816.
20.J. Gao, N. Ma, J.J. Tian, C. Shen, L.L. Wang, P.F. Yu, Y.Y. Chu, W. Liu, X.Y. Tan, X.F. Li, Z. Yin, J. Solid State Electrochem., 22 (2018) 519-525.
21.J. Gao, C. He, J. Liu, P. Ren, H. Lu, J. Feng, Z. Zou, Z. Yin, X. Wen, X. Tan, Catal. Sci. Technol., 8 (2018) 1142-1150.
22.D. Han, T. Han, C. Shan, A. Ivaska, L. Niu, Electroanalysis, 22 (2010) 2001-2008.
23.H. Zhang, Y. Huang, S. Hu, Q. Huang, C. Wei, W. Zhang, W. Yang, P. Dong, A. Hao, Electrochim. Acta, 176 (2015) 28-35.
24.H. Zhang, X. Bo, L. Guo, Sens. Actuators B, 220 (2015) 919-926.
25.L.A. Goulart, R. Goncalves, A.A. Correa, E.C. Pereira, L.H. Mascaro, Microchim. Acta, 185 (2017) 12.
26.H. Rao, X. Liu, F. Ding, Y. Wan, X. Zhao, R. Liang, P. Zou, Y. Wang, X. Wang, Q. Zhao, Chem. Eng. J., 338 (2018) 478-487.
27.K.E. Toghill, R.G. Compton, Electroanalysis, 22 (2010) 1947-1956.
28.J. Gao, N. Ma, J. Zhai, T. Li, W. Qin, T. Zhang, Z. Yin, Ind. Eng. Chem. Res., 54 (2015) 7984-7989.
29.J. Gao, N. Ma, Y. Zheng, J. Zhang, J. Gui, C. Guo, H. An, X. Tan, Z. Yin, D. Ma, ChemCatChem., 9 (2017) 1601-1609.
30.B.-K. Kim, E.J. Lee, Y. Kang, J.-J. Lee, J. Ind. Eng. Chem., 61 (2018) 388-397. 31.Z. Lin, G. Waller, Y. Liu, M. Liu, C.-P. Wong, Adv. Energy Mater., 2 (2012) 884-888. 32.D.R. Dreyer, S. Park, C.W. Bielawski, R.S. Ruoff, Chem. Soc. Rev., 39 (2010) 228-240. 33.A.A.M. Farag, N. Roushdy, N.M. El-Gohary, S.A. Halim, M.A. Ibrahim, Appl. Surf. Sci., 467
(2019) 1226-1238.
34.S. Darvishzad, N. Daneshvar, F. Shirini, H. Tajik, J. Mol. Struct., 1178 (2019) 420-427. 35.C. Zhang, N. Mahmood, H. Yin, F. Liu, Y. Hou, Adv. Mater., 25 (2013) 4932-4937.
36.Z.W. Liu, F. Peng, H.J. Wang, H. Yu, W.X. Zheng, J. Yang, Angew. Chem., 50 (2011) 3257-3261. 37.A.M. Puziy, O.I. Poddubnaya, R.P. Socha, J. Gurgul, M. Wisniewski, Carbon, 46 (2008)
2113-2123.
38.S. Guo, Z. Deng, M. Li, B. Jiang, C. Tian, Q. Pan, H. Fu, Angew. Chem., 55 (2016) 1830-1834. 39.D. Balram, K.-Y. Lian, N. Sebastian, Inorg. Chem. Front., 5 (2018) 1950-1961.
40.M. Zhou, Y.M. Zhai, S.J. Dong, Anal. Chem., 81 (2009) 5603-5613.
41.Y. Zhang, R. Sun, B. Luo, L. Wang, Electrochim. Acta, 156 (2015) 228-234.
43.Y. Wu, W. Lei, M. Xia, F. Wang, C. Li, C. Zhang, Q. Hao, Y. Zhang, Appl. Clay. Sci., 162 (2018) 38-45.
44.Y. Zhang, S. Xiao, J. Xie, Z. Yang, P. Pang, Y. Gao, Sens. Actuators B, 204 (2014) 102-108. 45.S. Erogul, S.Z. Bas, M. Ozmen, S. Yildiz, Electrochim. Acta, 186 (2015) 302-313.
46.X. Niu, M. Lan, H. Zhao, C. Chen, Anal. Chem., 85 (2013) 3561-3569.
47.Z. Yin, H.J. Zheng, D. Ma, X.H. Bao, J. Phys. Chem. C, 113 (2009) 1001-1005.