City, University of London Institutional Repository
Citation
:
Andrienko, N., Lammarsch, T., Andrienko, G., Fuchs, G., Keim, D., Miksch, S.
and Rind, A. (2018). Viewing Visual Analytics as Model Building. Computer Graphics Forum,
doi: 10.1111/cgf.13324
This is the accepted version of the paper.
This version of the publication may differ from the final published
version.
Permanent repository link:
http://openaccess.city.ac.uk/19078/
Link to published version
:
http://dx.doi.org/10.1111/cgf.13324
Copyright and reuse:
City Research Online aims to make research
outputs of City, University of London available to a wider audience.
Copyright and Moral Rights remain with the author(s) and/or copyright
holders. URLs from City Research Online may be freely distributed and
linked to.
Viewing Visual Analytics as Model Building
N. Andrienko1,2, T. Lammarsch3, G. Andrienko1,2, G. Fuchs1, D. Keim4, S. Miksch5, and A. Rind6
1Fraunhofer Institute IAIS, Germany 2City University London, UK 3Independent Researcher, Austria 4University of Konstanz, Germany 5Vienna University of Technology, Austria 6St. Poelten University of Applied Sciences, Austria
Abstract
To complement the currently existing definitions and conceptual frameworks of visual analytics, which focus mainly on activities performed by analysts and types of techniques they use, we attempt to define the expected results of these activities. We argue that the main goal of doing visual analytics is to build a mental and/or formal model of a certain piece of reality reflected in data. The purpose of the model may be to understand, to forecast, or to control this piece of reality. Based on this model building perspective, we propose a detailed conceptual framework in which the visual analytics process is considered as a goal-oriented workflow producing a model as a result. We demonstrate how this framework can be used for performing an analytical survey of the visual analytics research field and identifying the directions and areas where further research is needed.
Categories and Subject Descriptors(according to ACM CCS): [Human-centered computing→Visual analytics]: Visualization application domains—Visual analytics
1. Introduction
The definition of visual analytics as “the science of ana-lytical reasoning facilitated by interactive visual interfaces” [TC05, p. 4] emphasizes a certain kind of activity (analyt-ical reasoning) and a certain technology (interactive visual interfaces) supporting this activity. The goal of the visual analytics activity is to gain information, insights, and assess-ments from complex data. Keim et al. [KAF∗08,KKEM10] proposed a graphical representation of visual analytics as an iterative process in which knowledge is derived from data by combining visual data exploration with computational processing (Fig.1, left). A later elaboration of this scheme [SSS∗14] focuses on the human cognitive activities through which knowledge is generated. As a complement to this, we focus on thefinal productof visual analytics activities, i.e., on the knowledge that is generated.
The term ‘knowledge’ as such is very general and does not clearly define the expected product of the visual analytics process. Sacha et al. [SSS∗14] define knowledge generated by visual analytics as a trustworthy insight, i.e., an insight sufficiently supported by evidence. An insight, in turn, is de-fined as an interpreted finding, where a finding is an
interest-ing observation. It can be noted that this chain of definitions focuses on the process rather than the contents. Each def-inition refers to certain activities of the analyst: observing, interpreting, collecting evidence, and judging the trustwor-thiness.
Data
Visualization
Features, patterns,
model components, ...
Transformation Analysis
Visual mapping Visual mapping
Computational
processing
Controlling
Cognition
Knowledge
Model of
the subject
Aspect
Aspect Aspect
Relationships
…
Reality
Interaction
Perception
Refinement
Computer Human
represents Subject
[image:3.595.75.529.84.198.2]
Figure 1:We build on the commonly adopted representation of the visual analytics activities [KAF∗08] shown on the left. To support our reasoning, we have extended it with additional details. The extended scheme, shown on the right, clarifies that data reflect some piece of the reality (real world), which is the subject of the analysis. The final product of the analysis is a model representing the subject. The model is a form of knowledge, and it becomes a part of the analyst’s knowledge.
Generate
initial model Evaluate Appropriate?
Develop no
yes
Answer questions Structural
model Data Task
Transform data
Behavioral model Provenance
Externalize model
Externalized model Answers yes
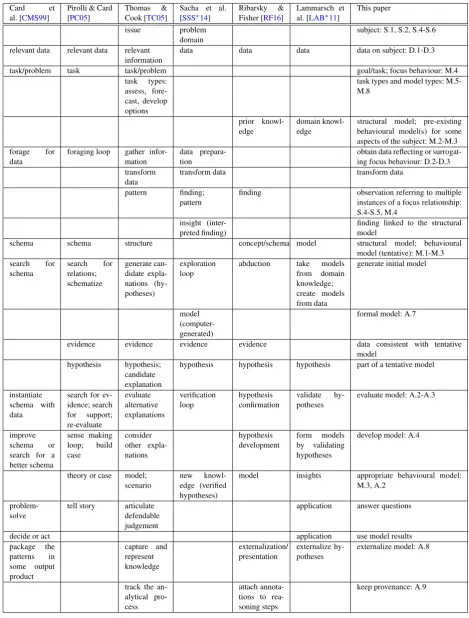
Figure 2:Our proposed representation of the visual analytics workflow (presented in detail in section5). The ovals symbolize data, information, and knowledge. At the top is what is given initially, and at the bottom are the primary results of the analysis: a behavioral model of the subject and the provenance of this model. At the right end are secondary results, which may be the behavioral model represented in external media and/or answers to questions concerning the subject. The rectangles stand for activities. The red block arrows show the sequence of the activities. The black arrows represent information flows. The dashed lines show the use of data, information, and knowledge, and the solid lines symbolize generation of knowledge and information.
insight but a knowledge product satisfying the analysis goal: “Analytical discourse should support the goal of creating a product that articulates a defensible judgment in problems of assessment, forecasting, and planning” [TC05, p. 39].
To give a more specific definition to the product that needs to be created, we propose to see it as amodelof some piece of reality (real world). We use the ambiguous term ‘model’ in the sense of “a schematic description or representation of something, especially a system or phenomenon, that ac-counts for its properties and is used to study its character-istics” [Edi11]. The model is derived from data, which are recorded observations and measurements of a part of the
re-ality. According to the types of visual analytics tasks ‘as-sess’, ‘forecast’, and ‘develop options’ [TC05, p. 35], analy-sis may aim at obtaining adescriptive,predictive, ordecision
supportingmodel (Fig. 3). A descriptive model describes
and explains relationships between aspects of reality. A pre-dictive model describes reality beyond the part reflected in available data. A decision supporting model defines possi-ble actions that can bring the reality to a desired state and assesses the effectiveness and implications of these actions.
According to this view of the visual analytics prod-uct, we elaborated the scheme coming from Keim et al.
[image:3.595.85.513.266.445.2](a)
... D
(b)
...
P
...
...
... (c)
...
S
...
[image:4.595.74.284.85.147.2]... ...
Figure 3:Types of behavioral models regarding the goal, or task. The dots represent aspects of a subject, and the rect-angles linked to the dots stand for combinations of relation-ships between the aspects. (a) A descriptive model (D), cor-responding to the task ‘assess’, describes the relationships that link aspects of a subject. (b) In a predictive model (P), corresponding to the task ‘forecast’, aspects are divided into inputs and outputs. The model is capable to tell what outputs will occur for given inputs. (c) A decision supporting model (S), corresponding to the task ‘develop options’, includes ac-tions (represented by the steering wheel) that can change some aspects. The model is capable to tell what actions can make desired changes. The flag represents a desired state that needs to be achieved.
two additions to the previous structure. First, the modified scheme shows that the data under analysis reflect some sub-ject, which is a part of the reality. Second, it shows that the knowledge that is expected to come out of the analysis pro-cess is amodel of the subject. For simplicity, we do not in-clude a detailed representation of the human cognitive ac-tivities [SSS∗14] but refer to them through the node ‘Cog-nition’. Compared to the original scheme, we have changed the label of the node initially called ‘Models’, which was referring to computer-generated models and other computa-tional artifacts. Since we use the term ‘model’ in a different sense (referring primarily to a model built in the mind of the human analyst), we label computer-generated artifacts as ‘Features, patterns, model components, ...’
Based on this scheme, we propose a representation of the visual analytics process as a goal-oriented workflow, shown in Fig.2, where the primary goal is to create a so-called
be-havioral modelof a subject, which can be used for getting
answers to questions about the subject. The workflow will be introduced in detail later on. Its main results are repre-sented by a green box at the bottom of Fig.2. Importantly, the results include not only the behavioral model but also the provenance, i.e., some representation of the way in which the model was obtained. The provenance ensures the traceability and reproducibility of the model derivation process and al-lows checking if everything was made correctly. The behav-ioral model and the provenance are, ideally, built in parallel; the workflow steps ‘Generate initial model’ and ‘Develop’ are responsible for that.
The general analytical workflow presented in Fig.2 sug-gests a perspective from which the research in the visual analytics field can be systematically viewed and analyzed.
Existing methods and tools can be characterized and classi-fied based on how they support the model building activities: transform data, generate initial model, evaluate, and develop, along with collecting and representing provenance informa-tion. Considering the visual analytics field from this perspec-tive can not only serve as a basis for surveying the field’s achievements but also lead to identifying useful directions for further research, as we demonstrate in this paper. Our contribution can be stated as follows:
• We introduce a conceptual framework for considering the visual analytics process as a model building workflow.
• On this basis, we define general requirements to methods and tools needed for supporting the analytical process.
• In the light of these requirements, we survey the re-search area of visual analytics and identify the existing ap-proaches to supporting different components of the model building workflow.
• We identify the areas of the visual analytics science where further research is needed and the possible directions for advancing the science.
In presenting our argument, we shall refer to a running ex-ample, which is introduces in Section2. In Section3, we dis-cuss the specifics of visual analytics with regard to other re-search disciplines concerned with data analysis, namely, in-formation visualization, knowledge discovery in databases, statistics, and machine leaning. Next, we discuss related frameworks and taxonomies in Section 4, introduce our framework in Section5, and, on this basis, review the state of the art in Section6. We discuss various aspects of the framework in Section7and conclude in Section8.
2. Running example: VAST Challenge 2011
To illustrate our concept, we use a running example based on the IEEE VAST Challenge 2011, Mini Challenge 1
[GWLN11], requiring analysis of the circumstances of an
epidemic outbreak in the fictive city of Vastopolis. The ques-tions mostly refer to the analysis task ‘assess’, requiring challenge takers to identify the origin of the outbreak and the affected area and to explain the mechanism of infection transmission. There are only some elements of ‘forecast’ (determine whether the outbreak is contained, i.e., forecast whether it will spread further) and ‘develop options’ (deter-mine whether it is necessary to deploy treatment resources outside the affected area). We shall extend the original tasks to forecasting how the situation will evolve further and find-ing suitable actions to fight the epidemic.
Using this example, we can briefly clarify the terms ‘be-havioral model’ and ‘structural model’ appearing in Fig.2
Persons
Tweets Space
Time reference Disease Population
Disease-affected sub-population
Spatial position
Time
Spatial position distributed in
distributed in
change over
part of
consists of can have
can generate can mention have
have have
is in
is in
is in
change over
[image:5.595.73.287.85.161.2]have
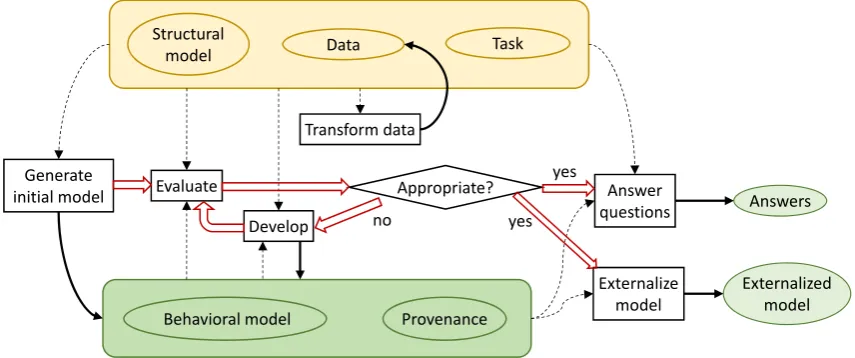
Figure 4:An example of a structural model describing the analysis subject of the VAST Challenge 2011, Mini
Chal-lenge 1 [GWLN11]. The nodes of the scheme represent
as-pects of the subject; general relationships between them are represented by labeled arrows. The highlighted ele-ments correspond to the stated task of the Challenge: build a behavioral model of the emergence and evolution of the disease-affected sub-population and its spatial distribution.
Challenge 2011. A behavioral modeldescribes a specific instantiation of the concepts and their structural relation-ships, which may be seen as theirbehavior. Depending on the analysis task, a behavioral model may focus on a sub-set of aspects and relationships. Thus, the VAST Challenge task requires describing the emergence and evolution of the disease-affected sub-population and its distribution in space. The corresponding parts of the structural model are high-lighted in Fig.4. Please note that the structural model only states that the disease-affected sub-population is distributed in space and changes over time. A behavioral model is ex-pected to describehowspecifically the affected population is distributed in space andhowit and its distribution change over time. For example, a behavioral model may say that the disease occurrences were initially concentrated in the city center and then spread eastwards while another concentra-tion appeared in the southwest along the river flow (Fig.5).
3. Specifics of visual analytics
It can be noted that the workflow in Fig.2does not include anything strictly specific to visual analytics. Indeed, it is a generic analytical workflow that visual analytics as a re-search discipline strives to facilitate. Similar workflows are referred to in defining the scope and research foci of infor-mation visualization and knowledge discovery in databases.
In defining information visualization, Card et al. [CMS99] refer to the process called “knowledge crystallization”, which involves getting insights about data relative to some task. This usually requires finding some representation (schema) for the data that is efficient for the task. The term
schemacorresponds to what we callbehavioral model, and
it can also be matched to the concept ofinternal modelused by Spence [Spe01]. According to Spence [Spe07], the un-derlying philosophy of information visualization is encapsu-lated in the statement by H.Simon: “solving a problem sim-ply means representing it so as to make the solution
trans-parent” [Sim96]. This statement can be applied to both an internal representation (model, schema) in the human mind and an external representation, e.g., on a computer screen.
Knowledge crystallization [CMS99] is the process of for-mation of a good representation (schema) for solving a prob-lem. It includes searching for an initial schema, instantiat-ing the schema with data, assessinstantiat-ing the residue (data that do not fit the schema), improving the schema to reduce the residue, and searching for a possibly simpler representation. This process corresponds very well to the workflow in Fig.2.
The goal of information visualization is to facilitate the knowledge crystallization process by visual representations of data. Information visualization is defined as “the use of computer-supported, interactive, visual representations of abstract data to amplify cognition” [CMS99] (p.7). As a field of research, information visualization is mostly con-cerned with mapping information to graphical representa-tions [CMS99,WGK10]. While the discussion of the knowl-edge crystallization process defines a possible context in which such representations can be used, information visual-ization (unlike visual analytics) does not aim at comprehen-sive support of the entire process but has a much narrower focus. Ward et al. [WGK10] refer to another possible con-text in which interactive visualizations can be used, namely, the knowledge discovery pipeline [FPSS96b].
Knowledge discovery in databases (KDD) is defined as the nontrivial process of identifying valid, novel, po-tentially useful, and ultimately understandable patterns in data [FPSS96a,FPSS96b]. A pattern is an expression in some language describing a subset of the data or a model ap-plicable to that subset. Extracting a pattern includes fitting a model to data, finding structure from data, or in general any high-level description of a set of data. The termprocess im-plies that KDD is comprised of many steps, which can be re-peated in multiple iterations. Fayyad et al. [FPSS96b] intro-duce a schematic representation of the KDD process, known as “the knowledge discovery pipeline” [WGK10]. It includes data selection, preprocessing, subsampling, and transforma-tions, followed by application of data mining methods (al-gorithms) to extract patterns. Data mining is thus a step in the KDD process. The next step is interpretation and eval-uation of the products of data mining to determine which patterns may be considered as new “knowledge”. This step can involve visualization of the extracted patterns/models or visualization of the data given the extracted models.
of the analytical process defines a broader context in which results of KDD research can be used.
Proposals to consider the overall human-driven analysis process have also been put forward in statistics [Han94] and in machine learning [BS97]. Still, the research in these disciplines concentrates on developing analytical techniques rather than supporting the process as a whole.
Unlike the other disciplines, visual analytics does not fo-cus on particular type of techniques (visualization, data min-ing, statistical analysis, or machine learning) that can be used within the analytical process. The fundamental goal of vi-sual analytics isto support the whole analytical process (dis-course)[TC05, p. 40]. To achieve this, it takes an integrative approach leveraging the achievements of the other analysis-centered disciplines for combining the best capabilities of computers and humans [KKEM10].
The schematic representation of the analytical process in Fig.2thus can provide a basis for surveying the visual ana-lytics research field in terms of supporting the process.
4. Related work
In this section, we discuss related works proposing concep-tual frameworks, taxonomies, or formalizations for visual analytics activities. The relevant works can be organized in categories according to their main focus: the visual analytics process, visual analytics methods, and analysis tasks relevant to visual analytics. After considering these three categories, we overview the works that deal with models in visual ana-lytics. Finally, we briefly state how our framework relates to the previous research, while a more detailed comparison is presented in Section7.4.
4.1. Defining the visual analytics process
As mentioned earlier, Thomas and Cook introduce three types of analytical tasks: ‘assess’, ‘forecast’, and ‘develop options’ [TC05, p. 35]. ‘Assess’ means to understand the current world and explain the past, ‘forecast’ means esti-mate future capabilities, threats, vulnerabilities, and oppor-tunities, and ‘develop options’ means establish different op-tional reactions to potential events and assess their effective-ness and implications. There are no clear definitions of the expected results of these task types. It is stated, without fur-ther elaboration, that the product of the task ‘assess’ is an assessment. For the task ‘develop options’, a few examples are given in application to homeland security problems.
Further on, various artifacts of analytical reasoning are defined: assumptions, evidence, patterns, arguments, hy-potheses, scenarios, etc. The process of analytical reason-ing is described as a sense-makreason-ing loop consistreason-ing of activ-ities ‘gather information’, ‘re-represent’, ‘develop insight’, and ‘produce results’ that allow “a defensible judgment in problems of assessment, forecasting, and planning” [TC05,
p. 39]. A specific sense-making process of intelligence ana-lysts [PC05] is discussed in more detail.
Keim et al. [KKEM10] extend the scope of the visual an-alytics science to a much larger area of applications than intelligence analysis. The earlier proposed flow diagram of the visual analytics process [KAF∗08] is reused to stress tight coupling between automated analysis methods and in-teractive visual representations. Lammarsch et al. [LAB∗11] present a variant of the visual analytics workflow diagram in which prior domain knowledge is distinguished from in-sights gained through the analysis. A special block is dedi-cated to hypotheses, and it is said that validated hypotheses become models. Models are defined as “representations of a system of entities, phenomena, or processes <. . . > that are validated by comparison to existing data” [LAB∗11, p. 10]. This treatment closely corresponds to what we mean by models in our paper; however, Lammarsch et al. [LAB∗11] consider models as a means of gaining insights rather than results of analysis.
The aforementioned framework by Sacha et al. [SSS∗14] describes the process of knowledge generation by a human analyst using visual analytics tools. The process consists of three loops: exploration, in which observations are made and interpreted, verification, in which hypotheses are formu-lated and supporting or contradicting evidence is sought, and knowledge generation, in which trustworthiness of insights is assessed. Rind et al. [RAW∗16] extended this framework to explicitly focus on users’ objectives and their plans to reach these objectives. Another extension is proposed by Ribarsky and Fisher [RF16]. By involving principles from cognitive science, they redefine the human-machine interac-tion loop as a ring where the ordering of the tasks or acinterac-tions is not prescribed. The proposed human-computer model is used for deriving interface design principles with the main goal to keep the human “in the cognitive zone” [GRF09, p. 4]. The principles include the support of direct manip-ulation, search by example, and knowledge externalization through annotation at any point in time.
The models focusing on the human cognitive activities
[GRF09,SSS∗14,RF16] use the ideas from the van Wijk’s
model of the visualization process [VW05], in which user’s perceptionPof an image increases the user’s knowledgeK. The knowledge gain is a function of the image, the user’s prior knowledge, and particular properties of the user’s per-ception and cognition. The current knowledge drives the pro-cess of interactive explorationE. To assess the value of a vi-sualization method, van Wijk proposes to estimate the costs of the method development and the user’s efforts and com-pare these to the value of the knowledge gained. Green et al. [GRF09] considerP,K, andEas interrelated cognitive processes; thus,Pmay driveE, andEmay feed toK, where
Federico, Wagner et al. [FWR∗17], which distinguishes be-tween tacit knowledge within the human and explicit edge within the tool and elaborates the processes of knowl-edge generation, conversion (i.e., internalization and exter-nalization), and exploitation.
Based on the activity theory, which originated from psy-chology and was adopted in HCI, Edge et al. [EHRLW18] define visual analytics activity as interplay of six elements: personas (types of people using the tools of the activity), products (derive insights, develop options, make arguments, present assessments, manage situations), capabilities (types of task supported by tools), contexts (co-located teams, dis-tributed teams, disdis-tributed communities, synchronicity, mo-bility), rules (types of constraint on the performance of activ-ity, such as relevance, confidence, provenance, access rights, and time pressure), and roles (producers, consumers, respon-ders, decision makers, policy makers). This model is used as a basis for defining guidelines for designers of visual ana-lytics systems. The authors highlight a set of six qualities that need to be supported through system design: portable analysis, presentable analysis, perspectival analysis, prox-emic analysis, provisional analysis, and polymorphic anal-ysis. They especially advocate support of workspaces that can be labeled, annotated (with a possibility to represent the work yet to be done), forked, and linked in ways that retail the provenance.
Chen and Jänicke [CJ10] focus on the communication of information contained in data to the user through visualiza-tion. The measures defined in information theory, in particu-lar, entropy and mutual information, can be used for quanti-fying information contents and uncertainty reduction in visu-alization. Chen and Jänicke note that a visualization system involves three types of information sources: input data, in-teraction, and prior knowledge. While it is relatively easy to apply the information-theoretic concepts to input data, they may not be readily applicable to the two other information sources, requiring adaptation and extension. The proposed framework deals only with information contained in input data. It is stated that, in principle, the visualization process does not generate more information than what is in the orig-inal data. Hence, the framework does not encompass gener-ation of new knowledge by a human interacting with visual-ization and applying prior knowledge [VW05].
In our work, we elaborate the definitions and models by Thomas and Cook [TC05] and Keim et al. [KAF∗08,
KKEM10] by proposing a more specific concept of the
ex-pected result of the visual analytics process (see4.5).
4.2. Defining and classifying visual analytics methods
Both books defining visual analytics as a research field
[TC05,KKEM10] give much attention to visual analytics
methods combining computational processing with interac-tive visualizations; however, the concept of combining the
two types of approaches is much older [SBM92]. Bertini and Lalanne [BL09] describe processes for visual and automated methods, analyze how close they are intertwined, and argue for a tighter integration. Stolper et al. [SPG14] describe a progressive visual analytics workflow, in which the analyst views and interprets partial results of computational process-ing and, on this basis, focuses the algorithm on subspaces of interest. Mühlbacher et al. [MPG∗14] define in a general way the possible strategies of combining computational pro-cessing with user involvement.
Several taxonomies of visualization, interaction, and anal-ysis methods exist in the literature. In the task by data type taxonomy [Shn96], methods are organized according to the types of data they can be applied to. Another proposed cat-egorization of methods is into visualization, display mod-ification, data transformation, and computational analysis [AA06]. There are multiple works where a description of the analytical process serves as a basis for systemizing meth-ods [CMS99,Chi00,CR98]. Some taxonomies are analyzed and compared by de Oliveira and Levkowitz [dOL03]. Roth
[Rot13] presents a taxonomy of interaction techniques
orga-nized according to “three broad user goals motivating use of the visualization”: procure, predict, and prescribe. These goals can be considered as corresponding to the task ‘as-sess’, ‘forecast’, and ‘develop options’ [TC05].
In Section 6, we discuss the existing visual analytics methods from the perspective of supporting the steps and components of the analysis process.
4.3. Characterizing and systematizing analysis tasks
Miksch and Aigner [MA14] link tasks, users, and data of vi-sual analytics methods (which are located in the middle of a triangle) by saying that for users to solve tasks, the methods need to be appropriate, for users to deal with data, the meth-ods need to be effective, and for showing the data accord-ing to the tasks, the methods need to be expressive. Amar and Stasko [AS05] describe similar challenges: the world-view gap exists between what is shown and what is actually needed by users; the rationale gap exists between perceiving a relationship and actually being able to explain it and its usefulness.
Aigner et al. [AMST11] refer to the classes of tasks adopted in data mining, which include classification, cluster-ing, search and retrieval, and pattern discovery. A typology of tasks in exploratory data analysis [AA06] defines tasks on the basis of data structure. Data components are catego-rized into independent and dependent variables, called refer-ences and attributes, respectively. Data represent a function that matches references to attributes. The general aim of data analysis is studying the behavior of this function. There are four major classes of analysis tasks:
• Pattern search: locate a particular behavior, i.e., find sub-sets of references where attributes have this behavior.
• Behavior comparison: identify similarities and differences between two or more behaviors.
• Relation seeking: find subsets of references for which a particular relation (‘same’, ‘different’, ‘opposite’, etc.) exists between the behaviors of two or more attributes.
The taxonomy involves the notion ofpattern, which is de-fined as a construct representing essential features of a be-havior in a general way. ‘To characterize a bebe-havior’ means to represent it by one or several patterns; the other classes of tasks are also related to the notion of pattern. The def-inition of a pattern is similar to that adopted in data min-ing, where a pattern is defined as an expression in some language describing a subset of facts without enumerating all these facts [FPSS96a]. The definition proposed for ex-ploratory data analysis [AA06] has a broader scope, also including representations in the human analyst’s mind. In both definitions, ‘pattern’ is a representation (constructed by a human or a computer) of something that objectively ex-ists in the studied behavior, i.e., “essential features of a be-havior” [AA06]. Accordingly, for a task to be fulfilled by a human with the help of visualization, the visualization must convey these essential features for enabling the human to construct appropriate patterns.
A multitude of task typologies have been introduced in the research areas of visualization, human-computer interaction, and information retrieval. The TaskCube concept by Rind et al. [RAW∗16] surveys such task typologies according to the dimensions ‘perspective’, ‘abstraction’, and ‘composi-tion’, and discusses how different notions of ‘task’ fit into various design and evaluation scenarios. Brehmer and Mun-zner [BM13] cite and discuss about 30 existing typologies in the context of presenting their own typology that unites the previously existing low-level and high-level classifications. The typology organizes the tasks according to three ques-tions: why the task is performed, how the task is performed, and what the task inputs and outputs are. This is similar to the questions considered by Aigner et al. [AMST11]: what is presented, why is it presented, and how is it presented? Sim-ilarly, Schulz et al. present a taxonomy that deals with ques-tions ‘why’, ‘what’, ‘where’, ‘when’, and ‘how’ [SNHS13]. With ‘what’ they mean patterns in the data, with ‘how’ the methods. The existing task typologies, including the multi-level taxonomy from Brehmer and Munzner [BM13], either do not consider the overall goals and expected final results of analytical activities or refer to them using very abstract terms, such as ‘present’, ‘discover’, ‘enjoy’, and ‘produce’. Thus, the term ‘produce’ means generation of any artifacts, including derived data, annotations, recorded interactions, or screen shots.
Gotz and Zhou [GZ09] propose a multi-tier framework representing visual analytics activity. At the highest level, there are tasks, i.e., the overall goals of the analysis. At the
next level, tasks are decomposed into simpler subtasks. At the third level, subtasks are translated into actions, which are accomplished using elementary events (operations), such as mouse clicks and selections in a menu. The authors focus on the tier of actions, for which they propose a typology simi-lar to the task typologies of other authors. The framework serves as a basis for semi-automated capturing of insight provenance during the analysis process, which is an impor-tant aspect of support to model building and externalization.
Our framework mainly focuses on the types of analytical tasks ‘assess’, ‘forecast’, and ‘develop options’ [TC05] and use concepts from the typology of exploratory tasks [AA06]. An important part of our framework relates to the work by Gotz and Zhou [GZ09] on collecting insight provenance.
4.4. Considering models
Tory and Möller [TM04] propose a taxonomy of visualiza-tion techniques applied in informavisualiza-tion visualizavisualiza-tion and sci-entific visualization, which are categorized based on the type of data model they use. ‘Continuous model’ corresponds largely to scientific visualization and ‘discrete model’ to information visualization. The term ‘model’ refers to data structure, unlike ‘model of reality’ in our paper.
Sedlmair et al. [SHB∗14] propose a conceptual frame-work for exploration of the behavior of simulation models. It includes a general data flow model, four navigation strate-gies, and six typical tasks pertaining to analysis of simula-tion models. From the perspective of our framework, a sim-ulation model is a piece of reality that is studied, and the overall analysis goal is to understand the relationships be-tween the parameter settings and corresponding outputs, i.e., to build a model of these relationships. Nevertheless, some concepts discussed by Sedlmair et al., such as uncertainty and sensitivity, are not specific to only simulation models but are relevant to various kinds of models.
There are works proposing models of human cognitive processes involved in the use of visual displays and inter-action techniques [GRF09,RFP09,RF16]. Liu and Stasko [LS10] discuss the construction of mental models. Visualiza-tion is considered as a means that helps users to internalize, process, and augment mental models. They also talk about externalization of models, but do not go deeper into building of models which are not mental.
In our framework, we consider mental models as essential results of visual analytics activities but do not focus on the cognitive processes involved in constructing such models.
4.5. Positioning of our work
Our paper elaborates and complements the existing frame-works focusing on the visual analytics process [TC05,
directed workflow leading to this result. We also elaborate the knowledge crystallization model [CMS99] considered in information visualization. It views the analytical process as iterative construction, evaluation, and improvement of a schema representing a problem (Section3). The concept of schema is equivalent to our concept of model of the subject. We define in more detail the starting point, goal, steps, com-ponents, and artifacts of the analytical process (Section5.2). We deem this specification useful for visual analytics re-search and practice, since visual analytics aims at facilitating the whole analytical process in a comprehensive manner.
In this paper, we use our framework as a basis for a sys-tematic survey of the research that has been done in visual analytics and as an instrument helping us to identify the di-rections and areas that need further research. The possible practical use of the framework is discussed in Section7.1.2.
5. Our conceptual framework
5.1. Summary
The underlying idea is that the overall goal of analysis is to build an appropriate representation, called ‘model’, of some piece of reality, called ‘subject’ (of the analysis); see Fig. 1, right. Our use of the term ‘subject’ corresponds to the term ‘object of study’ used by Tory and Möller [TM04]. ‘Ap-propriate’ means congruous to the reality and fitting to the purpose. The possible purposes correspond to the tasks ‘as-sess’, ‘forecast’, and ‘develop options’ [TC05]; accordingly, a model can be descriptive, predictive, or decision support-ing (Fig.3).
The subject is considered as a system composed of aspects linked by relationships. A model needs to represent (some of) these relationships. The subject usually does not allow direct perception and analysis. Models have to be built by analyzing available data on the subject, i.e., recorded obser-vations and measurements of its aspects. However, we deem appropriate to emphasize thatthe primary interest of the an-alyst is not the data per se but the reality reflected in the data.
Data can reflect only a part of the subject, while a model needs to represent not just this part but the subject as a whole. Hence, a model is a generalization from data. It is also a simplification of the subject: it may represent only a subset of the aspects and relationships and may omit de-tails. However, simplification is not the goal but the means of analysis.
A simple model can fully reside in the mind of the ana-lyst, but more complex models may be hard to fully keep in mind. Parts of such models may need to be offloaded to ex-ternal representations, such as formulas, graphics, and texts, while the human mind keeps an overall frame model contain-ing references to these external representations. Models may include component parts intended for performing
calcula-tions in computers. These parts are represented in computer-readable form and reside in computers. Still, the mind of the human analyst contains a frame model comprising a high-level representation of the subject and a sufficient represen-tation of the computer-resident components allowing appro-priate use of these components, e.g., for obtaining forecasts or making decisions.
A model of the subject, either fully contained in the ana-lyst’s mind or distributed over several media, is the knowl-edge that is gained through the process of analysis.
Figure2schematically represents the analysis process in accord with the model building perspective of visual analyt-ics. It explicitly includes the step ‘Evaluate’ and shows that an initially created model must be checked for appropriate-ness and, if not yet appropriate, developed further. The steps from ‘Evaluate’ to ‘Develop’ may need to be performed sev-eral times. This is an elaboration of the ‘Feedback loop’ from the original framework we build on [KAF∗08]. Unlike the previous schemes [KAF∗08,SSS∗14], Figure2shows that the analysis process eventually terminates, and that the ter-mination condition is that the model is appropriate. It will be discussed later on what model appropriateness means. Another important addition to the previous frameworks is explicit inclusion of the model provenance as a main result, apart from the model itself.
5.2. Basic definitions
Here we present our framework in detail through a set of def-initions, in which we use relevant concepts from the areas of entity-relationship modeling [Che76], object-oriented analy-sis and design [BME∗07], and systems sciences [Kli85]. The research in these areas forms a suitable basis for high-level modeling of the analytical process.
5.2.1. Subject
Definition S.1. Asubject (of analysis, reasoning, etc.) is a
piece of reality (real world). A subject can be seen as a sys-tem of components and their properties, jointly called as-pects, that are linked byrelationships. Any component can, in turn, be a system composed of other aspects linked by relationships.
Comment. The reality objectively exists. It can be
ob-served and/or measured, but it exists independently of the observations and measurements. The entire reality is too complex to describe in full. Analysis focuses on some piece of the reality, called ‘subject’.
Examples. The subject in the VAST Challenge is a
time or happen in time; hence, time is also an aspect of this subject. These aspects are linked into the system by various relationships (Fig.4): people live on the territory of Vastopo-lis, they move, i.e., their spatial locations change over time, they post tweets, the tweets have locations in space and times of appearance, some people get the disease, the disease cases have locations in space and times of appearance, and many others. Almost all aspects listed above are systems on their own. Thus, the territory of Vastopolis is composed of the land, river, streets, buildings, and other geographical objects linked by spatial relationships. The population consists of people. The disease outbreak is a system that includes the origin, the symptoms, the set of disease cases and its spatial distribution, the temporal evolution of the spatial distribution of the disease cases, etc.
Definition S.2. Aspects can be categorized intoentitiesand
attributes. Entities exist as separate and distinct things, i.e., they can be separated and distinguished from others. At-tributes are characteristics of entities; they do not exist sep-arately from entities.
Examples. The people and the tweets are entities. The
health condition is an attribute of people, and the message texts are an attribute of tweets. Locations in space (i.e., on the territory of Vastopolis) are entities; space can be seen as a continuous set the elements of which are distinct locations. Spatial locations have attributes, such as land cover or land use (river, street, building, etc.). Moments in time are also entities. Time is a continuous set composed of linearly or-dered moments. Time moments have attributes, such as time of the day (day or night) and day of the week. Some relation-ships between entities may be treated similarly to attributes. Thus, people, tweets, and disease occurrences are located in space, i.e., linked to certain spatial locations. This relation-ship to a spatial location (which may change over time) can be seen as an attribute of the people, tweets, and other kinds of entities. Tweets and disease occurrences are linked to cer-tain moments in time when they appeared. This relationship to time moments can also be seen as an attribute of the tweets and disease occurrences.
Definition S.3. Sets and subsets of entities are entities.
Comment. Any set of entities can be considered in its
en-tirety as a separate and distinct entity on its own. Such a composite entity is also an aspect of the subject. Generally, aspects may consist of other (simpler) aspects. Composite entities as wholes may have their attributes differing from attributes of the simpler entities they are composed of.
Examples. All people considered together are the
popula-tion of Vastopolis. The populapopula-tion as an entity has attributes ‘number of people’ and ‘spatial distribution’. The disease outbreak can be seen as an entity consisting of multiple dis-ease cases. As an entity, it has attributes ‘source’, ‘number
of cases’, and ‘spatial extent’, the latter two changing over time.
Definition S.4. Structural relationshipsbetween aspects are
abstract generic relationships by which the aspects as classes are arranged in a subject or in a more complex aspect.
Definition S.5. Instances of relationships between aspects
(shortly,relationship instances) are specific associations and interactions that actually happen.
Comment. Structural relationships are abstractions
refer-ring to classes of entities and types of attributes. Relation-ship instances are specific realizations of these abstractions. A relationship instance may have a limited time of existence.
Examples. ‘People move in space’ is a structural
relation-ship between people in general, space in general, and time in general. Similar considerations refer to ‘people have health condition’ (i.e., the attribute ‘health condition’) and ‘people produce tweets’. The relationships shown in Fig.4are struc-tural relationships. An instance of the relationship ‘people move in space’ is a specific person being in a specific loca-tion at some time. Such an instance exists for a limited time and then is replaced by another instance, in which the same person is linked to another spatial location. A specific health condition of a specific person at a specific time moment is an instance of the relationship ‘people have health condi-tion’. The structural relationship ‘people produce tweets’ is realized in multiple relationship instances between actually produced tweets and their specific authors.
Definition S.6. The behavior of a structural relationship
within a subject (shortly,relationship behavior) is the re-alization of this relationship in actual instances.
Comment. The term ‘behavior’ refers to the relationship
instances that actually happened and also to those that can potentially happen. It is a general manner in which a struc-tural relationship is realized in various instances. The term ‘behavior’ may also refer to a particular subset of relation-ship instances. There may be variations in the realization of a structural relationship between subsets of instances. This can be considered as a complex behavior consisting of sev-eral partial behaviors.
We use the term ‘behavior’ as an umbrella term embracing several more specific terms used in the literature for denoting particular classes of behaviors:distribution(of an attribute over a set of entities, of set of entities over space),variation
(of an aspect over space or over time),correlation(between attributes, between appearances of different entities), evolu-tion(of an aspect or another behavior over time),influence
(of one aspect upon another), andinteraction(between as-pects). This is mainly consistent with the previous usage of the term ‘behavior’ [AA06], but here we apply this term to aspects of the objectively existing reality while previously it was applied to components of data.
‘people move in space’ within the VAST Challenge scenario consists of the spatial positions and movements of all people during the time span of the scenario. In this overall behavior, several partial behaviors may be specially considered, such as the movements of all people before the disease outbreak, the movements during the outbreak, appearance of people in contaminated areas, and the movements of infected people.
The behavior of the structural relationship ‘people have health condition’ consists of the health conditions of all peo-ple of Vastopolis at different times. This includes the distri-bution of different health conditions over the population and the evolution of this distribution over time. The behavior of the structural relationship ‘people produce tweets’ consists of all instances of twittering.
5.2.2. Model
Definition M.1. Amodelis any representation of aspects of a
subject and relationships between them.
Comment. The form and medium of the representation
are not specified. It may be text in any language, either natu-ral or formal, graphics, formulas, computer code, etc. It may exist in human mind, be written or drawn on paper or in a digital document, encoded in internal computer structures, or it may be a physical model made of some material.
A model may represent not all aspects and not all relation-ships of a subject. For practical reasons, a model needs to be simpler than the subject it represents.
Definition M.2. A structural model is a representation of
structural relationships between aspects of a subject.
Comment. A structural model often exists in the mind of
the analyst as a part of the prior knowledge, or it is given in a problem definition, as in the case of VAST Challenge. Figure4gives an example of a structural model represented graphically.
Definition M.3. Abehavioral modelof a subject is a
general-ized representation of the behavior of one or more structural relationships within the subject. Thegoal of analyzing a sub-jectis to obtain a behavioral model of this subject.
Comment. A behavioral model is a generalized
represen-tation in the sense that it does not refer to particular rela-tionship instances but represents the general manner of the realization of the relationships; see Definition S.6and the following comment.
Definition M.4. Afocus behavioris a relationship behavior
that needs to be represented in a behavioral model, accord-ing to the analysis task. Afocus relationshipis a structural relationship whose behavior need to be represented in the model.
Examples. In the VAST Challenge, the goal is to obtain a
model representing the behavior of the relationships between the disease outbreak and the population of Vastopolis, space,
and time. The model must also specify what aspects and in what ways affect the disease spread, i.e., change the behavior of the disease relationships to the population and space.
Definition M.5. Adescriptive modelis a behavioral model
representing focus behaviors in a descriptive, passive man-ner and used for explanation and understanding.
Definition M.6. A predictive model is a behavioral model
representing the behavior of relationships between one sub-set of aspects, called ‘inputs’, and another subsub-set, called ‘outputs’, in a functional manner allowing to determine which specific outputs will actually happen for given spe-cific inputs.
Comment. In a descriptive model (Fig.3a), the
direction-ality of relationships is not prescribed, and all aspects are treated equally. A predictive mode (Fig.3b) distinguishes between inputs and outputs. Inputs are represented on the left of Fig.3b and outputs on the right. The relationships are directed from the inputs to the outputs.
Examples. A descriptive model of the disease outbreak
in the VAST Challenge scenario may say that the epidemic started on May 18, 2011 in the city center. There were two diseases with differing symptoms. One was conveyed by wind and spread in the eastern direction, and the other was conveyed by the river and spread in the southwestern direc-tion.
A predictive model of the outbreak must be capable of forecasting for the future time. Here, time is input, and out-puts are the people that will get infected and the spatial spread of the new disease cases. For a given moment in time, the model is expected to tell how many people will be in-fected and where in space they will be located.
Definition M.7. An action is purposeful modification of
some relationship behaviors.
Comment. An action may affect a relationship behavior
so that certain (desired) relationship instances will occur or get a higher probability of occurrence while occurrences of other (unwanted) relationship instances are precluded or be-come less probable. Actions are purposefully performed by some agents, in particular, by people. Actions are a particu-lar kind of aspect of a subject.
Examples. Actions in the VAST Challenge scenario may
include setting restrictions to movements of people (affect-ing the behavior of the relationship ‘people move in space’), giving medical treatment to sick persons (affecting the be-havior of the relationship ‘people have health condition’), cleaning of the affected area, decontamination of the wa-ter in the river, isolation of the infected people, evacuation of people from the affected area, informing and instructing people through mass media, acquisition and deployment of additional medical resources, etc.
model representing the behavior of relationships between in-puts, actions, and outputs in a procedural manner allowing to determine which actions will bring about desired modifica-tions of outputs for given specific inputs.
Comment. In Fig. 3c, actions are symbolically
repre-sented by a steering wheel. A decision supporting model is used for choosing suitable actions (possibly, combinations of several actions) by which desirable outputs (represented by a flag in Fig.3c) can be achieved. However, the model does not prescribe that certain actions must be fulfilled. In-stead, it describes what would happen based on given deci-sions. Moreover, the decision maker, while taking the model result into account, may also apply tacit knowledge, crite-ria, and preferences that have not been explicitly included in the model. The final decision may thus differ from what the model suggests.
Examples. In the VAST challenge scenario, the desired
condition is that the epidemic stops (no further people get infected) and sick people recover. A decision supporting model should allow the analyst to choose suitable actions for achieving this condition depending on the expected evo-lution of the disease.
5.2.3. Data
Definition D.1. Dataare recorded observations or
measure-ments describing some relationship instances.
Comment. Data include references to entities and
specifi-cations of attributes of the entities, i.e., data describe, in par-ticular, instances of relationships between entities and values of attributes. Data cannot describe all relationship instances that ever occurred; hence, data are always incomplete. Be-sides, there can be no data describing instances that will oc-cur in the future. Recorded observations or measurements can also be erroneous, i.e., describe relationship instances that did not happen instead of those that actually happened.
Example. For the VAST Challenge, there are the
follow-ing sets of data: (1) data describfollow-ing the territory of Vastopo-lis, given in a form of a map; (2) data describing the tweets by specifying their authors, times of posting, spatial loca-tions, and message texts; (3) data describing the wind direc-tion and speed on different days.
Definition D.2. A relationship behavior isdirectly reflected
in data if the data contain records describing instances of this relationship.
Definition D.3. LetR(A,B,C, . . .)be a structural relationship
between aspectsA, B,C, . . . such that its behavior is not directly reflected in data. LetA0be an aspect that may serve (possibly, under some assumptions) as a proxy for one of the aspects (say,A) inR. If the behavior ofR(A0,B,C, . . .) is directly reflected in data, the relationshipR(A,B,C, . . .)is said to besurrogatedin the data.
Comment. When some focus behavior is not directly
re-flected in available data, it is necessary to acquire additional
data describing instances of this relationship. One possibility is to derive the necessary data from available data that reflect the behaviors of other relationships based on the knowledge (model) of the structural relationships between the aspects. When there are no structural relationships allowing such a transformation, it may be possible to derive data surrogating the focus relationship under reasonable assumptions. If this is also not possible, the necessary data need to be obtained from other sources.
Example. Behaviors of the disease in relation to the
popu-lation, space, and time are not directly reflected in the VAST Challenge data. However, the following structural relation-ships of the disease to other aspects are known: people may contract the disease, and people may write about their health condition in tweets, i.e., the message texts of tweets may contain indications of the disease. The available data directly reflect the behaviors of the relationships between the tweets and people (the tweet authors) and between the tweets and disease indications (occurrences of particular keywords in the message texts). The known structural relationships of the disease to people and tweets suggest the following transfor-mations of the available data: (1) select the tweets where the message texts contain disease indications; (2) take the au-thors of the selected tweets as the sub-population affected by the disease; (3) take the locations of the earliest selected tweets of the affected people as the locations of the dis-ease occurrences. The so derived data surrogate instances of the relationship between the disease, people, space, and time under the assumption that infected people post mes-sages containing disease indications as soon as they get in-fected. These data may be inaccurate or even erroneous if the assumption does not hold. Besides, the data are definitely in-complete: since not all people may tweet about their health condition, not all disease cases are reflected in the data.
5.2.4. Analysis
Definition A.1. Analysisis the process of deriving a
behav-ioral model of a subject from data on this subject.
Definition A.2. A model is consideredappropriateif it meets
the following requirements:
• Correctness, i.e., consistency with the data;
• Fitness to the purpose, or task, i.e., capability to describe and explain the subject (‘assess’), to determine outputs corresponding to given inputs (‘forecast’), or to find suit-able actions for achieving a desired state of the subject (‘develop options’).
• Comprehensiveness, i.e., representation of all focus be-haviors;
• Sufficient scope:
– Sufficient coverage of the available data, i.e., consis-tency with all instances of the focus relationships that are available in the data;
available data, i.e., the capability to produce forecasts for all required combinations of inputs;
• Generalization, i.e., representation of all instances by a much smaller number of model components;
• Specificity, i.e., representation of significant distinctions among behavior instances;
• Parsimony, i.e., involvement of a minimal number of com-ponents;
• Resource efficiency, i.e., avoiding or reducing the use of excessively costly components (e.g., heavy calculations).
Comment. An initial model of the subject built at an early
stage of analysis may not yet be fully appropriate. In the following analysis, the initial model is developed into an appropriate model. The development process involves re-peated evaluation of the current state of the model against the requirements of Definition A.2. As these requirements are partly contradicting (e.g., generalization vs. specificity), an appropriate trade-off may need to be found.
Example. A model of the disease outbreak in Vastopolis
is supposed to represent two focus behaviors: (1) the distri-bution of the disease cases over the population, space, and time and (2) the influences of the wind, river, and contacts between people on the evolution of behavior (1) (which is treated as a composite aspect according to Definition S.1). The model must be consistent with the data, i.e., with the observed distribution of the disease cases reflected (or surro-gated) in the data. A descriptive model must explain the ob-served distribution by specifying the disease origin and the mechanism of the disease spread. A predictive model must forecast how the disease will evolve further, and a decision supporting model must support the choice of mitigation and recovery actions.
The model must be general, i.e., describe the outbreak as a whole and not the individual disease cases. However, the model must also be sufficiently specific. Thus, there are two distinct groups of disease symptoms (flu and diarrhea) and two distinct spreading behaviors (in the eastern and in the southwestern directions); see Fig.5. The model needs to rep-resent these distinctions but avoid reprep-resenting unnecessary distinctions, to satisfy the parsimony criterion.
Definition A.3. Model evaluation is checking whether a
model is appropriate.
Definition A.4. Model developmentis the process of
modify-ing a model to make it more appropriate.
Comment. Model development may include the
follow-ing operations:
• Rectify: decrease or eliminate the discrepancies between the model and the data;
• Expand the scope: modify the model so that it becomes consistent with a larger part of the data;
[image:13.595.311.528.81.191.2]• Increase inclusiveness: add representation of missing fo-cus behaviors in case of insufficient comprehensiveness;
Figure 5: A map of Vastopolis with the locations of the tweets mentioning flu and diarrhea symptoms represented by dots in yellow and cyan, respectively.
Figure 6:Application of spatial smoothing to the positions of the tweets.
• Simplify: decrease the number of model components, e.g., by merging some of the existing components or by subdi-viding the data into a smaller number of parts;
• Reduce cost: determine excessively costly components of the model and find cheaper substitutes.
The latter operation may require finding of a suitable trade-off between the cost and the accuracy of the model.
Definition A.5. Amental modelof a subject is a model that
is fully kept in the mind of the analyst.
Definition A.6. Adistributed modelof a subject is a model
that is partly kept in the mind of the analyst and partly in external media, so that the part residing in the analyst’s mind contains references to the external components. The mental part is calledmental frame model.
Comment. We posit that analysis always results in a
[image:13.595.312.527.238.348.2]one analyst that holds a mental frame model, which allows the full model to be composed from the distributed parts.
Definition A.7. A formal modelis a distributed model
in-cluding one or more components represented in computer-readable form, residing in computers, and intended for per-forming calculations in computers.
Comment. A model that fully resides inside a computer
cannot be used without any knowledge of it by a human, i.e., without a mental model of the model residing in the com-puter and a structural mental model of the subject it rep-resents. Therefore, we define a computer-oriented (formal) model as a special kind of distributed model.
Definition A.8. Anexternalized mental modelis a
represen-tation of a mental model (in particular, a frame model) in external media.
Comment. Since a model resulting from analysis resides
fully or partly in the analyst’s mind, others will not be able to use this model unless the analyst represents the mental component of the model in external media, so that this rep-resentation can be communicated to others and internalized by them.
Definition A.9. Provenance of a modelor model component
is a representation of the way in which it was created.
Comment. In communicating a model to others, the
an-alyst often needs also to explain how the model was ob-tained, so that it can be trusted by others. Provenance is also required in communicating not the model itself but results of using it, i.e., answers to questions, forecasts, or recom-mended actions. The analyst needs to refer the presented results to the parts of the model by which they have been obtained and also to explain where these model parts come from.
Example. In presenting answers to the VAST Challenge,
it is required to substantiate each statement, i.e., to commu-nicate the parts of the model from which these statements follow and to provide the provenance of these parts of the model.
5.3. A model as a subject or data source
There are analysis tasks in which analysts need to explore the behavior of a given computational model, such as a sim-ulation model [SHB∗14]. The analysis goal is to understand the relationships between the parameter settings and corre-sponding outputs,that is, in our terms, to build a (mental) be-havioral model of these relationships. In such analysis tasks, the given computational model is the subject of the analysis and the model of the relationships between the parameters and the outputs is the result of the analysis.
Another possible case is when analysts deal with a com-putational model representing a certain subject rather than
with data reflecting this subject. The role of the computa-tional model is to produce data for the analysis. For exam-ple, the analysis goal may be to study the connectedness between different parts of the city by public transport and how it is affected by delays in the vehicle circulation with respect to the timetables. There is a computational model that takes the existing timetables and the actual tracks of the public transport vehicles as inputs and calculates the ideal (timetable-based) and real (actual track-based) trajectories of trips by public transport for given origin-destination pairs and departure times. It also computes the trip durations and waiting times required for changing from one public trans-port route to another. In this example, the analysis subject is not the computational model producing the trajectories and their characteristics but the public transport system. The role of the model is to produce data reflecting the behavior of the system. More precisely, it transforms the available data (timetables and vehicle tracks) that do not reflect the focus relationships (connectedness between places) into data re-flecting these relationships. The expected result of the analy-sis is a completely different model, which identifies the parts of the city that are poorly connected to the others by the ex-isting public transport routes and those parts for which the connectedness is greatly affected by fluctuations in the pub-lic transport circulation.
A recent trend in visual analytics is the involvement of interactive visual interfaces in derivation of predictive mod-els using techniques of machine learning [ERT∗17], par-ticularly, deep learning (e.g., [AJY∗18]). In these works, computer-generated models often appear as an additional subject of analysis (apart from the reality that is being mod-eled): the analyst needs to understand how they work for be-ing able to improve (develop) them. Visual analytics aims to help the analyst “to open the black box” and consciously steer model development.
5.4. Analysis workflow
Based on the concepts introduced, the analysis process is schematically represented in Fig.2. The yellow block at the top represents what is initially given or known. This includes
• a structural model of the subject (D M.2; here and further on, ‘D’ stands for ‘Definition’), which may be a part of the prior knowledge of the analyst or a part of a problem statement,
• available data on the subject (D D.1),
• a task, including specification of the focus relationships (D M.4) and questions that need to be answered.
The original data may need to be transformed in order to reflect or surrogate the focus relationships (D D.2, D D.3).
appropriate, the analyst further develops the model (D A.4), thereby collecting the provenance. The steps of the model evaluation and further development are repeated until the model is judged as appropriate. Finally, depending on the task, the analyst externalizes the mental component of the model (D A.5–A.8) for communicating to others and/or an-swers the questions of the task.
Note. The specifics of model building from streaming data is that a model that was built using data available at a certain moment needs to be regularly evaluated against newly appearing data. When the model becomes inappro-priate, it needs to be developed further.
6. Surveying the visual analytics research
An obvious implication from the model building perspective on the analysis process is that visual analytics researchers and tool developers need to care about appropriate support for the model building activities and for the representation of analysis results, i.e., of the model and its provenance. Cur-rently it is not done in a systematic way, although elements of such support are present in all visual analytics papers de-scribing methods, systems, or applications. In this section, we review the literature for discussing these elements. We cannot survey all existing papers, but we have selected a representative subset of papers that covers all components of our framework and shows the existence of different ap-proaches to supporting the activities and representations in-volved in the analysis process.
6.1. Focus relationships and behaviors
Visual analytics papers describing techniques or applica-tions usually focus on certain focus relaapplica-tionships and present methods or procedures by which representations (models) of the behaviors of these relationships are derived from data. There is a relatively small set of generic structural relation-ships (D S.4) that repeatedly appear in papers as focus rela-tionships. These include:
• entities have an attribute or multiple attributes;
• entities appear and disappear over time;
• entities have locations in space;
• entities change their locations in space;
• attributes change over time;
• attributes vary over space;
• entities interact with other entities;
• entities consist of other entities or contain other entities;
• entities are arranged with respect to each other.
These common structural relationships are realized in var-ious subjects (D S.6). Thus, the relationships ‘entities appear and disappear over time’ and ‘entities are arranged with re-spect to each other’ are present in collections of electronic health records [MLL∗13], social media posts [WLY∗14], people’s daily behaviors [VJC09], and many other subjects.
While the behavior of a structural relationship may differ from subject to subject, there may be common types of fea-tures pertaining to different behaviors. Thus, for the rela-tionship ‘entities appear and disappear over time’, pertinent behavior features occurring in various subjects are random-ness, constancy, temporal trends, or periodicity regarding the temporal frequency of the appearance of entities, or the life-times of the entities, or re-appearances of the same entities (or the same categories of entities). Similarly, common be-havioral features could be listed also for the other structural relationships.
Directions for visual analytics research. It might be useful for the development of visual analytics as a science to create a taxonomy of common structural relationships and their pertinent behavioral features. If visual analytics researchers explicitly refer the approaches they propose to elements of this taxonomy, it may be easier for other re-searchers and for practitioners to find existing approaches oriented to particular structural relationships and behavioral features. Thereby, approaches could be transferred from sub-ject to subsub-ject, and the applicability of the approaches could be extended. Another possible use of the relationship and behavior taxonomy is systematic cataloging of the existing approaches and discovery of gaps in the coverage of the re-lationship space.
6.2. Data transformations
Data transformations are widely applied in visual analytics tools and workflows. Thus, it is very typical to transform unstructured data (images, videos, and texts) into structured records. The goal is not only to make data more suitable for machine processing but also to have the behaviors of certain focus relationships reflected or at least surrogated in the data (D D.2, D D.3). For example, Matkovi´c et al. [MGS∗14] are interested in the distribution of image attributes, such as lightness and colorfulness, over a set of images. To ob-tain data that reflect this behavior, Matkovi´c et al. derive the attributes from the sets of image pixels. For Gu et al. [GWM∗15], the focus behavior is the distribution of con-tents over a set of images and texts. However, the concon-tents are not directly represented in the data, and, moreover, ex-tracting contents from unstructured data is a complex prob-lem for which no general solution exists. Therefore, Gu at al. create a surrogate for the focus behavior based on an as-sumption that documents with similar contents have sim-ilar characteristics in terms of specific attributes, such as grayscale content, power spectrum, and color histogram of an image. These attributes are derived from the original data. Based on attribute similarities and distinctions, the docu-ments are arranged on a plane, to allow the user to perceive and inspect the distribution of the contents.

![Figure 4: An example of a structural model describing theanalysis subject of the VAST Challenge 2011, Mini Chal-lenge 1 [GWLN11]](https://thumb-us.123doks.com/thumbv2/123dok_us/1361365.89575/5.595.73.287.85.161/figure-example-structural-model-describing-theanalysis-subject-challenge.webp)