Contents lists available atScienceDirect
Sustainable Cities and Society
journal homepage:www.elsevier.com/locate/scs
A modelling tool selection process for planning of community scale energy
systems including storage and demand side management
Andrew Lyden
⁎,1, Russell Pepper
⁎,1, Paul G. Tuohy
Energy Systems Research Unit (ESRU), University of Strathclyde, Glasgow G1 1XJ, UK
A R T I C L E I N F O
Keywords: Modelling
Demand side management Battery storage Thermal storage Renewable energy Community energy systems District energy systems Distributed generation Design tools Selection process
A B S T R A C T
Storage and Demand Side Management (DSM) are key in integrating renewable energy into community energy systems. There are many modelling tools which support design of such systems. In order to select an appropriate tool it is essential to understand tool capabilities and assess how these match requirements for a specific si-tuation. The aim of this paper is to provide a process to be used to make such a selection consisting of: (i) a tool capability categorisation, (ii) a stepwise tool selection process.
Capabilities of 13 tools (screened from 51) for community scale were categorised covering: input data characteristics; supply technologies; design optimisation; available outputs; controls and DSM; storage; and practical considerations.
A stepwise selection process is defined, adapted from software engineering, in which tools are scored based on
‘essential’,‘desirable’, or‘not applicable’technical capabilities for the specific situation. Tools without essential
capabilities are eliminated. Technical scores and practical considerations are then used to select the tool. The process is demonstrated for a simple case study.
The future applicability of the selection process is discussed. Findings from the capability categorisation process are highlighted including gaps to be addressed and future trends in modelling of such systems.
1. Introduction
1.1. Community scale energy systems
Energy systems worldwide are undergoing a transition towards sustainability driven by three primary goals: energy security, energy equity, and environmental sustainability (World Energy Council, 2015). One impact is increasing use of renewable energy through community scale energy systems. These systems have been the subject of a range of research including technical analysis (Ahadi, Kang, & Lee, 2016; Bhattacharyya, 2012; Chmiel & Bhattacharyya, 2015; Deshmukh & Deshmukh, 2008), socio-economic studies (Rogers, Simmons, Convery, & Weatherall, 2008;Walker, Devine-Wright, Hunter, High, & Evans, 2010), and environmental and institutional studies (Koirala, Koliou, Friege, Hakvoort, & Herder, 2016;Rae & Bradley, 2012) which identify important roles for such systems in the future.
Community scale energy systems are being promoted by policy. They accounted for 22% of installed renewable electricity capacity in 2012 in Germany (Romero-Rubio & de Andrés Díaz, 2015), UK policy is for these systems to provide 8% of renewable electricity capacity by
2020 (Capener, 2014), and in Scotland there is a target for 2GW by 2030 (Scottish Government, 2017). In Denmark, local communities attract preferential shares in local wind projects (Danish Government, 2008).
One challenge concerning the use of renewable resources is that they are often stochastic, causing supply to demand mismatch. Storage and DSM can address this by decoupling the dynamics of supply and demand. Storage and DSM can enable supply to demand matching at various timescales e.g. systems that react in the order of seconds to balance grid voltage or frequency deviations, or systems that allow load shaping on half-hourly or hourly scales over day or part day horizons to accommodate renewables or achieve lowest cost (Ganu et al., 2012). Future community systems may also include longer timeframe seasonal storage potentially through energy vectors such as hydrogen, or fuel synthesis such as production of green methane or methanol etc. It is proposed that the integration of electricity, thermal and transport sys-tems should be considered to achieve an overall optimum (Mathiesen et al., 2015).
In this paper‘DSM’is used to describe mechanisms for adjusting loads on the demand side i.e. downstream of the generation point(s).
https://doi.org/10.1016/j.scs.2018.02.003
Received 14 August 2017; Received in revised form 25 January 2018; Accepted 6 February 2018 ⁎Corresponding authors.
1Both contributed equally to this paper.
E-mail addresses:[email protected](A. Lyden),[email protected](R. Pepper).
Available online 09 February 2018
2210-6707/ © 2018 The Authors. Published by Elsevier Ltd. This is an open access article under the CC BY license (http://creativecommons.org/licenses/BY/4.0/).
‘Storage’is used to mean both explicit thermal, electrical and chemical storage systems and also the inherent storage capacity available in buildings and systems due to their thermal inertia. Storage may be utilised through appropriate controls to provide DSM services.
Explicit storage technologies can be in many forms e.g. batteries (Crespo Del Granado, Wallace, & Pang, 2014), night time ceramic thermal storage (Strbac, 2008), water or phase change material based thermal energy stores (Arteconi, Hewitt, & Polonara, 2013), and che-mical storage through energy vectors such as hydrogen (Agbossou et al., 2001). Energy systems can also utilise inherent storage e.g. in buildings, distribution networks, fridges and freezers etc. Other DSM techniques include encouraging behavioural change in consumers (Campillo, Dahlquist, Wallin, & Vassileva, 2016).
1.2. Modelling tool selection for community scale energy systems
Given the importance of community scale energy systems, wide variation in possible supply, storage control options, and different contexts such as climates and user expectations, there have been many efforts to provide modelling support for the planning process from a range of different perspectives. A general method for community en-ergy planning is described in (Huang, Yu, Peng, & Zhao, 2015); a key element identified is the use of modelling tools. Many tools have been developed and applied to a range of situations.
EnergyPLAN (University of Aalborg, 2017a) is a national and re-gional planning tool which has been used to model a 100% renewable energy future for Denmark (Lund & Mathiesen, 2009) and for many other studies (University of Aalborg, 2017b). It is applicable at com-munity scale, and was used to model the island of Mljet in Croatia (Lund, Duić, Krajacić, & Graça Carvalho, 2007) in a comparative study with H2RES, an alternative tool designed for simulating the integration of renewables and hydrogen storage into island systems (University of Zagreb, 2009). In this study, it was shown that both tools gave very similar results; H2RES focus is technical while EnergyPLAN supports technical and economic analyses. Both tools are deterministic and used an hourly energy balance over a year to calculate energy generated, stored, rejected, consumed, exported, lost, and produced in excess, as well as percentage of energy consumed from renewable sources.
HOMER (HOMER Energy, 2017c) is a community-scale tool, origin-ally developed to support design of off-grid community scale electrical energy systems but expanded to model grid connected and thermal systems (HOMER Energy, 2017b). One example is modelling a hybrid solar-biomass system for a remote area in Pakistan (Shahzad et al., 2017). This study used electricity demand, available solar and biomass resource, and costs to analyse the techno-economic viability of such a system. HOMER was used to optimise system size using an hourly energy balance and with minimum net present cost (NPC) as objective function. Merit (University of Strathclyde, 2015) is another community-scale tool which has been used to model a hybrid wind/solar system for a care home in Scotland (Morton, Grant, & Kim, 2017). Merit models demands, supply and storage using an hourly energy balance and pro-vides results showing demand/supply match and renewable and non-renewable supply. Multiple systems were modelled, and those shown to satisfy demand all year round analysed. The tool provides technical analysis only with cost calculations being done outside of the tool.
TRNSYS (TRNSYS, 2017) has a user-defined time step as small as 1 s. A comprehensive library of components is available. Systems are described in detail and the solver is dynamic which means that TRNSYS is usually a building-level simulation tool (Beausoleil-Morrison et al., 2012); the number of components and parameters required for a community scale system could be complex requiring expert level of technical systems knowledge and complex calculations take consider-able time. It has been used to model hybrid solar PV/thermal systems with thermal and electrical storage (Kalogirou, 2001) etc. TRNSYS and similar building level simulation tools can be scaled up for use at community-scale.
The tools described above are a sample of those available and serve to illustrate different approaches. There is general agreement that hourly modelling timesteps (or less) are required to adequately model such systems (Lambert, Gilman, & Lilienthal, 2006). Tools are oftenfirst developed from a specific perspective e.g. hydrogen for H2RES, off-grid for HOMER, building systems for TRNSYS, and then adapted to support broader planning of community scale systems. How to choose between the plethora of different tools, particularly for planning of renewable energy systems where storage and DSM are to be considered, is a key challenge to be addressed in this paper.
A number of reviewers have previously provided an overview of modelling tool capabilities specific to the effective integration of re-newable energy. In general it was found that the prior work, although extremely useful foundation for the work of this paper, did not: (i) address all storage and DSM options, (ii) provide a sufficiently detailed categorisation of the models used to represent storage and DSM, (iii) provide a structured tool selection process. The most relevant of these previous works are briefly described below.
(Connolly, Lund, Mathiesen, & Leahy, 2010) reviewed 37 tools (nar-rowed down from 68) regarding their suitability for the integration of renewable energy into energy systems; the details on the storage tech-nologies used in the tools are high level i.e. stating whether a tool is capable of modelling pumped hydroelectric, battery, compressed air and hydrogen storage. Thermal storage and DSM are not included in the provided tables;‘thermal storage’is mentioned for three of the tools in textual descriptions. The underlying models for electrical and thermal storages are not discussed in detail; such information can be useful to inform tool selection as some models can be more accurate than others (Copetti, Lorenzo, & Chenlo, 1993; Dumont et al., 2016). The authors provide the review to inform tool selection and the provided information is indeed useful in this regard but a formal selection process is not specified. (van Beuzekom, Gibescu, & Slootweg, 2015) considered 72 tools to find those capable at city scale of modelling multi energy systems considering all relevant energy carriers (electricity, heating, cooling, transport etc.). They considered in detail 13 of the tools which were open source. Information regarding the tools was usefully tabulated including: available RES components, storage options, economic para-meters, scale, availability, objective, modelling approach, time step, evaluation criteria, user friendliness and training requirement. The paper identified the different storage technologies included in the en-ergy tools but did not give detail on the underlying models. While it was highlighted that grid balancing is essential in districts utilising sto-chastic energy sources, the DSM and grid support modelling capability of the tools was not captured. No tool selection process was specified. (Allegrini et al., 2015) reviewed 20 tools chosen based on their ability to“simulate and analyse urban energy systems”. Storage dis-cussion was limited to seasonal thermal storage modelling, with building level storage capability documented within the tables but not in detail, DSM also is not covered in detail.
Several further reviews of energy system tools have been under-taken. (Keirstead, Jennings, & Sivakumar, 2012) reviewed 219 studies, examining areas of urban energy systems (technology design, building design, urban climate, systems design, policy assessment, land use and transportation modelling) to evaluate their potential for integrated urban design. (Mendes, Ioakimidis, & Ferrao, 2011) reviewed 6 bottom-up tools which focus on optimisation of community energy systems, finding DER-CAM and MARKAL/TIMES to be the most appropriate. (Markovic, Cvetkovic, & Masic, 2011) documented the capabilities and inputs/outputs of 11 energy tools, a short paragraph on each was provided in terms of their energy, economic and environmental analysis capabilities. (Mirakyan & De Guio, 2013) undertook a review of 12 tools to consider the methods available for integrated energy analysis for cities and territories. These reviews all lack details on storage and DSM functionality and modelling, and none provide any tool selection process.
‘software tool selection process’by Sandia National Laboratories (Lin et al., 2007) systematically evaluate, rank and select software tools according to user requirements. The Sandia process has the following steps: (i) gather requirements and sort these into‘essential’ and ‘de-sirable’categories, (ii) assess quality of software manufacturer, soft-ware quality and compatibility, and (iii) assess the softsoft-ware against requirements and select the bestfit. The process focusesfirst onfinding tools with all‘essential’criteria, which are then ranked based on ‘de-sirable’criteria. An extension of the methodology was proposed (Jong, Hernandez, Post, & Taylor, 2011) which uses pair-wise comparison to aid in weighting of‘desirable’requirements in addition to a Pugh Table to aid tool selection. It would appear that this approach could be use-fully adapted to support a tool selection process for community scale energy systems including storage and DSM.
1.3. Aims, methodology and scope
The specific aims of this paper are: (i) to categorise and document capabilities of tools suitable for modelling community systems for the planning design stage with focus on incorporation of storage and DSM, and (ii) develop a selection process based on these documented cap-abilities to identify tools suitable for modelling in a specific situation. This will be achieved through:
•
An initial screening process to identify potentially suitable tools.•
Categorisation and tabulation of modelling tool capabilities andcharacteristics.
•
Development of a tool selection process using the tables.•
Demonstration of the selection process for a case study.•
Discussion of thefindings.The scope of the work presented here has been limited to tools designed for hourly or sub hourly timestep modelling of community systems containing low-carbon technology, storage and DSM, for use at the planning stage. More detailed building and system design tools have been considered outside of the scope of this paper.
There is an increasing trend towards using modelling tools in con-junction with other modelling tools or external software such as MATLAB (Bava & Furbo, 2017), GEN-OPT (Wetter, 2000), En-ergyTRADE (EMD, 2017a) etc. particularly to support mathematical optimisations or realistic controls. These multi-tool processes are also outside the main focus of this paper but will be discussed at the end.
The authors recognise that tools are continuously being developed and that the screening analysis and the tool classification exercise will need to be refreshed periodically. The work of this paper, in addition to providing a current snapshot, provides a useful framework for this re-fresh within the context of the proposed tool selection process.
2. Initial screening process to identify potentially suitable tools
An initial list of 51 tools with some ability to model an energy system was derived from: literature including review papers and papers describing the development and application of tools; tool user manuals and websites; and communications with tool providers. Tools captured in previous reviews but clearly not capable of modelling community scale energy systems were discounted, for example, Envi-met is a mi-croclimate and landscaping tool (ENVI_MET, 2017), and Radiance is used in daylight prediction (Lawrence Berkeley National Lab, 2017).
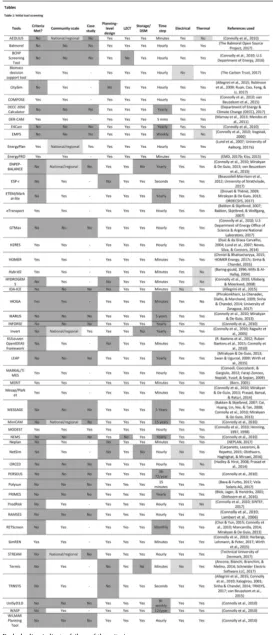
A set of criteria were applied to the 51 tools in order to determine in more detail their potential suitability (Table 1). A tool passed the cri-teria if it could be used at community scale (i.e. was defined as such or had a case study demonstrating this capability), was appropriate to the planning stage, incorporated renewable and low carbon technology and storage and DSM, had hourly or sub-hourly timestep and could cover either thermal or electrical energy supply. The screening process is captured inTable 1along with relevant references.
This process resulted in the identification of 15 tools suitable for modelling community scale energy systems incorporating renewable energy sources, storage and DSM, for use at planning design stages. Two of the 15, MODEST and Mesup/PlaNET were discounted due to lack of accessible information required for more detailed analysis. This left 13 tools to be carried forward into the categorisation of capabilities and tool selection process.
Further details of the initial screening criteria are given below. Community scale: This criterion is met if the tool manual, guidance documentation or associated publications had specifically described the tool as applicable at community scale.
Community scale case study: Some tools identified as being pri-marily for‘national’or‘regional’planning rather than for community scale had available case studies or other documentation demonstrating application at community scale so were included, study references are given in the table.
Planning-level design: Tools capable of modelling for planning-level design were deemed to be in scope (see Section1.3) and to pass this criterion. More detailed building or system design tools, which require very detailed user inputs to describe each individual building and system component, were deemed not to meet the criteria.
Low or zero carbon technologies (LZCT): Modelling of at least one low-carbon or renewable technology was imposed as a minimum.
Storage and DSM functionality: Modelling of at least one form of storage and DSM was imposed as a minimum.
Time step: Criterion met if capable of a time step of one hour or less. Electrical and/or thermal modelling: The criterion imposed was the ability to either model electrical or thermal networks. Community systems can consist of electrical, thermal and transport demands; electrical and thermal generating components; microgrid networks; transport fuel systems; thermal networks; and various DSM
Table 1
Initial tool screening (Connolly et al., 2010;The Balmorel Open Source Project, 2017;U.S Department of Energy, 2016;The Carbon Trust, 2017;Allegrini et al., 2015;Robinson et al., 2009;Ruan, Cao, Feng, & Li, 2017;Connolly et al., 2010;van Beuzekom et al., 2015;DECC, 2017;Marnay et al., 2013;Mendes et al., 2011;Connolly et al., 2010;Connolly et al., 2010; Vogstad, 2000;Lund et al., 2007;University of Aalborg, 2017a;EMD, 2017b;Kiss, 2015;Connolly et al., 2010;Mirakyan & De Guio, 2013;van Beuzekom et al., 2015; Beausoleil-Morrison et al., 2012;University of Strathclyde, 2017;Drouet & Thénié, 2009;Mirakyan & De Guio, 2013;ORDECSYS, 2017;Bakken & Skjelbred, 2007;Bakken, Skjelbred, & Wolfgang, 2007;Connolly et al., 2010;U.S Department of Energy Office of Science & Argonne National Laboratory, 2017;Duić& da Graca Carvalho, 2004;Lund et al., 2007;Neves, Silva, & Connors, 2014;Chmiel & Bhattacharyya, 2015;HOMER Energy, 2017c;Sinha & Chandel, 2015;Baring-gould, 1996;Mills & Al-Hallaj, 2004;Connolly et al., 2010;Ulleberg & Moerkved, 2008;Allegrini et al., 2015;Phrakonkham, Le Chenadec, Diallo, & Marchand, 2009;Sinha & Chandel, 2014;University of Zaragoza, 2017;Connolly et al., 2010;Mirakyan & De Guio, 2013;Connolly et al., 2010;Connolly et al., 2010;Ragwitz et al., 2005;Baetens et al., 2012;Baetens et al., 2015;Connolly et al., 2010;Mirakyan & De Guio, 2013;Swan & Ugursal, 2009; Wirth et al., 2015;Comodi, Cioccolanti, & Gargiulo, 2012;Faraji-Zonooz, Nopiah, Yusof, & Sopian, 2009;Born, 2001;Connolly et al., 2010;Mirakyan & De Guio, 2013;Prasad, Bansal, & Raturi, 2014;Bakken & Skjelbred, 2007;Cai, Huang, Lin, Nie, & Tan, 2009;Connolly et al., 2010;Mirakyan & De Guio, 2013;Connolly et al., 2010;Connolly et al., 2010;Henning, 1997, 1998;Connolly et al., 2010;NEPLAN, 2017;Carpaneto, Lazzeroni, & Repetto, 2015;Olsthoorn, Haghighat, & Mirzaei, 2016;Hadley & Hirst, 2008;Prasad et al., 2014;Connolly et al., 2010;Bava & Furbo, 2017;Vela Solaris, 2017;Blok, Jager, & Hendriks, 2001;Olsthoorn et al., 2016;Connolly et al., 2010;SINTEF, 2017;Connolly et al., 2010;Lambert et al., 2006;Choi & Yun, 2015;Connolly et al., 2010;Mancarella, 2014;Mirakyan & De Guio, 2013;Connolly et al., 2010;Herbergs, Lehmann, & Peter, 2017;Wirth et al., 2015;Technical University of Denmark, 2017;Ancona, Bianchi, Branchini, & Melino, 2014;Schneider Electric Software LLC, 2017;Allegrini et al., 2015;Connolly et al., 2010;Kalogirou, 2001;Sinha & Chandel, 2014; TRNSYS, 2017;van Beuzekom et al., 2015;Connolly et al., 2010;Connolly et al., 2010;Connolly et al., 2010).
Table 1(continued)
technologies interacting across the spectrum. Integration of these en-ergy sectors can provide synergistic benefits, often resulting in a higher penetration of renewable supply (Mancarella, 2014; van Beuzekom et al., 2015). While anidealenergy system tool would combine all these energy vectors, it was recognised that many community system design tasks utilise just one, so this was set as the minimum criteria.
3. Categorisation of modelling tool capabilities
Tool capabilities tables were generated for the 13 modelling tools that document:
1. Input data requirements and input support capabilities.
2. Electrical and thermal supply technology modelling capabilities in-cluding district heating.
3. Design optimisation, outputs capabilities, controls and DSM mod-elling capabilities.
4. Storage modelling capabilities and underlying storage models. 5. Practical considerations
These tables are intended to be useful in the tool selection process (described later in Section4) by providing information on the capability of tools to be assessed against requirements for a specific community system analysis.
3.1. Input data requirements and input support capabilities
Tools have different levels of input data requirements; some tools require the energy demand profiles, local climate, system character-istics, or generation profiles to be explicitly input as time series directly by the user. Other tools have embedded functions and libraries that provide support in generating detailed datasets from simple inputs, and/or support a mix of both directly entered and tool generated cal-culation inputs. This functionality could be essential, desirable, or not applicable depending on availability of data or expertise.
The key characteristics related to data input requirements for the various tools are captured in and described below.
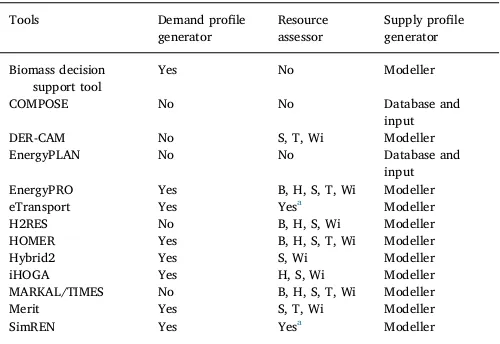
3.1.1. Demand profile generator
[image:5.595.39.289.535.707.2]Tools were deemed to contain a demand profile generator (‘Yes’in Table 2) if functionality exists to support synthesis of electrical, thermal or fuel demand profiles in hourly or sub-hourly time steps from simple
inputs such as monthly or annual bill data or descriptions of building numbers and types, demographics, etc. Others which take the approach that either explicit half hourly or hourly metered data needs to be ob-tained, or potentially generated using a secondary modelling process (e.g. using building performance simulation tools), were categorised as ‘No’for this category.
3.1.2. Resource assessor
A resource assessor gives access to weather and other resources (e.g. solar radiation, wind, water, biogas and biomass) in a suitable data input format (e.g. from national or international datasets) based on simple inputs (e.g. location). The resources covered were identified for each tool.
3.1.3. Supply profile generator
A supply profile generator provides electric, thermal or fuel-pro-ducing system outputs for use in the modelling.‘Modeller’describes a tool which generates the supply profile from the resource input (e.g. climate) and the device specifications. For example, in HOMER, local wind speeds (the resource input) and a specific wind turbine specifi -cation (a power curve and other details) are used to calculate the wind turbine supply profile.‘Database and input’describes a tool where the hourly or sub hourly supply profiles are input directly requiring the user to do some outside tool calculations or source such datasets.
3.2. Electrical and thermal supply technology modelling capabilities
Tools vary with respect to the range of supply technologies that can be directly modelled. Table 3. captures information about available supply technologies within the different tools and more detailed de-scription is given below.
A wide range of electrical supply systems can be modelled, most tools support modelling of connection to the external electricity grid. Two categories have been assigned for modelling of the grid connection:‘Grid simple’allows for limitless import and export, with static pricing; more complex‘Grid’models include features such as connection limits and charges, complex time based import and export tariffs etc.
The modelling of district heating systems, if available in the tools, is only as an estimated heat loss. This is a continuous heat loss as a centage of peak load in the Biomass decision support tool, or a per-centage of real-time load as in EnergyPRO. The heat demand density, distribution temperature and other factors such as controls which have a large effect on ancillary energy use and losses in district systems are not directly considered and are required to be captured by the user in inputting thermal demand profiles.
District heating is becoming more popular in the UK (Burohappold Engineering, 2016; Energy and Utilities Alliance, 2016), and is ubi-quitous in Scandinavia and Eastern and Central Europe (Euroheat, 2015). It has potential to increase energy system overall efficiency and provideflexibility for more effective use of waste heat and renewables using thermal storage which is much cheaper at district scale than for individual buildings and much cheaper than an equivalent capacity of electrical storage (Lund et al., 2016). It is therefore important to con-sider district heating while it will not necessarily be appropriate in all circumstances.
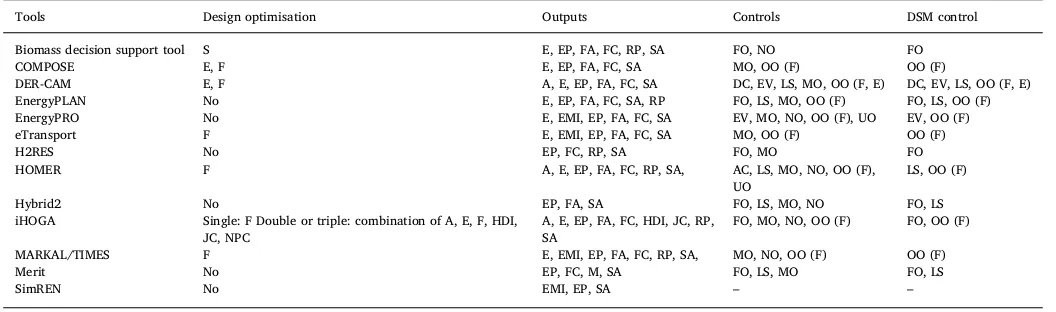
3.3. Design optimisation and output capabilities
Two attributes important in supporting design tasks are: the cap-ability of the tool to aid the identification of optimum design solutions, and the ability of the tool to directly provide outputs required to sup-port decision making. Key capabilities of the 13 tools in these areas are captured in thefirst two columns of Table 4 and further discussed below.
Table 2
Input data support capabilities.
Tools Demand profile generator
Resource assessor
Supply profile generator
Biomass decision support tool
Yes No Modeller
COMPOSE No No Database and
input
DER-CAM No S, T, Wi Modeller
EnergyPLAN No No Database and
input EnergyPRO Yes B, H, S, T, Wi Modeller
eTransport Yes Yesa Modeller
H2RES No B, H, S, Wi Modeller
HOMER Yes B, H, S, T, Wi Modeller
Hybrid2 Yes S, Wi Modeller
iHOGA Yes H, S, Wi Modeller
MARKAL/TIMES No B, H, S, T, Wi Modeller
Merit Yes S, T, Wi Modeller
SimREN Yes Yesa Modeller
Resource Assessor Key: Biomass (B); Hydro (H); Solar radiation (S); Temperature (T); Wind (Wi).
aindicates that a resource assessor exists but the specifics were unable to be
3.3.1. Design optimisation
Optimisation toolsfind the minima, or maxima, for a defined ob-jective function by systematically searching a defined modelling space according to a mathematical algorithm. Design optimisation involves a search for the optimal system w.r.t. combination and sizing of compo-nents. Most of the reviewed tools where they support optimisation use a full factorial deterministic approach based on user defined inputs to solve the optimisation problem and use a simple financial and/or carbon emissions objective. HOMER historically has executed a grid search based on user defined inputs specifying the system options to be included but recently provided an update allowing users to only input upper and lower limits to the grid search. iHOGA was the only identi-fied tool with multi-objective function capability, it includes a choice of available objective functions and embedded genetic algorithms ( Dufo-Lopez, Cristobal-Monreal, & Yusta, 2016). The Biomass decision sup-port tool supsup-ports the optimisation of thermal storage size. A number of reviews have covered the mathematical optimisation methods that could potentially be employed (Baños et al., 2011;Iqbal, Azam, Naeem, Khwaja, & Anpalagan, 2014). Tools which do not directly support mathematical optimisation could be used within an external mathe-matical optimisation process by an iterative approach, but this can be
logistically complex or require advanced software skills to automate.
3.3.2. Outputs
The outputs are key in assessing system performance. Different tools focus on different aspects of the system performance; most tools provide financial analysis such as cost/kWh of energy produced or information on energy market interactions, some are purely technical and focus on the energy production, system analysis, demand/supply match, or fuel consumption, others assess emission and renewable penetration, and others consider social factors such as job creation and the human de-velopment index. Specific tool outputs can be used in external calcu-lations to generate a wider range of analysis outputs but only the in-tool capabilities are documented here.
3.4. Control modelling capabilities including DSM
[image:6.595.36.562.80.219.2]The ability to correctly capture controls is important in assessing the performance of community scale energy systems and particularly so when assessing the impacts of storage and DSM in such systems. Modelling tools often have in-built control logic intended to mimic real or idealised controls, it is important to comprehend and assess the Table 3
Electrical and thermal supply technologies and district heating.
Tools Electrical supply Thermal supply District heating
Biomass decision support tool No FBo Yes
COMPOSE B, C, CHP, G, Gr, PV, Wi CHP, EBo, FBo, HP, ST No
DER-CAM CHP, D, G, Gr, PV, Wi CHP, EBo, FBo, Geo, HP, ST No
EnergyPLAN B, C, CHP, D, G, Geo, Gr, GrS, H, N, PP, PV, T, Wa, Wi CHP, EBo, FBo, Geo, HP, I, ST, Was Yes
EnergyPRO B, C, CHP, D, G, Gr, H, PV, Wi CHP, EBo, FBo, HP, ST Yes
eTransport CHP, Gr, PP CHP, FBo, HP Yes
H2RES B, C, D, G, GrS, H, PV, Wa, Wi, EBo, FBo No
HOMER B, C, CHP, D, G, Gr, H, PV, Wi CHP, FBo No
Hybrid2 D, PV, Wi None No
iHOGA D, G, Gr, H, PV, Wi None No
MARKAL/TIMES B, C, CHP, D, G, Geo, Gr, GrS, H, N, PP, PV, T, Wa, Wi CHP, EBo, FBo, Geo, HP, I, ST, Was No
Merit C, CHP, G, GrS, PV, Wi, CHP, HP, ST No
SimREN Geo, H, PP PV, Wi CHP No
Key:
Electrical: Biomass power plant (B); Coal power plant (C); Combined heat and power plant (CHP); Diesel plant (D); Gas plant (G); Geothermal plant (Geo); Grid (Gr); Grid simple (GrS); Hydro (H); Nuclear (N); Generic power plant (PP), Photovoltaic (PV); Tidal (T); Wave (Wa); Wind (Wi).
Thermal: Combined heat and power (CHP); Electric boiler (EBo); Fuel boiler (FBo); Geothermal (Geo); Heat pump (HP); Industrial surplus (I); Solar thermal (ST); Waste incineration (Was).
Table 4
Design optimisation, outputs, controls and DSM controls capabilities.
Tools Design optimisation Outputs Controls DSM control
Biomass decision support tool S E, EP, FA, FC, RP, SA FO, NO FO
COMPOSE E, F E, EP, FA, FC, SA MO, OO (F) OO (F)
DER-CAM E, F A, E, EP, FA, FC, SA DC, EV, LS, MO, OO (F, E) DC, EV, LS, OO (F, E)
EnergyPLAN No E, EP, FA, FC, SA, RP FO, LS, MO, OO (F) FO, LS, OO (F)
EnergyPRO No E, EMI, EP, FA, FC, SA EV, MO, NO, OO (F), UO EV, OO (F)
eTransport F E, EMI, EP, FA, FC, SA MO, OO (F) OO (F)
H2RES No EP, FC, RP, SA FO, MO FO
HOMER F A, E, EP, FA, FC, RP, SA, AC, LS, MO, NO, OO (F),
UO
LS, OO (F)
Hybrid2 No EP, FA, SA FO, LS, MO, NO FO, LS
iHOGA Single: F Double or triple: combination of A, E, F, HDI, JC, NPC
A, E, EP, FA, FC, HDI, JC, RP, SA
FO, MO, NO, OO (F) FO, OO (F)
MARKAL/TIMES F E, EMI, EP, FA, FC, RP, SA, MO, NO, OO (F) OO (F)
Merit No EP, FC, M, SA FO, LS, MO FO, LS
SimREN No EMI, EP, SA – –
Key:
Design Optimisation: Autonomy (A); Emissions (E); Financial (F); Human development index (HDI); Job creation (JC); System (S).
Outputs: Autonomy (A); Emissions (E); Energy market interaction (EMI); Energy production (EP); Financial analysis (FA); Fuel consumption (FC); Human development index (HDI); Job creation (JC); Demands/supply match (M); Renewable penetration (RP); System analysis (SA).
[image:6.595.36.564.535.691.2]control regime underpinning each of the models. Key capabilities of the 13 tools are captured inTable 4and further discussed below. 3.4.1. General control capabilities
Controls regulate how supply, storage and DSM technologies meet loads by determining the control logic and constraints applied. A simple community scale system control strategy can include: (i) an order of dispatch for the different resources, and (ii) a set of constraints. 3.4.1.1. Operational optimisation. Operational Optimisation (OO) control is where the tool optimises, at each time step, the order of dispatch of supply, storage, and DSM technologies to satisfy an objective function which may relate to cost, emissions, etc. There are differences in detailed logical implementation between tools; a general description is given here.
Most tools use the OO control chronologically i.e. calculations are performed at each individual time step to establish an optimum based on prevailing conditions at that time step only, before the next time step is then considered. Storage is generally charged and discharged when it is deemed favourable to do so according to the specific logical im-plementation and objective function. Typically charging will occur when there is excess energy from renewable or non-modulating supply where storage is deemed to have benefit over export or curtailment, or where grid parameters, e.g. tariff, make charging from grid advanta-geous. Discharge from available storage is generally treated as a dis-patchable supply option. The value attached to storage charge and discharge takes account of characteristics of the storage system, e.g. efficiencies and costs, plus parameters such as tariffs and carbon con-tents. For example, in HOMER the discharge energy cost includes average charge energy cost, efficiencies, and battery wear, lifetime and replacement costs.
OO control is applied non-chronologically in some tools e.g. in EnergyPRO the whole calculation period is scanned for energy supply costs and an optimised supply schedule determined, with excess low cost generation charging storage and discharge occurring to meet de-mand in subsequent favourable high cost time steps. These OO control functionalities may replicate real control systems for situations where local renewable consumption is prioritised or where a set tariff struc-ture is established for energy import and export; the non-chronological OO implementation may in some circumstances provide a somewhat optimistic view of system performance as perfect foresight is implied.
3.4.1.2. Fixed order. Fixed Order (FO) control is where there is an available set of functions with pre-defined order of dispatch of supply, and fixed conditions for the use of storage and DSM technologies. Dispatchable supply is dispatched in afixed order in periods where non-dispatchable, typically renewable, supply is below demand. EnergyPLAN, H2RES, and Merit charge electrical storage in periods of excess renewable production and prioritise discharge from electrical storage over generators and power plants. In Merit thermal storage discharge is prioritised over other thermal supply options. In EnergyPLAN thermal storage charging is prioritised to absorb excess electricity or heat production and discharged to avoid non-renewable generation. In iHOGA batteries can charge/discharge at fixed, user input tariff values. In the Biomass decision support tool excess heat from the biomass boiler is stored in a thermal storage and discharged when demand exceeds supply. EnergyPLAN includes several selectable functions for dealing with excess electricity production. Hybrid2 contains embedded functionality for 13 pre-defined fixed order controls relating to the practical performance of electric systems (Manwell et al., 2006).
3.4.1.3. User-defined order. User-defined Order (UO) control is where the order of dispatch, for at least some part of the supply, is defined by the user. For example, UO in EnergyPRO requires all supply options to be given an order of preference, which can also include separate
priorities for production to satisfy different (peak, high, low) loads; storage priority setting is not an option and in this tool storage operation always follows the OO control strategy.
3.4.1.4. Modulating output. Modulating output (MO) control applied to a dispatchable supply allows modulation of output to match load above some minimum supply output level. In all tools the grid connection, if enabled, can modulate output to follow electrical load with a minimum supply level of zero. HOMER can only designate grid or generator supplies to this control while in EnergyPRO, DER-CAM, and eTransport any dispatchable supply can be assigned.
3.4.1.5. Non-modulating output. Non-modulating output (NO) control sets the constraint that a designated supply must run at afixed output whenever it is running. In the Biomass decision support tool, the designated supply is the biomass boiler. In EnergyPRO the user selects supplies. In iHOGA and HOMER the designated supplies are the generators. In these two tools a set state of charge for storage can be specified and the designated supply will continue operating, regardless of availability of renewable generation, until the set point is reached. This mimics a common feature in real systems used to maximise battery life but which reduces the potential for renewable inputs to the store.
3.4.1.6. Advanced control. HOMER offers the capability to use Advanced Control (AC) strategies where users can define more complex control operating regimes than those previously outlined by interfacing with externally written code in MATLAB (HOMER Energy, 2017a).
3.4.2. DSM related control capabilities
The general control modelling capabilities described in the previous section, such as OO and FO, can be used where there is storage in the system to capture DSM functionality associated with storage charging and discharging. Several tools have further DSM specific functionality to represent ‘Load Shifting’, ‘Demand Curtailment’ and ‘Electrical Vehicles’in the system. All DSM related control capabilities are cap-tured in the‘DSM control’column ofTable 4, the further DSM specific functionalities are described below.
3.4.2.1. Load shifting. Load shifting (LS) is where a flexible load is defined which can be met or deferred to a later time step within a limited deferrable time period, while incurring no loss. Theflexible load can be input as a specific energy quantity over the deferrable period in EnergyPLAN which uses 1 day, 1 week, or 4 weeks deferrable periods, and in Hybrid2 which allows users to input the deferrable period. In DER-CAM theflexible load is sized as a percentage of the main load over a 1 day deferrable period. Theflexible loads in these tools are actuated when lowest cost or surplus energy is available within theflexibility period. HOMER and Hybrid2 can accommodate more detailed model parameters such as: average deferrable load (kWh/day), capacity (kWh), peak load (kW), and minimum load ratio,flexible load in these tools is treated as secondary to the main load but prioritised over charging storage.
3.4.2.2. Demand curtailment. Demand curtailment (DC) is where demand can be curtailed under certain conditions, and, unlike load shifting, is not shifted but reduced. DER-CAM is the only reviewed tool capable of modelling DC and curtails demand when tariffprices exceed a user defined curtailment cost (£/kWh) within an annual maximum number of curtailment hours. There is also additional functionality to allow for up to 5 daily hourly profiles capturing the proportions of the main load which can be curtailed at each time step.
system flexibility they can provide (García-Villalobos, Zamora, San Martín, Junquera, & Eguía, 2015;Navigant Research, 2017). Only two of the identified tools include models for an electric vehicle to grid interaction. EnergyPRO has a model based on the energetic capacity of the batteries in the cars, and limits on the charging and discharging along with associated efficiencies. The demand for the vehicles is input as a time series and there are options accounting for availability. Charging/discharging can be set to on/offwith charging allowed at zero demand, it can be set to proportional to the driving demand time series, or it can be set its own time series. EnergyPLAN contains a similar model. The inputs are for maximum discharge/charge, capacity of batteries in vehicles, efficiencies, and a time series for demand. Simpler assumptions are made on the availability, with the fraction of cars driving at peak demand and of cars parked used to calculate the connection of cars to grid.
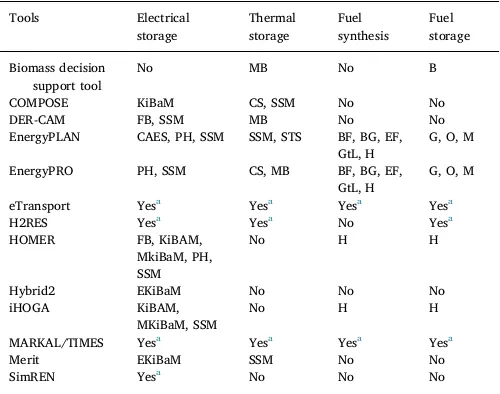
3.5. Storage modelling capabilities and underlying models
This section looks at relevant capabilities of the 13 screened tools and underlying models with respect to storage functionality. Such functionality enables DSM and, in the reviewed tools, is used with the operational optimisation andfixed order controls (see Section3.4.1).
Storage capabilities are captured in two look up tables for use in tool selection.Table 5describes the range of storage modelling capabilities available in each tool, with more detailed descriptions of these cap-abilities in the sub-sections below.Table 6gives a summary of the more advanced models i.e. more detailed models than the simple storage model (SSM) for each storage technology; SSM can be used to model all storage types and is not included inTable 6 for this reason. A brief summary of each capability and underlying model is given below, further details including model equations can be found in the relevant References
3.5.1. Electrical storage modelling capabilities and underlying models Electrical storage is a general term used here to include electro-chemical (li-ion, flow, lead-acid batteries), electromagnetic (super-capacitors), and mechanical (CAES, hydro,flywheels) forms. Electrical storage can be represented using a number of different mathematical models, the different models used in the tools are categorised and scribed below. The level of detail required at the planning stage de-pends on the specifics of the system being modelled and the outputs to be derived from the modelling.
3.5.1.1. Simple storage model. A tool possessing a Simple Storage Model (SSM), which can interact with supply and load, can model any storage technology. EnergyPLAN and EnergyPRO use the SSM to define all types of storage, including all electrical storage types. iHOGA, DER-CAM and HOMER support the use of the SSM, e.g. for high-performance batteries (Lambert et al., 2006). HOMER also recommends its use for simple pumped hydro storage systems. The SSM consists of a simple energy in/out balance via an energy store. Energy can enter the store below a threshold maximum charging rate up to a maximum store capacity. There can be self-discharge from the store e.g. a percentage or other function at each time step. Energy can leave the store below a threshold maximum discharging rate. For charging and discharging there are associated efficiencies, which combine with self-discharge to give a round-trip efficiency. Charge and discharge efficiencies are both generally fixed values. The SSM has fixed maximum charge and discharge rates independent of the state of the system, this approximation may be sufficient for some analyses, but may not be realistic in other cases, more detailed models are available. Storage lifecycle analysis is included in some tools with the SSM, e.g. in HOMER lifetime is modelled as both an energy throughput and time, however performance degradation effects are only included in the MKiBaM model described later.
[image:8.595.305.559.80.184.2]3.5.1.2. Kinetic battery model. The Kinetic Battery Model (KiBaM) was first developed for modelling lead-acid batteries in hybrid energy systems (Manwell & McGowan, 1993). It is described as a two tank model (HOMER Energy, 2016), where one tank holds the available energy to directly support charge and discharge and the other holds the bound energy which transfers energy to and from the available tank according to a defined exchange function representing the chemical process. The model supports charge/discharge rates as functions of stored energy in the two tanks. The underpinning electronic mechanisms are still somewhat simplified with voltage modelled only as a linear function of energetic state etc. iHOGA and HOMER both possess this model and have libraries of electrochemical batteries with parameters established from test data.
Table 5
Storage modelling capabilities and underlying models.
Tools Electrical storage
Thermal storage
Fuel synthesis
Fuel storage
Biomass decision support tool
No MB No B
COMPOSE KiBaM CS, SSM No No
DER-CAM FB, SSM MB No No
EnergyPLAN CAES, PH, SSM SSM, STS BF, BG, EF, GtL, H
G, O, M
EnergyPRO PH, SSM CS, MB BF, BG, EF, GtL, H
G, O, M
eTransport Yesa Yesa Yesa Yesa
H2RES Yesa Yesa No Yesa
HOMER FB, KiBAM,
MkiBaM, PH, SSM
No H H
Hybrid2 EKiBaM No No No
iHOGA KiBAM,
MKiBaM, SSM
No H H
MARKAL/TIMES Yesa Yesa Yesa Yesa
Merit EKiBaM SSM No No
SimREN Yesa No No No
Key:
Electrical: Compressed air energy storage model (CAES); Extended kinetic battery model (EKiBaM); Flow battery model (FB); Kinetic battery model (KiBaM); Modified kinetic battery model (MKiBaM); Pumped hydro model (PH); Simple storage model (SSM). Thermal: Cold storage model (CS); Moving boundary model (MB); Seasonal thermal storage model (STS); Simple storage model (SSM).
Fuel synthesis: Biofuel (BF); Biogas (BG); Electrofuel (EF); Gas to liquid (GtL); Hydrogen (H).
Fuel storage: Biomass (B); Gas (G); Hydrogen (H); Methanol (M); Oil (O).
aindicates that the tool has a certain capability but specific models used were not able
[image:8.595.39.289.438.635.2]to be confirmed; these tools were assumed to have SSM as minimum electrical and thermal storage models.
Table 6
Electrical and thermal storage technologies and advanced models (beyond SSM).
Electrical storage (ES) type
Advanced ES models used
Thermal storage (TS) type
Advanced TS models used
Lead-acid battery EKiBaM, KiBaM, MKiBaM
Hot water tank MB
Li-ion battery EKiBaM, KiBaM, MKiBaM
Cold storage CS
Flow battery FB Seasonal thermal storage
STS
Pumped hydro PH
CAES CAES
Key:
Electrical: Compressed air energy storage model (CAES); Extended kinetic battery model (EKiBaM); Flow battery model (FB); Kinetic battery model (KiBaM); Modified kinetic battery model (MKiBaM); Pumped hydro model (PH); Simple storage model (SSM). Thermal: Cold storage model (CS); Moving boundary model (MB); Seasonal thermal storage model (STS); Simple storage model (SSM).
3.5.1.3. Extended kinetic battery model. Work was done to improve the KiBaM in terms of modelling voltage behaviour (Manwell & McGowan, 1994). These models are denoted here as Extended Kinetic Battery Models (EKiBaM). Hybrid2 includes such an improved model (Manwell, McGowan, Abdulwahid, & Wu, 2005), with voltage, charging and discharging efficiencies and current as non-linear functions of the state of charge. Merit also contains a different but similar model with improved voltage modelling (Born, 2001).
3.5.1.4. Modified kinetic battery Model. A further Modified Kinetic Battery Model (MKiBaM) is used by HOMER and iHOGA to give deeper insights. This includes a thermal model component whereby the resistive properties of the battery produce heat which affects temperature, capacity and lifetime. Secondly, it involves cycle-by cycle degradation of the battery as a function of depth of discharge; this is accounted for using the Rainflow counting algorithm (Downing & Socie, 1982), which iHOGA also further utilises to account for corrosion effects over time. iHOGA offers customised models for lead-acid batteries (Copetti & Chenlo, 1994; Schiffer et al., 2007) and Li-ion batteries (Groot, Swierczynski, Irina, & Knudsen, 2015; Saxena, Hendricks, & Pecht, 2016;Wang et al., 2011).
3.5.1.5. Flow battery model. Flow batteries can also be modelled explicitly with models which account for the independence between capacity and charge/discharge and otherflow cell characteristics. Flow battery specific models based on manufacturers data are included in DER-CAM (Stadler, Marnay, Siddiqui, Lai, & Aki, 2009) and HOMER (HOMER Energy, 2016).
3.5.1.6. Pumped hydro model. Pumped hydro is often modelled using the SSM by factoring in the capacity and efficiency of the pump and generator as well as the capacity of the reservoir. EnergyPLAN and HOMER include pumped hydro as a technology using the SSM. Only EnergyPRO includes an explicit pumped hydro model and includes inputs such as reservoir volume, friction factors and head difference.
3.5.1.7. Compressed air energy storage model. A simple compressed air energy specific storage model (CAES) is included in EnergyPLAN, with a focus on the economic trading possible (Lund & Salgi, 2009). 3.5.2. Thermal storage modelling capabilities and underlying models
Thermal storage allows for sensible or latent heat to be kept for meeting a demand later. It can include hot water tanks, brick radiator stores, phase change storage materials, and cold storages. It can also be designed for buildings or community scales. A summary of different thermal storage models including underlying equations is given by (Dumont et al., 2016). The tools that are the focus of this paper use only the least complex models, some of the limitations associated with this are discussed later. The categorisation of thermal storage models found in the tools is captured inTables 5 and 6and described below. 3.5.2.1. Simple storage model. The SSM model does not consider temperatures but only accounts for energy, and was described earlier in Section 3.5.1.1. EnergyPLAN uses the SSM to model all thermal storage technologies.
3.5.2.2. Moving boundary model. The most common model for thermal storage in the examined tools is the moving boundary model (MB), where the additional inputs over the SSM are top and bottom tank temperatures. It assumes that there is no mixing between the upper hot zone and the lower cold zone and the thermocline boundary layer is infinitesimally small. This is again an energy balance model with inflows and outflows of energy moving the boundary layer up and down the store and stored energy calculated based on the thermocline position. The model does not explicitly capture temperature variation due to losses and destratification. This model is incorporated in the
Biomass decision support tool, DER-CAM, EnergyPRO, and Merit. The model can be adjusted in EnergyPRO using a utilisation factor which reduces the useful energy which can be used for supply. DER-CAM allows for different high temperature and low temperature stores within the system to allow for different heat generation devices (Steen et al., 2015). EnergyPRO also uses the MB model for cold storage (CS) and was the only tool identified to have electrical, heat, and cold storage modelling capability.
3.5.2.3. Seasonal thermal storage model. A seasonal thermal storage model is included in EnergyPLAN. It is simplified and only two inputs are required: capacity, and‘days of optimising storage’which allows for the model to identify inter-seasonal variations in demand. (Allegrini et al., 2015) set out the state of art in modelling seasonal thermal storage in building-scale simulation tools, but in general this functionality is not supported in the tools analysed here apart from EnergyPLAN.
3.5.2.4. Other thermal storage models. Temperature variations, and therefore entropy considerations, are vital in real thermal storage analysis (Bejan, 1978). There may appear to be enough energy in a tank to meet the energy demand, but if the temperature does not meet the supply requirement it is not useful energy. The MB model does not account for changes in the temperature zones; there are no entropic considerations. The (Dumont et al., 2016) summary of modelling approaches for sensible thermal storage tanks includes the MB model and highlights the models which would be used to include entropy, with increasing detail at the expense of computational and data input complexities.
3.5.3. Modelling of fuel synthesis and storage
Fuel synthesis is the production of fuels within a system creating a new energy vector which can be used across a range of energy sectors, and acts as storage to be used later (Ridjan, Mathiesen, Connolly, & Duić, 2013). EnergyPLAN, iHOGA and HOMER can model the synthesis of hydrogen. This is produced using electricity with an electrolyser to form hydrogen, stored in a hydrogen tank, and then converted to meet transport, heat, or electricity demands. All three technical components can be modelled within the three tools. EnergyPRO contains a simple model for the synthesis of any fuel. EnergyPLAN allows for synthesis of different types of fuel: biofuel, biogas, hydrogen from electrolysis, electrofuel, and gasification to liquid transport fuel. These fuels are used to form interactions between energy sectors, and ensure high-value energy is used for high-high-value processes.
These fuels must then be kept in storage. The Biomass decision support tool can size biomass fuel storage, while iHOGA and HOMER can model hydrogen storage tanks. EnergyPLAN can model gas, oil and methanol storages, and EnergyPRO can model any fuel storage as a generic model.
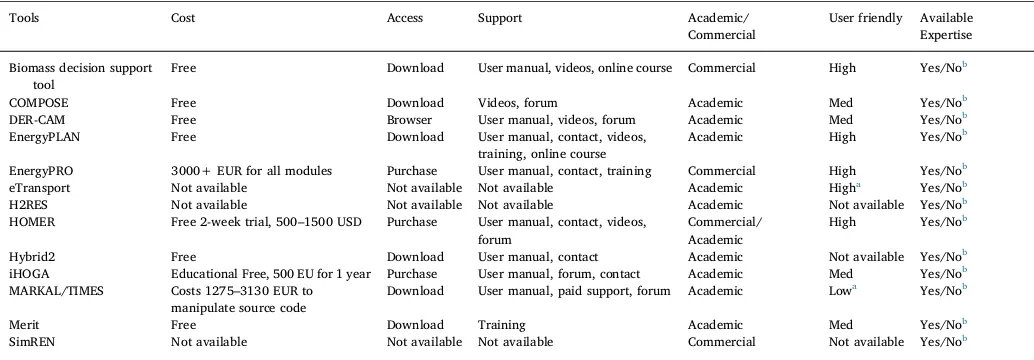
3.6. Practical considerations
This table sets out practical considerations associated with selecting a tool: cost, access, support, whether it is academic or commercial, user-friendliness, and whether there is existing available expertise.
Cost may be a vital factor in choosing an energy system tool and depends on the resources available to a user. A student is likely to choose a free tool which there is abundance of: Biomass decision sup-port tool, COMPOSE, DER-CAM, EnergyPLAN, iHOGA, Hybrid2, Merit and MODEST. Often tools are available at discounted prices for stu-dents. A government agency or an engineering consultancy may have the resources available to afford the cost for a tool such as 3000+ EUR for EnergyPRO, 500–1500 USD for HOMER, or 1275–3130 EUR to manipulate the code for MARKAL/TIMES.
support as indicated by tool websites and verified by the authors is listed, and includes: user manual, available contact details, videos, training, and an online forum. The tools are classed as academic or commercial based on the development and ownership of the tools through either a university/research group, or a private company, re-spectively.
User friendliness was judged on the provision of an intuitive model-building pathway which was subjectively graded by the authors at a low, medium, or high level. This requiredfirst-hand knowledge of the tools so where the tool was not available to the authors, the grade by (van Beuzekom et al., 2015) was referenced.
Most modelling tools require a significant investment in time to develop expertise in order to be used correctly and proficiently so there will be a strong practical driver to use a modelling tool which has es-tablished available expertise if this exists. If there is no eses-tablished expertise available and the aim is to develop such an expertise then this driver will be less strong or zero.
4. Tool selection process
A stepwise tool selection process was developed to aid in the identification of an appropriate tool for a particular analysis for plan-ning-level design of a community energy system incorporating storage and DSM, based on the process of Sandia National Laboratories (Lin et al., 2007).
4.1. Determination of requirements
Thefirst process step is to establish which of the modelling tool capabilities (documented inTables 2–7) are ‘essential’, ‘desirable’or
‘not applicable’and to assign values of 2, 1, and 0 respectively to each
of these tool capabilities. This process requires that each of the cap-abilities described in the column headings and associated keys of the tables are individually considered against the requirements for the in-tended analysis. For example if we look atTable 2then the three tool capabilities captured are‘demand profile generator’,‘resource assessor’,
and‘supply profile generator’; if the user requires the tool to provide
demand profiles, weather data and renewable generation supply pro-files from simple input data such as location and demographics then these capabilities would be considered essential and each of these capabilities would be assigned a value of 2; alternatively if the user has available data for demand, weather and renewable generation and supply (e.g. from monitored data) then these capabilities are not
applicable so would be assigned a value of 0 and can be eliminated from further consideration; if the user can potentially source information and generate the demand, weather and renewable generation input data but this would be significant effort then this capability could be ranked as desirable and allocated a value of 1. Similarly, if we considerTable 3it may be that it is essential that there is capability to model electrical generation with both PV and wind so each of these capabilities would be allocated a 2 while if there is no potential for hydro then this cap-ability would be allocated a 0. When this process is complete the es-sential and desirable capability requirements have been established. Thefirst 4 rows ofTable 8illustrate this process for a simple case study example which will be described in more detail in the following section.
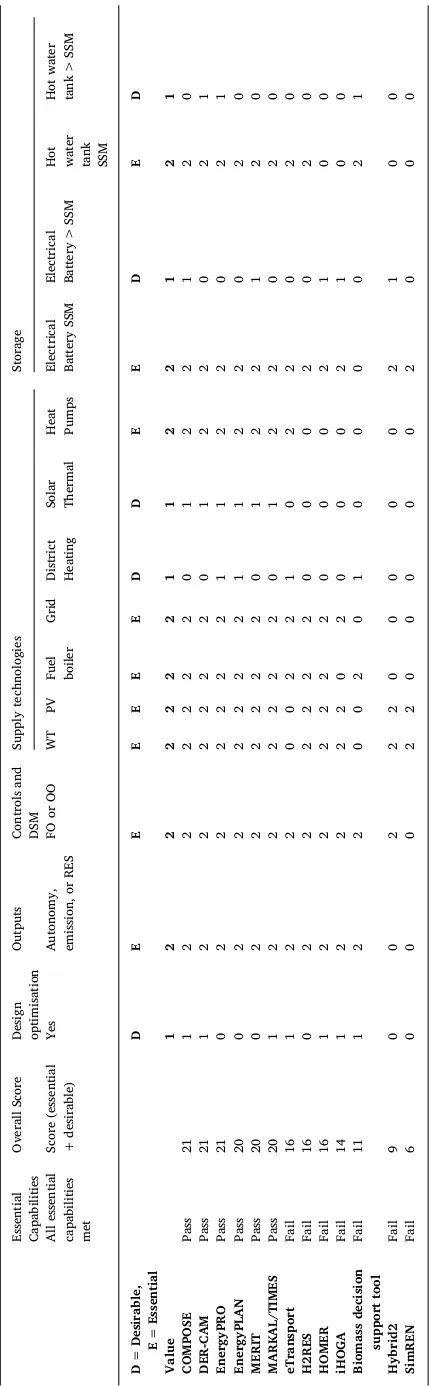
4.2. Scoring of tools against requirements
Once the requirements have been established then each of the tools can be scored against them. Thefirst consideration is whether all the essential capabilities are available, if a given modelling tool has all the essential capabilities it can be considered further, those which do not pass this check can be discounted. For the tools which pass, their scores for the essential plus desirable capabilities are summed into an overall score and ranked with the most suitable tools having the highest scores. Again,Table 8illustrates this process for the simple case study which is described in more detail in the following section.
4.3. Example application of the modelling tool selection process
Findhorn is an ecovillage in the north-east of Scotland with an ambition to transition to a local, low-carbon energy system. It consists of around 75 buildings, with a private wire electrical network, wind and solar generation, a grid connection, micro-district heating from biomass, and individual household heat pumps and solar thermal sys-tems. The community could be said to be net zero carbon but has large electricity surpluses and shortfalls due to stochastic demands and re-newable production. The community have an interest in the use of thermal and electrical storage with advanced controls as a potential route to achieving their aims. The community had previously been monitored as a research and demonstration site for advanced DSM (Tuohy et al., 2015).
[image:10.595.39.556.545.725.2]The community overall objective is to increase their energy au-tonomy and use of local renewable energy resources; they have some concerns over the sustainability of biomass. To help achieve their ob-jective they enlisted support from a University and after an initial
Table 7
Practical considerations.
Tools Cost Access Support Academic/
Commercial
User friendly Available Expertise
Biomass decision support tool
Free Download User manual, videos, online course Commercial High Yes/Nob
COMPOSE Free Download Videos, forum Academic Med Yes/Nob
DER-CAM Free Browser User manual, videos, forum Academic Med Yes/Nob
EnergyPLAN Free Download User manual, contact, videos, training, online course
Academic High Yes/Nob
EnergyPRO 3000+ EUR for all modules Purchase User manual, contact, training Commercial High Yes/Nob
eTransport Not available Not available Not available Academic Higha Yes/Nob
H2RES Not available Not available Not available Academic Not available Yes/Nob
HOMER Free 2-week trial, 500–1500 USD Purchase User manual, contact, videos, forum
Commercial/ Academic
High Yes/Nob
Hybrid2 Free Download User manual, contact Academic Not available Yes/Nob
iHOGA Educational Free, 500 EU for 1 year Purchase User manual, forum, contact Academic Med Yes/Nob MARKAL/TIMES Costs 1275–3130 EUR to
manipulate source code
Download User manual, paid support, forum Academic Lowa Yes/Nob
Merit Free Download Training Academic Med Yes/Nob
SimREN Not available Not available Not available Commercial Not available Yes/Nob
scoping process identified two initial future illustrative scenarios to be investigated: 1) increased electrical generation plus battery storage, and 2) increased electrical generation plus heat pumps and large hot water tanks replacing the micro-district biomass heat source. The modelling tool selection process was then applied in order to identify suitable software to use for the investigation.
The first step was to review the tool capability requirements: Demand profile generator, Resource assessor, and supply profile mod-eller capabilities (Table 2) were all deemed to have zero value (i.e. not applicable) since multi-year sub-hourly data was readily available from monitoring.
Electrical supply technologies wind, grid, and solar PV were deemed to be essential (Table 3). Thermal supply modelling of fuel boiler (biomass fuel in this case) and heat pumps were deemed essential. Capability to model solar thermal and district heating in detail were scored desirable but not essential at this stage as the primary focus was on the electrical supply system and the available monitoring data in-cluded heat delivery from existing heat production units, net of solar inputs, and distribution losses.
Design optimisation capability (Table 4) was deemed desirable but not essential as the view was taken that the relatively simple range of options to be investigated could be covered through a full factorial deterministic investigation and modelling outputs analysed outside of the tool to establish potential optima. The output of hourly data al-lowing autonomy, emissions, or renewable penetration to be estab-lished was deemed essential, this level of system performance para-meter output would then allow the other required outputs to be calculated outside of the tool.
For control capabilities (Table 4) either FO or OO control was deemed essential to support the required ordering of dispatch of supply and storage, in addition to the MO control inherent in all the tools for representing the grid. DSM specific control functionality was not re-quired in this example.
Storage modelling capability was deemed essential for both elec-trical and thermal storage (Tables 5 and 6). It was deemed that the simple storage model was sufficient but that it would be desirable for more complex models to be available. Fuel synthesis and fuel storage are not required in this simple illustrative study.
[image:11.595.63.278.52.745.2]These technical requirements are captured (in the top 4 rows of Table 8) and then each of the tools assessed against these requirements, where a tool has an essential or desirable capability then it scores 2 or 1 respectively against that capability, otherwise it scores 0. Once all the potentially capable tools have been assessed they are ranked: (i)first the tools which do not have all the essential are deemed to‘fail’to meet the essential requirements and discounted and only those that‘Pass’this test considered further, (ii) the remaining tools are then ranked based on their cumulative score. This process is illustrated inTable 8, with the result in this case that 6 tools are capable with similar scores of either 20 or 21.
This example has been kept relatively simple for reasons of clarity and brevity; more complex situations would follow the same process.
5. Discussion
Through the categorisation and documentation of tool capabilities it is apparent that there are many differences between tools. Some tools, such as EnergyPLAN, combine all energy sectors based on the view that holistic consideration across sectors leads to optimal solutions. Other tools are primarily single domain focussed, e.g. iHOGA has strong capabilities for electrical analysis with a wide range of storage models but no thermal capability.
Design optimisation capabilities in the tools generally optimise for financial or technical considerations. Only iHOGA optimises for human considerations (human development index, job creation) and two tools optimise for environmental considerations. Much work has been done on external optimisation used in a two-step process. This may influence
Table 8 Output from application of tool selection process. Essential Capabilities Overall Score Design optimisation Outputs Controls and DSM Supply technologies Storage All essential capabilities met Score (essential + desirable) Yes Autonomy, emission, or RES FO or OO WT PV Fuel boiler Grid District Heating Solar Thermal Heat Pumps Electrical Battery SSM Electrical Battery > SSM
Hot water tank SSM
Hot water tank > SSM D =
Desirable, E=