Ocean Dynamics (2006) 56: 228–234 DOI 10.1007/s10236-005-0049-7
Hennie Henriët van der Veen .
Suzanne Jacqueline Marie Hélène Hulscher . Michiel Adrianus Frederik Knaapen
Grain size dependency in the occurrence of sand waves
Received: 1 March 2005 / Accepted: 23 November 2005 / Published online: 3 January 2006 #Springer-Verlag 2006
Abstract Sandy shallow seas, like the North Sea, are very dynamic. Several morphological features are present on the bed, from small ripples to sand waves and large tidal sand-banks. The larger patterns induce significant depth variations that have an impact on human activities taking place in this area. Therefore, it is important to know where these large-scale features occur, what their natural behaviour is and how they interact with human activities. Here, we extend earlier research that compares the results of an idealized model of large-scale seabed patterns with data of seabed patterns in the North Sea. The idealized model is extended with a grain size dependency. The adaptations lead to more accurate predic-tions of the occurrence of large-scale bed forms in the North Sea. Therefore, grain size dependency and, in particular, critical shear stress are important to explain the occurrence of sand waves and sandbanks in the North Sea.
Keywords Sand waves . North Sea . GIS . Grain size
Introduction
Shelf seas are very important areas; they are biologically highly active and provide most of the worlds main fisheries. Often, the seabed contains high concentrations of oil and gas supplies, and most shelf seas are very busy shipping areas. In most shelf seas, sediment is widely abundant and is shaped into a range of bed forms, because in these areas, the largest
part of the tidal and wave energy is dissipated. The smallest of these forms are ripples and somewhat larger are mega-ripples. Here, we focus on the large-scale offshore bed forms: sand waves and sandbanks (see Fig.1).
The spacing of sand waves varies between 100 and 800 m; they can be up to 10 m high and their crests are aligned almost perpendicular to the direction of the main tidal flow. Sand waves can be active and migrate with speeds up to 5 m per year (Németh et al.2002). Tidal sandbanks have a spac-ing of about 5 km. Their height can be up to 40 m to a few metres below the water surface and their crests are aligned at a small angle with respect to the direction of the main tidal current.
The North Sea is a shallow shelf sea. The tides in the Southern part are semi-diurnal, and the tidal amplitudes range from 2.4 m in the Strait of Dover to 0.6 m more to the North. At springtide, the flow velocities at the surface vary from 1.4 m/s in the western and southern part to 0.7 m/s along the Dutch coast and the northern part. The seabed consists mainly of fine to medium sands, ranging from 125 to 500μm, but at some places, in the Strait of Dover and in front of the coast of East Anglia (UK), patches of gravel have been observed (Van der Molen2002). On the seabed, a variety of large-scale bed forms, such as sandbanks and sand waves, are present.
Bed forms interact with human activities, as the North Sea is intensively used for different purposes. User functions that are affected by the large-scale morphology are navigation, telecommunication cables, oil and gas transportation (pipe-lines), oil and gas mining, sand extraction, artificial islands and offshore wind parks. For safety reasons, it is important to know where the bed forms occur, what their natural behav-iour is and how they interact with human activities.
Here, we predict the occurrence of large-scale bed forms in the southern part of the North Sea using an idealized model of Hulscher (1996) and compare the predictions for sand waves with observations. Hulscher and van den Brink (2001) were the first to compare the model of Hulscher (1996) against observations of sand wave occurrence in the North Sea. In Hulscher and van den Brink (2001), the spatial variation of sediment characteristics is not accounted for. Responsible editor: Alejandro Souza
H. H. van der Veen (*) .S. J. M. H. Hulscher
Water Engineering & Management, University of Twente, P.O. Box 217, 7500AE, Enschede, The Netherlands e-mail: [email protected]
M. A. F. Knaapen
Furthermore, effects of critical stress were neglected, so even at very low tidal velocities bed pattern formation was allowed. Belderson (1986) showed (Fig.2) that the magnitude of tidal currents and the occurrence of sand waves are related. This supports the idea that a critical threshold has to be exceeded before sand waves will form.
In the present research, we include the aforementioned effects of spatial variations of sediment characteristics and
critical stress. All data were gathered in a Geographical In-formation System (ARCGIS). A GIS is a digital map with extended capabilities to manipulate and analyse geographi-cal data (Heywood et al.1998). Within this GIS, the new results are compared to observations of sand waves in the North Sea.
In Section2, the theoretical bed pattern model, the effects of inclusion of grain size dependency and the GIS are dis-cussed. The results and comparison with observations and with earlier predictions without grain size influence can be found in Section 3. Section 4 contains the discussion and Section5presents the conclusions.
The bed pattern model
The theoretical model to predict large-scale bed forms
The three-dimensional model of Hulscher (1996) explains how tidal currents form rhythmic bed patterns in sandy beds. The model is based on the three-dimensional shallow water equations, applied to a tidal flow. An empirical bed load transport, which includes slope effects, models the sediment transport, and the bed level changes are calculated using the sediment balance. In Hulscher (1996), tide and seabed are regarded as a coupled system. The bed patterns are assumed to be free instabilities of this system. A linear stability anal-ysis is performed to study pattern dynamics, which means that only small amplitude perturbations are considered. The model calculates growth rates for every wavelength and orientation, which characterize the spatial structure of the pattern. If all growth rates are negative, all bed patterns are damped and so a flat bed is stable. In this research, we define a flat bed as a bed where no large-scale bed forms occur. However, if at least one bed pattern has a positive growth rate, the situation with the flat bed is unstable and a wavy bed pattern occurs. The wavelength with the fastest growing mode is considered to represent the occurring bed form (Fig.3).
From the rather sophisticated model of Hulscher (1996), a large-scale bed form prediction model was developed. This prediction model uses the parameters water depth, flow ve-locity and sediment grain size to give location-specific pre-dictions for the type of bed form that occurs at a certain location in the southern North Sea (Fig.4).
The values of the resistance parameter (Ŝ) and the Stokes number (Ev) are estimated by fitting the partial slip model used in Hulscher (1996) to a more realistic turbulence model including a no-slip condition at the bed and a parabolic eddy viscosity (Hulscher and Roelvink1997), which leads to the following expressions:
Eν ¼ 3πu
4Hσ
κ
2BA
b S¼ 3πu
4Hσ
κ
2BA ABð 1=3Þ Fig. 1 Sand bank (lines) and sand wave (brown areas) occurrence
in the North Sea
[image:2.595.49.294.49.278.2] [image:2.595.47.435.420.709.2]where:
A¼
ln H
z0
1
"þ
1" " ln
1"
1"z0
H
þ"1
"2 lnð1"Þ
B¼32"
6
wherein к is the Von Karman constant, u is the depth-averaged flow velocity, His the local mean depth,σis the tidal frequency, z0 is the level of zero-intercept (the level above the seabed, where the flow velocity is zero) andɛis the viscosity variation parameter (which denotes the influence of waves). In the case of a moderate resistance (smallŜ and largeEv), the Stokes boundary layer is much larger than the water depth and the vertical shear in the horizontal velocities is small. Then the flow resembles the depth-averaged flow in the sandbank model of Hulscher (1996).
Hulscher and van den Brink (2001) tested the model of Hulscher (1996) against observations of sand wave occur-rence on the North Sea basin scale. Figure 5 shows the predictions of Hulscher and van den Brink (2001). They conclude that for the southern part of the North Sea the parameter that denote the level of zero intercept (z0) and the
viscosity variation parameter (ɛ) differ enough to distinguish between the possible bed forms. With respect to sand waves, the model can predict the outline of a sand wave field but is unable to explain the smaller scale variation in the area. Therefore, they conclude that there must be other factors that are not included in the model, which influence the occur-rence of sand waves. One of these factors may be the type of bed deposit.
Inclusion of a grain size dependency
A grain size dependency is included in the model to inves-tigate if this indeed improves the prediction of bed forms in the model. The grain size of the sediment influences the initiation of motion of the grains. Sediment transport takes place when a certain critical shear stress is exceeded.
The critical bed shear stress is denoted by:
τcr¼θcrgðρsρÞd50
whereg is the gravitational acceleration (9.81 m/s2), ρis the density of seawater (1025 kg/m3), ρsis the sediment
density (2650 kg/m3),d50is the median grain size andθcris
the critical Shields parameter, which is calculated using the equation of Soulsby and Whitehouse (1997):
θcr ¼ 0:30
1þ1:2Dþ0:055 1½ expð0:020DÞ
in which D* is the dimensionless sediment parameter, denoted by:
D ¼d50 Δg υ2
1
3
Fig. 4 DiscretizedEv−Sscheme.FBflat bed,SBsandbanks,SBand SWsandbanks and sand waves,SWsand waves
Fig. 5 Original prediction made by Hulscher and van den Brink (2001)
[image:3.595.311.539.48.226.2] [image:3.595.49.293.512.687.2] [image:3.595.311.538.535.696.2]where Δ is the relative density and υ is the kinematic viscosity (1.36×10⁻⁶m2/s).
Figure 6shows the bed shear stress for a varying flow velocity for four typical grain size dependent bed shear stress equations (Dawson et al. 1983; Van Rijn 1993; Soulsby 1997). Herein, we have chosen the grain sized50is 200μm,
which is a typical grain size found in sand waves. Belderson (1986) showed (Fig.2) that the occurrence of sand waves depends on the magnitude of the flow velocity. Above the critical value of 0.5 m/s, sand waves are observed. Therefore, we choose an equation that exceeds the critical bed stress closest to 0.5 m/s, i.e. Soulsby (1997) which is denoted by:
τb ¼ρCDu2
in which u is the depth-averaged flow velocity andCD is defined by:
CD¼0:0415
z0 H
2 7
in whichz0is:
z0 ¼d50
12
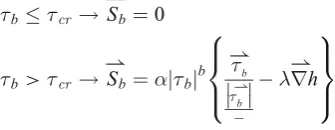
The bed shear stress and the critical bed shear stress are calculated using the location specific parameters (grain size, water depth and flow velocity) as input parameters. In the model, we assume that no sediment transport takes place when the critical bed shear stress exceeds the bed shear stress:
τb τcr !*Sb ¼0
τb >τcr !
*
Sb ¼α τj jb b
*τ
b *
τb
λr*h 8
> < > :
9 > = > ;
We use a general sediment transport equation and only take into account bed load, which is assumed to be dominant in offshore tidal regimes (Hulscher 1996). Parameter b de-notes the non-linearity of transport in relation with the bed shear stress,λis a bed-slope correction term,hdenotes the height of the bed form and α is a bed load transport proportionality parameter.
The Geographical Information System and data layers
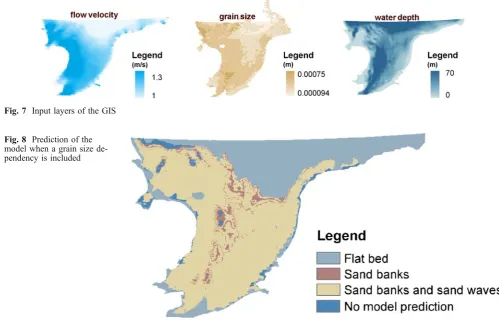
In this research, we use a GIS environment to calculate pre-dictions for the southern part of the North Sea. Location specific parameters are used as model input (Fig.7), which results in location-specific predictions for the occurrence of sandbanks and sand waves. The model that is used to predict
large-scale bed forms is connected to the GIS using a Dynamic Link Library.
The grain size data are digitized from different geological maps from the Dutch, British and Belgian Hydrographical Services. The tidal data are obtained using a model (ZUNOWAQ) (Verlaan et al. 2005) The model calculates the tidal components for a certain number of grid points. To obtain a continuous flow field, the data from the grid points are interpolated. Here we used the M2 component. The water depth is taken from the boundary conditions of the model (Van den Brink1998).
Results and comparison with observations
Results
The bed pattern predictions, after inclusion of grain size dependency, are shown in Fig.8. In a large area, sandbanks and sand waves are predicted but along the Belgian and Dutch coast and in the northeast of the area, a flat bed is predicted. Furthermore, there is a small area where only sandbanks are predicted.
When we compare the results of the prediction to the grain size data, we can see that in front of the Belgian and Dutch coast, a mainly flat bed (i.e. no large-scale bed forms are present) is predicted. Here the bed shear stress does not exceed the critical value although fine sediment is present. This is due to the lower flow velocities in this part of the North Sea. However, at a few places in this area sand waves and sandbanks are predicted, which is due to the presence of even finer sediment at these locations. In the northeast of the research area the presence of fine sediment is combined with low flow velocities, which causes the prediction of a flat bed (i.e. no large-scale bed forms) at this location.
[image:4.595.305.549.48.244.2] [image:4.595.50.218.442.507.2]Comparison with observations
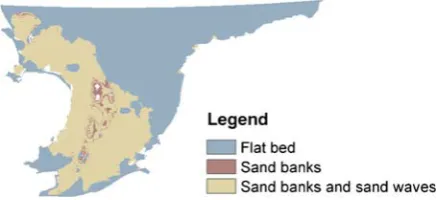
The comparison between the prediction of the model and observations of sand waves in the North Sea is given in Fig.9. The model gives a correct prediction in the north of the research area, where a flat bed (no large-scale bed forms are present) is both predicted and observed. Also, along the Dutch coast the prediction of a flat bed is correct according to the observations. In the middle of the southern North Sea, sand waves are both predicted and observed. The model gives an over prediction of the area where sand waves occur, especially along the British coast. Here, only patches of sand waves are observed, but the model predicts
a large area of sand waves. The model gives a correct pattern occurrence prediction in 62% of the research area. In Fig.10, the discreteEνbS scheme is plotted, which is used to calculate the bed form prediction on a specific loca-tion in the North Sea. The blue area denotes the calculatedEv andŜvalue pairs for locations in the North Sea where sand waves are observed.
As can be seen from the figure, most of theEvandŜvalues of locations where sand waves occur in the North Sea (blue area) correspond with values where the model predicts sand waves and sandbanks. A small part of the sand wave occur-rence in the North Sea corresponds with an area in the model
Fig. 7 Input layers of the GIS
Fig. 8 Prediction of the model when a grain size de-pendency is included
[image:5.595.44.544.54.376.2] [image:5.595.176.547.558.721.2]where a flat bed is predicted or where no prediction can be given. Note that in this figure, the critical bed shear stress that has to be exceeded is not taken into account.
Comparison of predictions with and without grain size dependency
The model results are also compared to the results without grain size influence (Fig.11). When grain size is taken into account in the model, larger areas of flat bed are predicted. This is caused by the fact that the bed shear stress and the critical bed shear stress are influenced by the grain size. When the grain size increases, the bed shear stress and the critical shear stress increase too. But as the critical bed shear stress increases more rapidly than the bed shear stress, at a certain grain size the bed shear stress does not exceed the critical bed shear stress anymore. So, if the bed material is coarser than that critical size, no sediment transport takes place anymore and a flat bed is predicted. A flat bed (no large-scale bed forms) is also predicted along the Belgian and Dutch coast, although the grain size is equal to the grain size in a large part of the North Sea where the occurrence of sand
waves is predicted. This difference in prediction is caused by the flow velocity, which is lower in front of the Belgian and Dutch coast. The critical bed shear stress is not exceeded, no sediment transport takes place, hence, no large-scale bed forms are predicted.
When a grain size dependency is included in the model, the area where a correct prediction is given increases from 51 to 62%.
Discussion
The quality and availability of data strongly influences the results. The grain size data are digitized on a certain grid size. The size of the grid is such that patchiness of alternating gravel and sand is not picked up. This might be the case in front of the British coast, where the model predicts a large sand wave area, but observations show only small patches of sand waves. This patchiness may be due to the presence of gravel patches, which are not included in the grain size data. When the critical shear stress is exceeded and sediment transport occurs, this sediment transport is calculated without further taking into account the influence of the critical shear stress. So, the calculation of sediment transport is made using
τbinstead of (τb–τc). This means that the calculated sediment
transport may be higher than the actually occurring transport. This has no effect on the type of bed form that is predicted, but it does influence the evolving time of the different bed patterns. As in this paper, we are only interested in the type of bed form that occurs in an equilibrium situation, this way of calculating sediment transport has no influence on the results.
The sediment grain size data show the grain size in classes. To be able to use the grain size in calculations, one discrete value is used. Here we used the mean grain size value of a class. This can cause errors in the prediction because the actual occurring grain size can be bigger or smaller.
Here, we calculated the occurrence of bed patterns using observed grain sizes. In reality, the grain size distribution is coupled to the bed forms. Walgreen et al. (2004) show that the bed forms cause a sorting of the sediment. In general however, these variations are small. The resolution of the grain size data is too coarse to take this effect into account.
[image:6.595.54.287.49.225.2]In the new prediction, the area where sand waves occur is over predicted. We see in Fig. 6 that at the critical flow velocity that Belderson (1986) proposes (0.5 m/s), the bed
[image:6.595.68.275.562.682.2]Fig. 10 Discretized scheme (after figure) wherein the occurrence of sand waves is plotted. [FBflat bed (i.e. no large-scale bedforms),SB sandbanks,SBandSWsandbanks and sand waves,SWsand waves)
Fig. 11 Comparison between the results of Hulscher and van den Brink (2001) and the model where a grain size dependency is included
[image:6.595.316.537.597.697.2]shear stress equation of Soulsby (1997) has already exceeded the critical bed shear stress and sediment transport is already taking place. The only equation that is still below the critical shear stress at a flow velocity of 0.5 m/s is the equation of Strickler. However, this equation gives a large under pre-diction of the sand wave area, as can be seen in Fig.12. From the results, it can be concluded that the bed shear stress equation chosen has a large influence on the results of the model. As most expressions for the critical bed shear stress and the bed shear stress contain empirical parameters, which are estimated using data sets that are mostly acquired from laboratory experiments, these parameters can be less suitable for offshore conditions and adapting these parameters could yield a better result.
Conclusion
Including a grain size dependency in the model improves the predictions of the model. Large areas are predicted where sandbanks and sand waves occur; in some smaller areas only sandbanks are predicted. Along the Belgian and Dutch coast and in the northeast of the research domain, areas of flat bed are predicted. There are large areas where sand waves are both predicted and observed. When the predictions that in-clude a grain size dependency are compared to predictions without sediment influence, larger areas of flat bed are predicted and the overall correct prediction increases from 51 to 62%. This means that inclusion of a grain size dependency is important to predict the occurrence of sand waves.
The model is a good starting point to investigate the effects of human activities in the area, like large-scale sand extraction, on the occurrence of large-scale morphological features.
Acknowledgements The authors would like to thank René Buijsrogge and Blanca Pérez Lapeña for their help with the GIS. This research is co-financed by the EU-project HUMOR (EVK3-CT-2000-00037) and the project PhD@Sea, which is substantially funded under the BSIK-programme of the Dutch Government and supported by the consortium WE@Sea.
References
Belderson RH (1986) Offshore tidal and non-tidal sand ridges and sheets: differences in morphology and hydrodynamic setting. In: Knight RJ, McLean JR (eds) Shelf sands and sandstones. Can Soc Petrol Geol Mem 11:293–301
Dawson GP, Johns B, Soulsby RL (1983). A numerical model of shallow-water flow over topography. In: Johns B (ed) Physical oceanography of coastal and shelf seas. Elsevier Oceanogr Ser 35:267–320
Heywood I, Cornelius S, Carver S (1998) An introduction to Geographical Information Systems. Addison Wesley Longman, New York
Hulscher SJMH (1996) Tidal-induced large-scale regular bed form patterns in a three-dimensional shallow water model. J Geophys Res 101(C9):20727–20744
Hulscher SJMH, Roelvink JA (1997) Comparison between predicted and observed large-scale sea bed features in the southern North Sea. Research Report, University of Twente, Enschede, The Netherlands
Hulscher SJMH, Van den Brink GM (2001) Comparison between predicted and observed sand waves and sandbanks in the North Sea. J Geophys Res 106(C5):9327–9338
Németh AA, Hulscher SJMH, de Vriend HJ (2002) Modelling sand wave migration in shallow shelf seas. Cont Shelf Res 22:2795– 2806
Soulsby RL (1997) Dynamics of marine sands: a manual for practical applications. Thomas Telford, London
Soulsby RL, Whitehouse RJSW (1997) Threshold of sediment motion in coastal environments. In: Proceedings of the Pacific coasts and ports, Christchurch, University of Canterbury, New Zealand, 7–11 September 1997, pp 149–154
Van den Brink GM (1998) Prediction of sand wave occurrence. Thesis, Water Engineering & Management, University of Twente, Enschede, The Netherlands
Van der Molen J (2002) The influence of tides, wind and waves on the net sand transport in the North Sea. Cont Shelf Res 22:2739–2762
Van Rijn RC (1993) Principles of sediment transport in rivers, estuaries and coastal seas. Aqua Productions, Amsterdam Verlaan M, Zijderveld A, De Vries H, Kroos J (2005) Operational
storm surge forecasting in the Netherlands: developments in the last decade. Philos Trans Royal Soc Math Phys Eng Sci 363:1441–1453. DOI 10.1098/rsta.2005.1578