S t a t i s t i c s i n f o c u s
Agriculture and fisheries
Authors: Maria BERGUA, Pol MARQUER, Carla MARTINS
73/2008
Farm structure in Malta - 2007
Increase in the number of horticultural holdings: 39% from 2005 to 2007.
zzzzzzzzzzzzzzzzzzzzzzzzzzzzzzzzzzzzzzzzzzzzzzzzzzzzzzzzzzzzzzz
This Statistics in Focus is part of a series of country-specific publications on the results of the Farm Structure Survey
(FSS) 2007. It provides a brief but nevertheless comprehensive insight into the farm structure in Malta.
11 020 agricultural holdings were recorded in Malta in the 2007 Farm structure survey (55 less than in 2005). Only
38% of these holdings had an economic size of at least one European Size Unit (ESU), compared to about 74% in
2005. This big difference is due to a change in agricultural prices, which has reduced the total Standard Gross
Margins (SGM) over recent years.
* * *
Due to the different coverage of the FSS across
Member States, the total number of farms is not
comparable between countries. This is why the
present analysis, including Tables 1-4 and the
graphs focus on holdings of at least 1 ESU. See
the methodological notes for more information on
the concept of ESU.
In 2007, about 4 100 holdings had an economic
size of at least 1 ESU.
They made use of
7 200 ha of utilised
agricultural area (UAA)
, which is on average
1.75
ha per holding (compared to
1.11
ha in
2005);
These holdings employed
3 400 annual work
units (AWU)
, the equivalent of 3 400 people
working full time;
They
had
49 000 livestock units
(LSU) in
2007, 7% more than in 2005.
Amongst these
4 100
agricultural holdings
(
≥
1ESU):
-
65
% made use of less than one AWU, while
another
10
% made use of 2 or more AWUs;
-
42
% used less than 1 ha, while
27%
used 2 ha
or more;
-
11% of the holdings were producing mainly for
own consumption;
-
31% of the holdings specialised in horticulture
and 22% were holdings of the type mixed
cropping;
-
16% of the holdings
specialised in livestock;
-
3% were mixed farms.
The labour force has decreased by 12% from 2005
to 2007.
Amongst the sole holders:
-
5% were women in 2007, (compared to 7% in
2005);
-
50% were aged 55 or more, and 6% were
younger than 35 years;
-
50% of sole/main holders had another gainful
activity in 2007.
In Malta in 2007, 18% of the agricultural area was
farmed by the owner.
There was an increase of 11% in the number of
goats, but a reduction of 23 % in the number of
sheep.
Distribution of the utilised agricultural area
0 0.5 1 1.5 2 2.5 3 3.5
<0.5 0.5-<1 1-<2 2-<5 >=5
Agricultural area size class (ha) 1000 ha
2005 2007
Description of the labour force in Malta
Non Family labour force 510 AWUs
Agricultural labour force
Family labour force 7280 persons of which 24% women
2900 AWUs
Working full time 1060 persons
Working part time 2990 persons
Not working on farm 60 persons
Working full time 230 persons
Working part time 1660 persons
Working full time 350 persons
Working part time 250 persons Working full time
110 persons
Working part time 1170 persons
Other family members 1900 persons of which 19% women 540 AWUs
… regular
600 persons of which 14% women 460 AWUs
Holders
4110 persons of which 5% women 2030 AWUs
Spouses of the sole holders 1280 persons of which 91% women 330 AWUs
… non regular 50 AWUs
Distribution of the number of livestock units
0 5 10 15 20 25 30 35
<5 5-<50 50-<100 100-<500 >=500
Size class (LSUs) 1000 LSUs
2005 2007
Malta – 2007
Table 1 – Labour force by size of the farms
Agricultural area (ha) All Livestock (LSU*)
<0.5 0.5-<1 1-<2 >=2 ha farms 0 >0-<5 5-<50 >=50
0.4 0.6 0.9 1.5 3.4 1.9 0.6 0.3 0.6
1.2 1.8 2.1 2.1 7.3 4.2 2.1 0.5 0.5
1000 annual work units 0.3 0.5 0.8 1.3 2.9 1.7 0.6 0.3 0.4
0.1 0.1 0.1 0.3 0.6 0.3 0.1 0.0 0.2
0.1 0.1 0.1 0.2 0.5 0.2 0.1 0.0 0.1
0.0 0.0 0.0 0.0 0.0 0.0 0.0 0.0 0.0
1000 0.7 1.0 1.3 1.1 4.1 2.5 1.1 0.2 0.3
(%) 3.3 4.6 6.6 1.8 4.3 5.3 1.3 10.2 1.4
- part-time: - under 50 % (%) 75.6 76.3 59.7 25.1 57.4 58.5 72.5 33.0 1.9
- part-time: - 50 % and over (%) 6.0 11.7 23.0 18.6 16.1 16.0 17.6 18.8 7.6
1000 0.7 1.0 1.3 1.1 4.1 2.5 1.1 0.2 0.2
(%) 3.3 7.3 6.6 2.1 5.0 6.3 1.8 11.2 1.5
(%)
- under 35 years 6.1 4.2 6.7 6.8 6.0 5.0 6.2 13.1 7.8
- from 35 to 44 years 21.6 7.7 11.0 16.6 13.4 15.9 4.8 20.3 21.8
- from 45 to 54 years 26.3 27.2 34.9 32.9 31.0 31.4 29.4 33.5 31.9
- from 55 to 64 years 21.2 34.2 39.0 28.4 32.0 29.6 37.3 32.7 30.6
- 65 years and over 24.8 26.7 8.4 15.3 17.6 18.1 22.2 0.4 7.9
- part-time: - under 50 % (%) 76.7 76.5 59.9 25.4 57.8 58.9 72.5 33.1 2.0
- part-time: - 50 % and over (%) 6.1 11.8 23.1 18.8 16.2 16.1 17.6 18.8 8.0
(%) 48.9 50.3 62.4 33.1 49.6 49.6 58.0 42.6 11.2
- as a main occupation 45.9 47.6 55.7 25.4 44.3 44.1 53.7 37.3 3.4
- as a subsidiary occupation 3.0 2.7 6.7 7.7 5.3 5.6 4.3 5.4 7.8
1000 0.3 0.2 0.4 0.4 1.3 0.7 0.4 0.1 0.1
(%) 100.0 86.3 82.6 97.7 91.4 89.0 98.1 80.7 96.2
(%)
- under 35 years 10.2 0.5 1.6 6.3 4.7 4.8 4.1 1.0 9.5
- from 35 to 54 years 36.4 36.2 61.6 66.4 53.8 61.0 33.1 63.3 66.9
– 55 years and over 53.4 63.3 36.8 27.3 41.5 34.2 62.8 35.7 23.5 - part-time: - under 50 % (%) 91.4 93.3 84.3 64.4 81.2 80.8 90.0 79.5 52.1
- part-time: - 50 % and over (%) 4.2 2.5 13.8 15.5 10.6 10.5 8.9 15.8 11.7
(%) 14.6 10.5 13.4 5.6 10.8 12.8 9.6 8.8 2.8
1000 0.2 0.6 0.4 0.6 1.9 1.0 0.6 0.1 0.2
(%) 17.6 4.8 36.7 21.0 18.8 12.4 33.4 7.9 16.4
- part-time: - under 50 % (%) 78.3 94.7 83.0 62.9 79.4 81.5 93.8 67.8 26.1
- part-time: - 50 % and over (%) 3.8 3.9 6.3 15.3 8.2 9.3 4.3 9.4 14.0
(%) 50.5 78.2 67.9 57.2 65.5 71.4 74.4 40.7 19.0 1000 annual work units
1000 annual work units
Spouse of sole holder
1000 persons
1000 annual work units
- women
Family labour force
Non-family labour regularly employed
- with another gainful activity - with another gainful activity
Other members of the holder’s family working on the holding Holding managers
- women
Size of the farms
- with another gainful activity1
- women
–distribution by age - women
–distribution by age
Sole/main holders
1000 persons
Non regular non family labour force Total labour force
*LSU = Livestock Unit
Malta – 2007
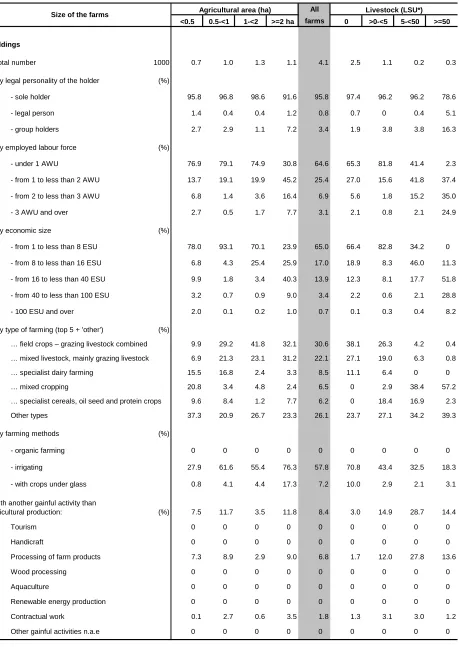
Table 2 – Agricultural holdings by size
"0" less than half of the unit or nil
All
<0.5 0.5-<1 1-<2 >=2 ha farms 0 >0-<5 5-<50 >=50
1000 0.7 1.0 1.3 1.1 4.1 2.5 1.1 0.2 0.3
(%)
- sole holder 95.8 96.8 98.6 91.6 95.8 97.4 96.2 96.2 78.6
- legal person 1.4 0.4 0.4 1.2 0.8 0.7 0 0.4 5.1
- group holders 2.7 2.9 1.1 7.2 3.4 1.9 3.8 3.8 16.3
(%)
- under 1 AWU 76.9 79.1 74.9 30.8 64.6 65.3 81.8 41.4 2.3
- from 1 to less than 2 AWU 13.7 19.1 19.9 45.2 25.4 27.0 15.6 41.8 37.4
- from 2 to less than 3 AWU 6.8 1.4 3.6 16.4 6.9 5.6 1.8 15.2 35.0
- 3 AWU and over 2.7 0.5 1.7 7.7 3.1 2.1 0.8 2.1 24.9
- by economic size (%)
- from 1 to less than 8 ESU 78.0 93.1 70.1 23.9 65.0 66.4 82.8 34.2 0
- from 8 to less than 16 ESU 6.8 4.3 25.4 25.9 17.0 18.9 8.3 46.0 11.3
- from 16 to less than 40 ESU 9.9 1.8 3.4 40.3 13.9 12.3 8.1 17.7 51.8
- from 40 to less than 100 ESU 3.2 0.7 0.9 9.0 3.4 2.2 0.6 2.1 28.8
- 100 ESU and over 2.0 0.1 0.2 1.0 0.7 0.1 0.3 0.4 8.2
(%)
… field crops – grazing livestock combined 9.9 29.2 41.8 32.1 30.6 38.1 26.3 4.2 0.4 … mixed livestock, mainly grazing livestock 6.9 21.3 23.1 31.2 22.1 27.1 19.0 6.3 0.8 … specialist dairy farming 15.5 16.8 2.4 3.3 8.5 11.1 6.4 0 0 … mixed cropping 20.8 3.4 4.8 2.4 6.5 0 2.9 38.4 57.2 … specialist cereals, oil seed and protein crops 9.6 8.4 1.2 7.7 6.2 0 18.4 16.9 2.3 Other types 37.3 20.9 26.7 23.3 26.1 23.7 27.1 34.2 39.3
(%)
- organic farming 0 0 0 0 0 0 0 0 0
- irrigating 27.9 61.6 55.4 76.3 57.8 70.8 43.4 32.5 18.3
- with crops under glass 0.8 4.1 4.4 17.3 7.2 10.0 2.9 2.1 3.1
(%) 7.5 11.7 3.5 11.8 8.4 3.0 14.9 28.7 14.4 Tourism 0 0 0 0 0 0 0 0 0 Handicraft 0 0 0 0 0 0 0 0 0 Processing of farm products 7.3 8.9 2.9 9.0 6.8 1.7 12.0 27.8 13.6 Wood processing 0 0 0 0 0 0 0 0 0 Aquaculture 0 0 0 0 0 0 0 0 0 Renewable energy production 0 0 0 0 0 0 0 0 0 Contractual work 0.1 2.7 0.6 3.5 1.8 1.3 3.1 3.0 1.2 Other gainful activities n.a.e 0 0 0 0 0 0 0 0 0
Size of the farms Agricultural area (ha) Livestock (LSU*)
- with another gainful activity than agricultural production:
Holdings
- total number
- by legal personality of the holder
- by employed labour force
- by type of farming (top 5 + 'other')
- by farming methods
[image:4.595.75.534.99.746.2]Malta – 2007
Table 3 – Land use by size of the farms
"0" less than half of the unit or nil
All
<0.5 0.5-<1 1-<2 >=2 ha farms 0 >0-<5 5-<50 >=50
(1000 ha)
0.3 0.9 2.0 5.0 8.2 4.9 2.1 0.4 0.8
0.1 0.2 0.2 0.5 1.0 0.5 0.2 0 0.2
0 0 0 0 0 0 0 0 0
0.2 0.8 1.8 4.5 7.2 4.4 1.8 0.4 0.6
0.1 0.5 1.4 3.7 5.8 3.3 1.6 0.4 0.5
0 0 0 0 0 0 0 0 0
Common wheat and spelt 0 0 0 0 0 0 0 0 0
Durum wheat 0 0 0 0 0 0 0 0 0
Rye 0 0 0 0 0 0 0 0 0
Barley 0 0 0 0 0 0 0 0 0
Oats 0 0 0 0 0 0 0 0 0
Grain maize 0 0 0 0 0 0 0 0 0
0 0 0 0 0 0 0 0 0 0 0.1 0.2 0.4 0.7 0.5 0.2 0 0
Potatoes 0 0.1 0.2 0.4 0.7 0.5 0.2 0 0
Sugar beet 0 0 0 0 0 0 0 0 0
Fodder root 0 0 0 0 0 0 0 0 0
0 0 0 0 0 0 0 0 0
Tobacco 0 0 0 0 0 0 0 0 0
Hops 0 0 0 0 0 0 0 0 0
Cotton 0 0 0 0 0 0 0 0 0
Rape and turnip 0 0 0 0 0 0 0 0 0
Sunflower 0 0 0 0 0 0 0 0 0
Soya 0 0 0 0 0 0 0 0 0
0 0.2 0.5 1.2 1.9 1.4 0.4 0.1 0
outside 0 0.2 0.5 1.1 1.8 1.3 0.4 0.1 0
under glass 0 0 0 0 0.1 0.1 0 0 0
0 0 0 0 0 0 0 0 0
outside 0 0 0 0 0 0 0 0 0
under glass 0 0 0 0 0 0 0 0 0
0 0.2 0.5 1.9 2.8 1.1 0.9 0.2 0.5 0 0.1 0.1 0.2 0.4 0.3 0.1 0 0
0 0.1 0.1 0 0.2 0.1 0.1 0 0
0 0 0 0 0 0 0 0 0
0 0.2 0.3 0.7 1.3 1.0 0.2 0 0
Fruit and berry plantation 0 0 0.1 0.3 0.4 0.3 0.1 0 0 Citrus plantation 0 0 0 0 0.1 0.1 0 0 0 Olive trees 0 0 0 0 0.1 0.1 0 0 0 Vineyard 0 0.1 0.2 0.4 0.7 0.6 0.1 0 0
(ha) 0.2 0.7 1.4 4.1 1.7 1.8 1.6 1.7 2.2
(%)
26.0 18.9 16.0 17.7 17.6 18.6 14.2 16.7 21.2 100.0 100.0 100.0 100.0 100.0 100.0 100.0 100.0 100.0 0 0 0 0 0 0 0 0 0 23.1 32.4 32.3 42.7 38.6 48.0 26.4 27.5 12.0 ... organic farmed
... irrigated
Area
Agricultural area per holding
Agricultural area...
... own farmed
... in less favoured or mountain area
- E. Kitchen garden
Fresh vegetables, melons, strawberry
- G. Permanent crops
Ratios
Flower and ornamental plants
Forage plants Fallow land
- F. Permanent pasture and meadows
Cereals
Dried pulses Root crops
Industrial crops
- D. Arable land
Livestock (LSU) Agricultural area (ha)
Total area of agricultural holdings
· H. Other area
Wooded area
· Agricultural area
Size of the farms
Malta – 2007
Table 4 – Livestock by size of the farms
":" not available "0" less than half of the unit or nil
Agricultural area (ha) All Livestock (LSU)
<0.5 0.5-<1 1-<2 >=2 ha farms 0 >0-<5 5-<50 >=50
(1000 LSU) 22.7 4.4 7.3 14.5 49.0 0 1.2 4.7 43.1
of which grazing (%) 18.1 33.3 32.1 56.4 32.9 : 84.9 39.0 30.9
(1000 heads)
0.1 0.1 0.1 0.1 0.5 0 0.3 0.1 0.1
4.7 1.3 2.7 10.1 18.9 0 0.1 1.7 17.1
Under 1 year 1.2 0.3 0.7 2.8 5.0 0 0 0.4 4.6 From 1 to less than 2 years 1.1 0.3 0.7 2.4 4.6 0 0 0.6 4.0 Dairy cows 2.1 0.6 1.2 4.2 8.1 0 0 0.6 7.5 Other cows 0 0 0 0 0 0 0 0 0 Other bovine animals 2 years and older 0.3 0.1 0.2 0.6 1.2 0 0 0.2 1.0
2.1 1.8 1.2 3.2 8.3 0 4.6 2.7 0.9
1.9 1.6 0.5 1.7 5.6 0 2.5 2.1 0.9
(1000 heads) 44.6 7.2 12.1 15.3 79.2 0 0 3.7 75.5
Piglets < 20 kg 10.5 2.4 2.5 2.7 18.2 0 0 1.3 16.8 Breeding sows 4.0 0.7 1.2 1.4 7.3 0 0 0.5 6.8 Other pigs 30.1 4.0 8.4 11.2 53.7 0 0 1.9 51.8
(million heads) 0.6 0.1 0.2 0.3 1.2 0 0 0.2 1.0
Broilers 0.2 0.1 0.2 0.2 0.7 0 0 0.2 0.5
Laying hens 0.4 0 0 0 0.6 0 0 0.1 0.5 Other poultry 0 0 0 0 0 0 0 0 0
(1000 heads) 2.7 1.8 1.9 0.6 6.9 0 3.5 2.1 1.3
(1000) : : : : : 0 : : :
(head/holding)
Equidae (head/holding) 1.8 1.3 1.1 2.0 1.5 : 1.3 2.3 2.2 Cattle (head/holding) 75.0 39.1 78.0 107.5 83.6 : 2.9 21.2 136.8 Dairy cows (head/holding) 40.6 18.8 41.4 51.3 41.4 : 1.3 7.6 65.9
Other cows (head/holding) : : : : : : : : : Sheep (head/holding) 10.2 8.9 7.2 13.9 10.4 : 7.1 32.9 14.8 Goats (head/holding) 9.9 19.9 14.6 11.0 12.3 : 7.3 32.3 23.0 Pigs (head/holding) 564.4 377.3 606.5 588.6 553.7 : : 154.7 634.2 Breeding sows (head/holding) 52.2 38.0 61.1 52.9 52.0 : : 18.9 58.9 Other pigs > 20 kg (head/holding) 381.2 212.8 418.2 430.4 375.6 : : 79.9 435.2 Rabbits, breeding females (head/holding) 11.6 11.1 15.2 4.4 10.7 : 5.8 105.3 64.0 Laying hens (1000/holding) 2.1 0.4 0.3 0.5 1.1 : 0 1.0 9.9 Broilers (1000/holding) 6.8 1.3 4.4 10.2 4.4 : 0 3.3 12.6 Beehives (hive/holding) : : : : : : : : :
Total livestock
Grazing livestock
Equidae
Size of the farms
Bovine animals
Sheep
Goats
Pigs Granivores
Poultry
Rabbits, breeding females
Beehives
Average size of herds*
Malta – 2007
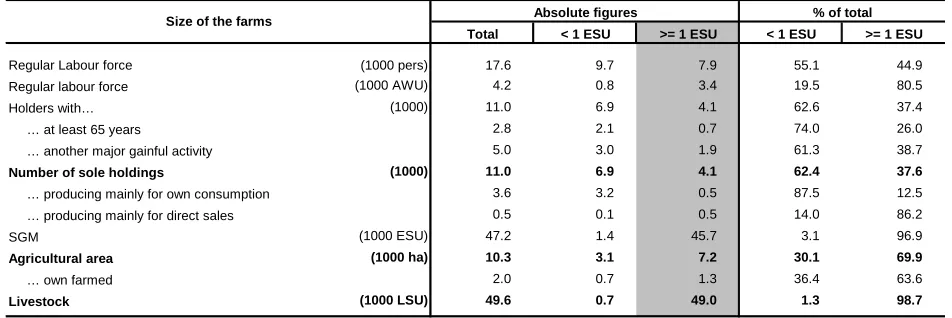
Table 5 – Subsistence farming
(1000 pers) 17.6 9.7 7.9 55.1 44.9 (1000 AWU) 4.2 0.8 3.4 19.5 80.5 (1000) 11.0 6.9 4.1 62.6 37.4
… at least 65 years 2.8 2.1 0.7 74.0 26.0
… another major gainful activity 5.0 3.0 1.9 61.3 38.7
(1000) 11.0 6.9 4.1 62.4 37.6
… producing mainly for own consumption 3.6 3.2 0.5 87.5 12.5 … producing mainly for direct sales 0.5 0.1 0.5 14.0 86.2 (1000 ESU) 47.2 1.4 45.7 3.1 96.9
(1000 ha) 10.3 3.1 7.2 30.1 69.9
… own farmed 2.0 0.7 1.3 36.4 63.6
(1000 LSU) 49.6 0.7 49.0 1.3 98.7
Livestock
Regular labour force Holders with…
Number of sole holdings
SGM
< 1 ESU >= 1 ESU % of total
Agricultural area
Absolute figures Size of the farms
Regular Labour force
Total < 1 ESU >= 1 ESU
*LSU = Livestock Unit
¾
METHODOLOGICAL NOTES
The survey on the structure of agricultural holdings was
carried out in Malta in the autumn of 2007 on a sample
basis. The previous full-scale agricultural census was
conducted in 2001, and the last sample farm structure
survey was in 2005. The reference period for the FSS
2007 was the crop year 2006/07 (ending on 31 August
2007), for livestock the 1
stof September 2007 and the
period for labour force referred to the 12 months
preceding the day of the survey.
The target population were the holdings, according to the
national definition, whose area consists of land and/or
buildings on which agricultural activities are carried out.
No thresholds were used, and the initial population was
composed of all the holdings included in the statistical
farm register, which is updated continuously on a regular
basis.
The population was stratified according to the type of
farming (8 groups) and economic size (3 groups), as well
as the regions. Certain typology and size classes were
clustered in order to get a representative sample. All the
holdings having at least 8 ESU were sampled surveyed
exhaustively. In the other strata the optimum allocation
method was used with random selection. Holdings in
each sampled strata were chosen on the proportion of
the total standard deviation of the SGM within the strata.
Altogether 1332 holdings have been selected, which is
12% of the registered population.
The list of characteristics and their definitions were fully
compliant with the EU requirements concerning the Farm
Structure Survey 2007. However some characteristics
were not surveyed due to their non-existence or
insignificance in the country's agricultural structure, in
accordance with Commission Regulation (EC) Nº
204/2006.
The data are checked at different levels. A first check is
done at the collection stage, where the consistency
checks of the totals are carried out by the interviewer.
The next quality control was a manual verification of the
completeness of the surveys; farmers were then
contacted by phone when clarification was needed. The
data were also checked during the input phase using a
specific application.
For each activity (`enterprise`) on a farm (for instance
wheat, dairy cow or vineyard), a standard gross margin
(SGM) is estimated, based on the area (or the number of
heads) and a regional coefficient. The sum of such
margins in a farm is its economic size, expressed in
European Size Units
(ESU, 1 ESU is a 1200-euro
standard gross margin).
Each farm is classified in the community typology by its
economic size and its type of farming, depending on the
share of each enterprise in its economic size.
Annual work unit
(AWU) is equivalent to a worker
employed on a full time basis for one year
.
In Malta it is
1800 hours (225 working days of 8 working hours per
day).
Livestock Unit (LU)
is equivalent to a dairy cow. The
number of animals (number of heads) is converted into
LU using a set of coefficients reflecting the feed
requirements of the different animal categories.
¾
REFERENCE PUBLICATIONS
Farm Structure Survey 2007, News Release No.
109/2008 (17 June 2008), National Statistics Office,
Malta.
Website of the National Statistical Office:
http://www.nso.gov.mt/
[image:7.595.60.536.102.261.2]Further information
Data:
Eurostat Website
:
http://ec.europa.eu/eurostat
Select your theme on the left side of the homepage and then ‘Data’ from the menu.
Data:
EUROSTAT Website/Agriculture, forestry and fisheries
Agriculture, forestry and fisheries
Agriculture
Structure of agricultural holdings
Overview of agricultural holdings
Key farm variables
Journalists can contact the media support service:
Bech Building Office A4/125 L - 2920 Luxembourg
Tel. (352) 4301 33408 Fax (352) 4301 35349
E-mail:
[email protected]
European Statistical Data Support:
Eurostat set up with the members of the ‘European statistical system’ a network of
support centres, which will exist in nearly all Member States as well as in some EFTA
countries.
Their mission is to provide help and guidance to Internet users of European statistical
data.
Contact details for this support network can be found on our Internet site:
http://ec.europa.eu/eurostat/
A list of worldwide sales outlets is available at the:
Office for Official Publications of the European Communities.
2, rue Mercier
L - 2985 Luxembourg
URL:
http://publications.europa.eu
E-mail:
[email protected]
Manuscript completed on: 28.07.2008 Data extracted on: 04.07.2008 ISSN 1977-0316