This paper is based on the oral presentation at the 7 International Conference on Road and Airfield Pavement Technology, ICPT 2011, in Bangkok,
Article
Effect of Changing Theoretical Maximum Specific
Gravity on Asphalt Mixture Design
Mohamed A. G. El Sayed
Department of Construction Engineering and Utilities, Faculty of Engineering, Zagazig University., Zagazig, Egypt
E-mail: [email protected]
Abstract. The value of theoretical maximum specific gravity of bituminous paving mixture (Gmm) plays a significant role in the performance of paving mixes. The Impact of
(Gmm) can be noticed on properties of bleeding, rutting, raveling, and fatigue. Calculation
of Gmm is fundamental to the design process of asphalt concrete mixes. It can be measured
either directly by using the standard Rice test method (AASHTO T209, ASTM D2041), or can be estimated indirectly based on the effective specific gravity of aggregate mixtures, and specific gravity of asphalt. In the latter case exact determination of percentage air voids, and optimum asphalt content values is pivotal in estimating the true value of Gmm.
This paper aims to study the Impact of changing theoretical maximum specific gravity for asphalt mixture on the characteristic of asphalt mixes. To achieve this objective an extensive experimental program was designed. Two types of aggregates (limestone and basalt) as well as four mix gradations were used to conduct the study. Based on the study results, it has been found that the measured air voids content using Gmm value measured
by rice test (AVm) is lower than the estimated air voids content (AVe) in about 20% and
9% for limestone and basalt, respectively. Consequently, the optimum asphalt content values based on the laboratory-measured Gmm (ACm) are lower than those which were
determined by using the estimated Gmm (ACe) by about 7% and 2% for limestone and
basalt, respectively. Therefore, it is recommended to use the rice test in determining the theoretical maximum specific gravity of asphalt mixture in Egyptian code.
Keywords: Theoretical maximum specific gravity of a bituminous paving mixture (Gmm),
rice test, percent air voids, optimum asphalt content, limestone, basalt.
ENGINEERING JOURNAL Volume 16 Issue 4 Received 9 January 2012
Accepted 7 May 2012 Published 1 July 2012
1.
Introduction
The theoretical maximum specific gravity of a bituminous paving mixture (Gmm) represents the maximum
theoretical mass of a unit volume of mixture composed entirely of impermeable aggregate coated with asphalt ,in other words, no air voids present in the mixture. Maximum specific gravity is required to determine the mixture's asphalt absorption, percent of air voids in the compacted bituminous paving mixture, percent of voids in mineral aggregate. Moreover, it is essential to determine the target values for the compaction. Theoretical maximum specific gravity is a critical Hot Mix Asphalt (HMA) characteristic because it is used to calculate the percent of air voids in compacted HMA.
The Percent of air voids in HMA pavement is important because it has a profound effect on long-term pavement performance [1]. An approximate "rule-of-thumb" is for every one percent increase in air voids (above 6-7 percent); accordingly, about 10 percent of the pavement life may be lost [1] [2]. The rule-of-thumb was developed using limited project data; therefore, it should be used with extreme caution and applied to air voids above 6 - 7 percent. According to Roberts et al. [3], there is considerable evidence that dense graded mixes should not exceed 8 percent nor fall below 3 percent air voids during their service life. Air voids that are either too great or too low can cause a significant reduction in pavement life [1]. For dense graded HMA, air voids between 3 and 8 percent generally produce the best compromise of pavement strength, fatigue life, durability, raveling, rutting and moisture damage susceptibility. High air void content (above 8 percent) or low air void content (below 3 percent) may cause several pavement distresses. Examples of the distresses for dense-graded HMA are; (a) Decreased stiffness and strength, tensile strength, static and resilient moduli ;moreover, the stability is reduced at high air void content [1]; (b) reduced fatigue life, fatigue properties can be reduced by 30 to 40 percent for each one percent increase in air void content; (c) accelerated aging/decreased durability; (d) raveling, raveling becomes a significant problem above about eight percent air voids and becomes a severe problem above approximately 15 percent air voids [1]; (e) rutting, the amount of rutting which occurs in an asphalt pavement is inversely proportional with the air void content [1] [4]; (f) moisture damage, air voids in insufficiently compacted HMA are high and tend to be interconnected with each other. Numerous and interconnected air voids allow for easy water entry [1] which increases the possibility of significant moisture damage.
In designing the pavement mixture by MARSHALL design method, Gmm is needed at each asphalt
content to calculate the percent of air voids. Some agencies require performing the Rice test at each asphalt content level. Other agencies allow the Rice test to be run at two asphalt contents preferably on mixes at or near optimum asphalt content and then calculating Gmm at other asphalt content levels. From these tests,
which are based on the effective specific gravity of the aggregate, (Gse) derived from the test results [5].
The effective specific gravity (Gse) of the aggregate can be calculated from the measured values of
(Gmm), using the following equation:
mm b se
b mm
mm b
P
P
G
P
P
G
G
(1)In addition, the Gmm of any other asphalt content can be obtained using the following equation:
mm mm
s b
se b
P
G
P
P
G
G
(2)where
Gse = effective specific gravity of aggregate,
Gmm = theoretical maximum specific gravity of paving mixture,
Pmm = percent by mass of total loose mixture = 100,
Pb = asphalt content at which test was performed, percent by total mass of mixture,
Gb = specific gravity of asphalt, and
Ps = aggregate content, percent by total mass of mixture.
In fact, the effective specific gravity (Gse) is assumed to be constant in Eq. (2), and this is valid since
asphalt absorption does not change with varying the asphalt content.
According to the procedures of MARSHALL design method, which is mentioned in the Egyptian code for urban and rural works [6], (Gmm) is estimated based on the effective specific gravity of the aggregate
mentioned in the code don’t include the Rice test for measuring Gmm. The effective specific gravity of
aggregate mixture is assumed to be equal to the saturated surface dry specific gravity or to the average value of the bulk. Furthermore, the apparent specific gravity of aggregate mixture was detailed on preparation and construction of the road projects handbook of general authority of roads and bridges and land transport [7]
The two methods of determining the Gmm in asphalt mixtures, discussed in this research, are as follows:
1) Measuring Gmm using the Rice test. It will be referred to, as Gmm-m [8, 9].
2) Estimating Gmm using the effective specific gravity of aggregate mixtures which assumed to be equal to
the following [6, 7]:
a) Saturated surface dry specific gravity. It will be referred to, as Gmm-e1 [7].
b) Average value of bulk and apparent specific gravity. It will be referred to, as Gmm-e2 [7].
Based on MARSHALL design method, the maximum specific gravity of a bituminous paving mixture (Gmm) was determined through the standard test method, AASHTO T209 [8], ASTM D2041 [9] that is
called Rice test (named after James Rice, who developed the test procedure) [5, 10].
1.1. Rice Method
Rice test is used for determining the theoretical maximum specific gravity (Gmm) of un-compacted Hot Mix
Asphalt (HMA) paving mixtures at 25°C (77°F) in accordance with AASHTO T209 [8], ASTM D2041 [9] procedures. The Apparatus of this test includes containers with vacuum bowls and vacuum flask to weigh in air only, scale; in addition, it contains vacuum pump or water aspirator, residual pressure manometer or calibrated absolute pressure gage, manometer or vacuum gage, thermometers, water bath, bleeder valve, mechanical agitation device, and oven. Figure 1 shows the rice test apparatus. A weighed sample of oven-dry paving mixture in the loose condition is placed in a tarred vacuum vessel. Sufficient water at a temperature of 25°C (77°F) is added to completely submerge the sample. Vacuum is gradually applied to reduce the residual pressure in the vacuum vessel to 4 kPa (30 mm of Hg) or less. Then, it held for 15 ± 2 min. At the end of the vacuum period, the vacuum is gradually released. The volume of the sample of the paving mixture is obtained by immersing the vacuum container with the sample in water bath then weighs it, or by fills the vacuum container level full of water and weighs it in air. Both the temperature and mass are measured at this time. From the mass and volume measurements, the specific gravity or density of aggregate is obtained at 25°C.
The Air voids, Pa, in the total compacted paving mixture consist of the small air spaces between the
aggregate particles. The volume percentage of air voids in a compacted mixture can be determined using the following equation [5]:
100
mm mba
mm
G
G
P
G
(3)
As appear from Eq. (3), Pa is directly proportional to Gmm value. From the previous discussions, it can
concluded that Gmm value, estimated by Eq. (2) which used in the Egyptian procedures for MARSHALL
design of pavement mix, is directly proportional to the assumed value of effective specific gravity of aggregate mixture (Gse),as clear in Eq. (2).
1.2. Study Problem Statement
Based on MARSHALL design method, the maximum theoretical specific gravity of a bituminous paving mixture (Gmm) is measured through a standard test method, AASHTO T209, ASTM D2041 that is called
Rice test. However, according to the procedures of MARSHALL design method mentioned in the Egyptian code for urban and rural works [6], (Gmm) is estimated based on the effective specific gravity of the
aggregate mixtures. The effective specific gravity of aggregate mixture is assumed to be equal to the saturated surface dry specific gravity or to the average value of bulk and to the apparent specific gravity of aggregate mixture.
1.3. Study Objective
The main objective of this paper is to discuss the impact of Gmm Calculation method on the percent of air
voids in pavement mixture and on the optimum asphalt content of a pavement mixture.
Fig. 1. Theoretical maximum specific gravity of a bituminous paving mixture (Gmm) test apparatus, rice test
apparatus [9].
2.
Experimental Program
Four aggregates mixtures design specifications and two types of aggregates were used to perform eight HMA designs. The design mix specifications include the following:
1) Class A aggregate gradation, Riyadh Municipality
2) Class 1 aggregate gradation, Ministry of Transportation, Saudi Arabia.
3) Class 3B course graded aggregate gradation, Egyptian code for urban and rural works.
4) Class 2C open graded aggregate gradation specifications, Egyptian code for urban and rural works. Table 1 shows the aggregate gradation for the four aggregate mixtures which mentioned above. The previous four aggregate mixtures were produced with two types of aggregates as follows:
1) Limestone aggregate. 2) Basalt aggregates.
Eight MARSHALL mix design were performed using the four aggregate gradations specifications, which mentioned in Table 1, and two types of aggregate (limestone, basalt). Gmm was determined for all
mixes as following:
1) Measured: By measuring Gmm using the Rice test. It will be referred to, as Gmm-m [8, 9].
2) Estimated: By estimating Gmm using the effective specific gravity of aggregate mixtures which
assumed to be equal to the following [6, 7]:
a) Saturated surface dry specific gravity. It will be referred to, as Gmm-e1 [7].
b) Average value of bulk and apparent specific gravity. It will be referred to, as Gmm-e2 [7].
Also, the percent of air voids at each design asphalt content level and optimum asphalt content were calculated three times. The first, by using Gmm-m, the second by using Gmm-e1, and the third by using Gmm-
[image:4.595.114.473.140.398.2]Table 1. Aggregate gradation for aggregate mixtures.
Aggregate Gradation Specification/Code
SIEVE SIZE
RG_Open_2C EG_Course_3B SA_MOT_1 SA_RM_A
U.L L.L U.L L.L U.L L.L U.L L.L
100 100 100 100 19 3/4"
100 70 100 75 90 75 95 80 12.5 1/2"
75 45 85 60 79 64 9.5 3/8"
40 20 55 35 56 41 62 48 4.75 #4
20 5 35 20 2.36 #8
- - - - 37 23 45 32 2 #10
- - - 1.18 #16
- - 22 10 - - - - 0.6 #30
- - - - 20 7 26 16 0.425 #40
- - 16 6 - - - - 0.3 #50
- - - - 13 5 18 8 0.18 #80
- - 12 4 - - - - 0.15 #100
4 0 8 2 8 3 8 4 0.075 #200
SA_MOT_A: Class A aggregate gradation specifications, Riyadh Municipality.
SA_MOT_1: Class 1 aggregate gradation specifications, Ministry of Transportation, Saudi Arabia.
EG_Course_3B: Class 3B Course graded aggregate gradation specifications, Egyptian code for urban and rural works. RG_Open_2C: Class 2C Open graded aggregate gradation specifications, Egyptian code for urban and rural works.
LL: Lower Limit. UL: Upper Limit.
3.
Data Analysis
3.1. Percent of Air Voids
The Percent of air voids at each design asphalt content level during MARSHALL mix design for the eight designs were calculated by using Gmm-m, Gmm-e1, and Gmm-e2. Figure 2 shows the relation between the
percent of air voids, which calculated using Gmm-m (AVm), and the percent of air voids ,which calculated by
using Gmm-e1 (AVe1), for limestone and basalt asphalt mixes. It seems from the figure that AVm is lower
than AVe1 for limestone asphalt mixes, and it is higher than AVe1 for basalt asphalt mixes.
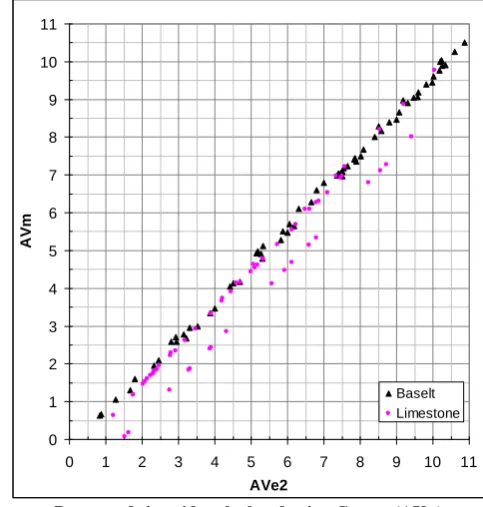
Figure 3 shows the relation between AVm and percent of air voids, which calculated using Gmm-e2
(AVe2), for limestone and basalt asphalt mixes. It seems from the figures that AVm is lower than AVe2 for
limestone and basalt asphalt mixes.
Regression analysis of the data presented in Figs. 2 and 3 was figured out using the regression analysis technique through the MINITAB statistical software version 13.2. The regression process was performed to get a group of models that relate AVm and both of AVe1 , AVe2 for limestone and basalt aggregate study
samples. The models is used to get the effect of changing Gmm on the values of air voids and asphalt
content of asphalt mixture. The dependent variable was AVm and the independent variable was AVe. The
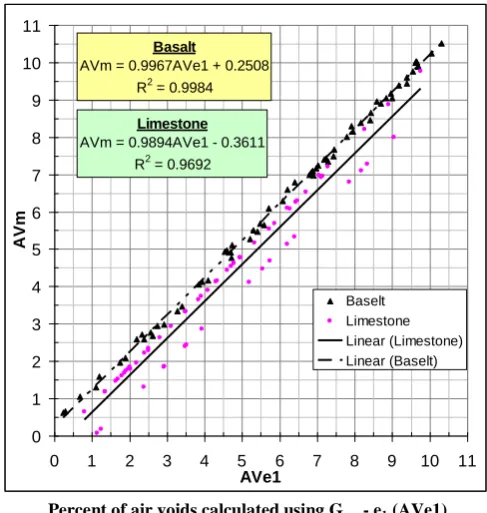
selected models were linear. Figure 4 shows AVm versus AVe1 for both limestone and basalt asphalt mixes.
Eq. (4) presents the limestone model, while Eq. (5) presents basalt model.
For limestone aggregate: AVm = 0.9894 (AVe1) – 0.3611 (4)
For basalt aggregate: AVm = 0.9967 (AVe1) + 0.2508 (5)
where AVm: percent of air voids calculated using Gmm-m;
AVe1: percent of air voids calculated using Gmm-e1.
Figure 4 shows that as AVm increases, AVe increases. Moreover, AVm is lower than AVe1 for limestone
mixes; however, AVm is higher than AVe1 for basalt mixes.
The square root coefficients of determination (R2) are 0.969 and 0.998 for limestone and basalt asphalt
Fig. 2. AVm versus AVe1 for limestone and basalt test sample.
Fig. 3. AVm versus AVe2 for limestone and basalt test sample.
The comparison of the value of AVm with the value of AVe1 at a range between 3 to 5% ,which was
estimated the percent of air voids using Eq. (4) and (5), reveals that for limestone AVm is lower than AVe1
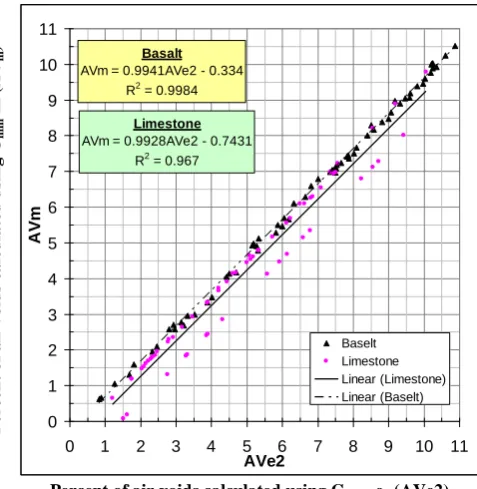
by 10%, and for basalt AVm is greater than AVe1 by 6%. Figure 5 shows AVm versus AVe2 for both
limestone and basalt aggregate study samples. Eq. (6) presents the limestone model, while Eq. (7) presents basalt model.
For limestone aggregate: AVm = 0.9928 (AVe2) – 0.7431 (6)
For basalt aggregate: AVm = 0.9941 (AVe2) - 0.334 (7)
where: AVe2: percent of air voids calculated using Gmm-e2.
0 1 2 3 4 5 6 7 8 9 10 11
0 1 2 3 4 5 6 7 8 9 10 11
AVe2
A
V
m
Baselt Limestone
P
ercent
o
f
a
ir
v
o
ids
c
a
lcu
la
ted
us
ing
G
mm
-
m
(
A
Vm
)
Percent of air voids calculated using Gmm-e2 (AVe2)
P
ercent
o
f
a
ir
v
o
ids
ca
lcul
a
ted
us
ing
G
mm
-m
(
A
Vm
)
Percent of air voids calculated using Gmm-e1 (AVe1)
0 1 2 3 4 5 6 7 8 9 10 11
0 1 2 3 4 5 6 7 8 9 10 11
AVe1
AV
m
[image:6.595.173.415.77.322.2] [image:6.595.179.421.371.625.2]The figure shows that as the value of AVm increases, AVe increases and AVm is lower than AVe2 for
limestone and basalt mixes.
The square root coefficients of determination (R2) are 0.967 and 0.998 for limestone and basalt asphalt
mixes, respectively. In addition, the standard error of estimate (S) values for limestone and basalt are 0.4286 and 0.1138, respectively. The comparison between the value of AVm and the value of AVe2 at a range
between 3 to 5%, which estimated percent air voids by using Eq. (6), and Eq. (7) shows that AVm values for
limestone and basalt asphalt mixes are lower than AVe2 by 20%, and by 9%, respectively.
Fig. 4. Relationship between AVm and AVe1 for test samples.
3.2. Optimum Asphalt Content of Pavement Mixture
The optimum asphalt content of pavement mixture for the design mixes was calculated 3 times using MARSHALL method. The first one was calculated using Gmm-m and called (ACm); the second one was
calculated using Gmm-e1 and called (ACe1); finally, the last one was calculated using Gmm-e2 and called (ACe2).
Figure 6 shows the data of ACm versus the data of ACe1. According to the figure, the value of ACm
increases, the value of ACe increases; however, ACm value is lower than ACe1 for limestone, while ACm
value is higher than ACe1 for basalt.
The regression analysis indicated that the selected models were linear as presented in Fig. 6 as follows:
For limestone aggregate: ACm = 0.8333 (ACe1) + 0.54117 (8)
For basalt aggregate: ACm = 1.0403 (ACe1) - 0.0963 (9)
where:
ACm: optimum asphalt content of pavement mixture using Gmm-m,
ACe1: optimum asphalt content of pavement mixture using Gmm-e1,
The square root coefficients of determination (R2) for limestone and basalt asphalt mixes are 0.387 and
0.989, respectively. The comparison of the value of ACm with the value of ACe1, which computed using Eq.
(8) and (9), reveals that ACm is lower than ACe1 by 5% for limestone, and ACm is higher than ACe1 by 2%
for basalt asphalt mixes.
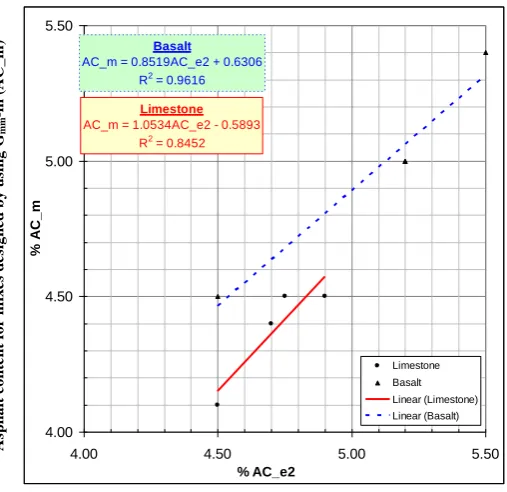
Figure 7 shows the data of ACm versus the data of ACe2. It shows that when the value of ACm increases,
the value of ACe increases; however, ACm value is lower than ACe2 for limestone and basalt aggregate. The
regression analysis indicated that the selected models were linear as presented in Fig. 7 as follows:
For limestone aggregate: ACm = 1.0534 (ACe2) – 0.5893 (10)
For basalt aggregate: ACm = 0.8519 (ACe2) + 0.6306 (11)
P
ercent
o
f
a
ir
v
o
ids
ca
lcul
a
ted
us
ing
G
mm
-m
(
A
Vm
)
Percent of air voids calculated using Gmm- e1 (AVe1)
Limestone AVm = 0.9894AVe1 - 0.3611
R2 = 0.9692 Basalt
AVm = 0.9967AVe1 + 0.2508
R2 = 0.9984
0 1 2 3 4 5 6 7 8 9 10 11
0 1 2 3 4 5 6 7 8 9 10 11
AVe1
AV
m
[image:7.595.178.422.178.435.2]where ACe2: optimum asphalt content of pavement mixture using Gmm-e2.
The square root coefficients of determination (R2) for limestone and basalt asphalt mixes are 0.845 and
0.961, respectively. The comparison of the value of ACm with the value of ACe2 ,which computed using Eq.
(10) and (11), reveals that ACm values for limestone and basalt asphalt mixes are lower than ACe2 ones by
7% and 2%, respectively.
Fig. 5. Relationship between AVm and AVe2 for test samples.
3.3. Effects on Percent of Air Voids at Optimum Asphalt Content of Pavement Mixture
The percent of air voids at optimum asphalt content of pavement mixture is impacted by the Gmm
calculation method. In case of performing mix design procedures with Gmm, which estimated by the
equation, the true percent of air voids in the designed mix will be AVm ; however, the design sheet will
include AVe . The AVm value usually differs than AVe. This means that at selected estimated optimum
asphalt content (ACe), the true percent of air voids (AVm) may be near to the upper or lower limits of the
specification ranges.
Figure 8 shows AVm and AVe1 at the optimum asphalt content (ACe1) for the first three pavement
mixtures was presented in Table 1 for the two aggregate types. It can be noticed that the true percent of air voids (AVm) for the limestone mixes are less than the estimated AVe1, and reaches the lower specification
limit for mix number (2).
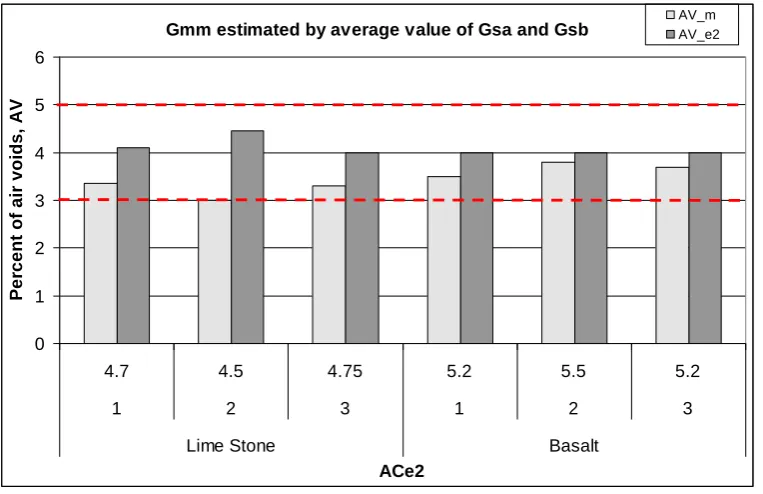
Figure 9 shows AVm and AVe2 at optimum asphalt content (ACe2) for the first three pavement mixtures
was presented in Table 1 for the two aggregate types. It is obvious that the true percent of air voids (AVm)
for the limestone and basalt mixes are less than the estimated AVe2. Moreover, they reach the lower
specification limit for one of the mixes.
On the other hand, the analysis for optimum asphalt content indicated that ACm for limestone is lower
than ACe1 by 5% and ACm is lower than ACe2 by 7%. This means that the designed mixes which made by
limestone have exactly lower air voids value and higher asphalt content. This may be one of the reasons of appearing bleeding asphalt distresses. Thus, it is very important to apply measuring Gmm by Rice test in
asphalt mix design.
Limestone
AVm = 0.9928AVe2 - 0.7431 R2 = 0.967
Basalt
AVm = 0.9941AVe2 - 0.334 R2 = 0.9984
0 1 2 3 4 5 6 7 8 9 10 11
0 1 2 3 4 5 6 7 8 9 10 11
AVe2
A
V
m
Baselt Limestone Linear (Limestone) Linear (Baselt)
P
ercen
t
o
f
a
ir
v
o
ids
c
a
lcu
la
ted
us
ing
G
mm
-m
(A
Vm
)
[image:8.595.178.417.153.398.2]Fig. 6. Relationship between ACm and ACe1 for test samples.
Fig. 7. Relationship between ACm and ACe2 for test samples.
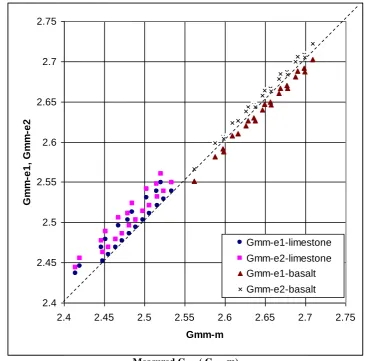
3.4. Relationship Between Measured and Estimated Theoretical Maximum Specific Gravity
Figure 10 shows the measured Gmm using the Rice test (Gmm–m) versus both of estimated Gmm using
saturated surface dry specific gravity (Gmm–e1) and estimated Gmm using average value of bulk and
apparent specific gravity (Gmm–e2 ) for limestone and basalt.
It seems from the figures that the measured Gmm is usually lower than the estimated one for limestone
while the measured Gmm is higher than the Gmm–e1 and lower than Gmm–e2 for basalt.
Limestone
AC_m = 1.0534AC_e2 - 0.5893
R2 = 0.8452
Basalt
AC_m = 0.8519AC_e2 + 0.6306 R2 = 0.9616
4.00 4.50 5.00 5.50
4.00 4.50 5.00 5.50
% AC_e2 % A C _ m Limestone Basalt Linear (Limestone) Linear (Basalt) A sp h al t c on te n t f or m ix es d es ig n ed b y u sin g Gmm -m ( A C _m )
Asphalt content for mixes designed by using Gmm-e2(AC_e2)
Asphalt content for mixes designed by using Gmm-e1(AC_e1)
Limestone
AC_m = 0.8333AC_e1 + 0.5417 R2 = 0.3876
Basalt
AC_m = 1.0403AC_e1 - 0.0963
R2 = 0.9892
4.00 4.50 5.00 5.50
4.00 4.50 5.00 5.50
[image:9.595.174.426.77.334.2] [image:9.595.164.418.386.632.2]Fig. 8. Effects on percent of air voids at optimum asphalt content ACe1.
Fig. 9. Effects on percent of air voids at optimum asphalt content ACe2. Gmm estimated by average value of Gsa and Gsb
0 1 2 3 4 5 6
4.7 4.5 4.75 5.2 5.5 5.2
1 2 3 1 2 3
Lime Stone Basalt
ACe2
Pe
rc
e
n
t
o
f
a
ir
v
o
id
s
,
A
V
AV_m AV_e2
Asphalt content for mixes designed by using Gmm-e2 (AC_e2)
Asphalt content for mixes designed by using Gmm-e1 (AC_e1)
Gmm estimated by saturated surface dry specific gravity
0 1 2 3 4 5 6
4.5 4.5 4.6 4.9 5.25 4.95
1 2 3 1 2 3
Lime Stone Basalt
ACe1
P
e
rc
e
n
t
o
f
a
ir
v
o
id
s
,
A
V
[image:10.595.102.478.91.330.2] [image:10.595.106.488.381.628.2]Fig. 10. Gmm-m vs. Gmm-e1 and Gmm-e2 for limestone and basalt test.
4.
Conclusions And Recommendations
In this study, the impact of changing theoretical maximum specific gravity of asphalt mixture on the properties of asphalt mixes has been investigated thorough an extensive experimental program. The following conclusions and recommendations can be classified as follows and may be applied for Egypt and similar countries which not apply rice test for MARSHALL design procedures:
1) The percent of air voids using Gmm-m (AVm), could be predicted from the independent variables
percent of air voids calculated by Gmm-e1 using Eq. (4) for limestone aggregate and Eq. (5) for
basalt aggregate. From these equations, it could obtain more than 96 percent information about AVm from AVe within the studied data range, and may be used to get AVm in case of non
availability of Rice test.
2) The percent of air voids using Gmm-m (AVm) can predicted from the independent variables percent
of air voids which calculated by Gmm-e2 using Eq. (7) for limestone aggregate and Eq. (8) for basalt
aggregate. From these equations, it could obtain more than 96 percent information about AVm
from AVe within the studied data range, and may be used to get AVm in case of non availability of
Rice test.
3) The comparison of the value of AVm with the value of AVe1 at a range between 3% to 5%
estimated percent air voids reveals that for limestone AVm is lower than AVe1 by 10%, and AVm is
greater than AVe1 by 6% for basalt.
4) The comparison of the value of AVm with the value of AVe2 at a range between 3% to 5%
estimated percent air voids reveals that AVm values for limestone and basalt asphalt mixes are
lower than AVe2 by 20% and 9%, respectively.
5) The optimum asphalt content using Gmm-m (ACm), can predicted from the independent variables
optimum asphalt content which calculated by Gmm-e1 (ACe1) using Eq. (8) for limestone aggregate
2.4 2.45 2.5 2.55 2.6 2.65 2.7 2.75
2.4 2.45 2.5 2.55 2.6 2.65 2.7 2.75
Gmm-m
G
m
m
-e
1
,
G
m
m
-e
2
Gmm-e1-limestone
Gmm-e2-limestone Gmm-e1-basalt
Gmm-e2-basalt
E
st
im
at
ed
G
m
m
(
Gmm -e1
,
Gmm -e2
)
[image:11.595.119.485.80.441.2]and Eq. (9) for basalt aggregate. From these equations, it could obtain 81 percent information about ACm from ACe1 within the studied data range.
6) The optimum asphalt content using Gmm-m (ACm), can predicted from the independent variables
optimum asphalt content calculated by Gmm-e2 (ACe2) using Eq. (10) for limestone aggregate and
Eq. (11) for basalt aggregate. From these equations, it could obtain 38, 98 percent information about ACm from ACe2 for limestone and basalt aggregates, respectively, within the studied data
range.
7) The comparison of the value of ACm with the value of ACe1 using the previous equations shows
that ACm is lower than ACe1 by 5% for limestone; however, ACm is higher than ACe1 by 2% for
basalt.
8) The comparison of the value of ACm with the value of ACe2 using the previous equations reveals
that ACm values for limestone and basalt asphalt mixes are lower than ACe2 by 7% and 2%,
respectively.
9) Rice test should be applied for MARSHALL design procedures mentioned in Egyptian code for urban and rural works, and in all pavement mix designs performed for Egyptian roads.
Acknowledgments
The author wishes to thank the engineering staff of KATTAN Consultant Office for greet help and facilitation during the laboratory tests, specially Eng. M. R. F. Kattan, Eng. M. Bayyoumi, and Eng. Abdullah Ibrahim.
References
[1] (May 2009) Flexible Pavement Construction [Online]. http://training.ce.washington.edu/WSDOT/ Modules/07_construction/07-6_body.htm
[2] R. N. Linden, J. P. Mahoney, and N. C. Jackson, “The effect of compaction on asphalt concrete performance,” presented at the 1989 Annual Meeting of the Transportation Research Board, Washington, DC, 1989.
[3] F. L. Roberts, P. S. Kandhal, E. R. Brown, D. Y. Lee, and T. W. Kennedy, “Hot mix asphalt materials, mixture design, and construction,” National Asphalt Paving Association Education Foundation, Lanham, MD, 1996.
[4] J. A. Scherocman, “Guidelines for compacting asphalt concrete pavement,” Better Roads, vol. 54, no. 3, pp. 12-17, Mar. 1984.
[5] T. R. Murphy and R. A. Bentsen, MARSHALL MIX DESIGN: Getting the most out of your MARSHALL MIXES. Norridge, IL: Humboldt Mfg. Co., 2001.
[6] Standard Test Method for Theoretical Maximum Specific Gravity and Density of Bituminous Paving Mixtures, American Society for Testing and Materials ASTM International Designation: D 2041 – 03a, 2005. [7] Egyptian Code for Urban and Rural Roads Works, Part Four: Roads Materials and their Testing, 1st ed., 1998. [8] Mix Design Methods for Asphalt Concrete and Other Hot-Mix Types. The Asphalt Institute Manual Series No.
2 (MS-2), Mar. 1979.
[9] Standard Specifications for Transportation Materials and Methods of Sampling and Testing, 17th ed., Maximum Specific Gravity of Bituminous Paving Mixtures, AASHTO Designation: T209-94, 1995.
![Fig. 1. Theoretical maximum specific gravity of a bituminous paving mixture (Gmm) test apparatus, rice test apparatus [9]](https://thumb-us.123doks.com/thumbv2/123dok_us/8110385.236168/4.595.114.473.140.398/theoretical-maximum-specific-gravity-bituminous-mixture-apparatus-apparatus.webp)