Virtual environments
32
0
0
Full text
(2) Review Copy – Not for Redistribution Eckart Lange - Department of Landscape, The University of Sheffield - 01/06/2017. Landscape architecture is a potentially powerful profession and discipline: a field poised to transform the planet for the better. This possibility will only be realized through a more robust research agenda. The authors of Research in Landscape Architecture have produced just such a framework. They present a helpful, thoughtful roadmap for landscape architecture scholars. — Frederick Steiner, Dean and Paley Professor, School of Design, University of Pennsylvania, USA. As a practice-led discipline, landscape architecture faces a challenge when trying to impose methodology on a somewhat theory-resistant subject. This new book presents cases of landscape architecture research in their methodical context. We learn how landscape architecture research questions are formulated and how evidence for answering them can be found. We live in an era of ever increasing complexity on the one hand and strong specialisation on the other. Where to position the holistic perspective of this domain? This book will give valuable orientation for anybody looking for systematic knowledge production in landscape architecture. It will inspire especially early-career researchers. — Ellen Fetzer, Nürtingen-Geislingen University, Germany, International Master of Landscape Architecture (IMLA).
(3) Review Copy – Not for Redistribution Eckart Lange - Department of Landscape, The University of Sheffield - 01/06/2017. Edited by Adri van den Brink, Diedrich Bruns, Hilde Tobi and Simon Bell. Research in Landscape Architecture Methods and methodology.
(4) Review Copy – Not for Redistribution Eckart Lange - Department of Landscape, The University of Sheffield - 01/06/2017. First published 2017 by Routledge 2 Park Square, Milton Park, Abingdon, Oxon OX14 4RN and by Routledge 711 Third Avenue, New York, NY 10017 Routledge is an imprint of the Taylor & Francis Group, an informa business © 2017 selection and editorial matter, Adri van den Brink, Diedrich Bruns, Hilde Tobi and Simon Bell; individual chapters, the contributors The right of Adri van den Brink, Diedrich Bruns, Hilde Tobi and Simon Bell to be identified as the authors of the editorial material, and of the authors for their individual chapters, has been asserted in accordance with sections 77 and 78 of the Copyright, Designs and Patents Act 1988. All rights reserved. No part of this book may be reprinted or reproduced or utilised in any form or by any electronic, mechanical, or other means, now known or hereafter invented, including photocopying and recording, or in any information storage or retrieval system, without permission in writing from the publishers. Trademark notice: Product or corporate names may be trademarks or registered trademarks, and are used only for identification and explanation without intent to infringe. British Library Cataloguing in Publication Data A catalogue record for this book is available from the British Library Library of Congress Cataloging in Publication Data Names: Brink, Adri van den, editor. Title: Research in landscape architecture : methods and methodology / edited by Adri van den Brink, Diedrich Bruns, Hilde Tobi, and Simon Bell. Description: New York, NY : Routledge, 2017. | Includes bibliographical references and index. Identifiers: LCCN 2016026543| ISBN 9781138020924 (hardback : alk. paper) | ISBN 9781138020931 (pbk. : alk. paper) | ISBN 9781315396903 (ebook) Subjects: LCSH: Landscape architecture--Research--Methodology. Classification: LCC SB469.4 .R47 2017 | DDC 712.072--dc23 LC record available at https://lccn.loc.gov/2016026543 ISBN: 978-1-138-02092-4 (hbk) ISBN: 978-1-138-02093-1 (pbk) ISBN: 978-1-315-39690-3 (ebk) Typeset in Frutiger by HWA Text and Data Management, London.
(5) Review Copy – Not for Redistribution Eckart Lange - Department of Landscape, The University of Sheffield - 01/06/2017. Contents. List of figures List of tables List of contributors Introduction. vii ix x 1. Adri van den Brink, Diedrich Bruns, Simon Bell and Hilde Tobi. Part I: Raising awareness 1 Advancing landscape architecture research. 9 11. Diedrich Bruns, Adri van den Brink, Hilde Tobi and Simon Bell. 2. A process approach to research in landscape architecture. 24. Hilde Tobi and Adri van den Brink. Part II: Setting the stage 3 The role of theory. 35 37. Ian H. Thompson. 4. The relationship between research and design. 54. Sanda Lenzholzer, Ingrid Duchhart and Adri van den Brink. 5. The challenge of publication. 65. Maggie Roe. 6. Assessing research priorities and quality. 85. Jurian Meijering, Hilde Tobi, Adri van den Brink and Diedrich Bruns. Part III: Selected approaches and methods 7 Case studies. 103 105. Simon Swaffield. v .
(6) Review Copy – Not for Redistribution Eckart Lange - Department of Landscape, The University of Sheffield - 01/06/2017 Contents . 8. Landscape biography. 120. Jan Kolen, Hans Renes and Koos Bosma. 9. Social media. 136. Ron van Lammeren, Simone Theile, Boris Stemmer and Diedrich Bruns. 10 Virtual environments. 161. Sigrid Hehl-Lange and Eckart Lange. 11. Walking. 179. Henrik Schultz and Rudi van Etteger. 12. Design guidelines. 194. Martin Prominski. Part IV: Addressing SOME OF the grand challenges 13 Cultural landscape meanings and values. 209 211. Ken Taylor. 14. Landscape and health. 235. Catharine Ward Thompson. 15. Thermally comfortable urban environments. 263. Robert D. Brown and Terry J. Gillespie. 16. The urban water challenge. 285. Antje Backhaus, Ole Fryd and Torben Dam. . Index. 307. vi .
(7) Review Copy – Not for Redistribution Eckart Lange - Department of Landscape, The University of Sheffield - 01/06/2017. Figures. 1.1 1.2 1.3 1.4 5.1 6.1 6.2 7.1 7.2 7.3 7.4 7.5 9.1 9.2 9.3 9.4 9.5 10.1 10.2 10.3 10.4 10.5 10.6 10.7 10.8 11.1 11.2 12.1. Three aspects of doing research Research process overview Conceptual research design Technical research design Overlapping fields of value and sources of theory in landscape architecture The general procedure of a Delphi study Overview of the systematic review sampling process Theoretical cases – different types of small town on a tourism circuit Within-case and cross-case comparisons Multiple perspective analyses of a single complex case – two examples Embedded geographical cases Cases based on types Transdisciplinary framework with social media interface Extended transdisciplinary framework with interaction typology Detail of a map of public input to landscape assessment with descriptive texts Identified hotspots (above) and tourist route densities (below) Effect of spatial granularity on level of detail The path in the virtual model Still images of the status quo and the three scenarios and five viewpoints Filmstrip representing the animated walkthrough Participant’s ratings of four different landscape scenarios, dynamic walkthroughs versus static images Long-term forest management plan indicating the year when felling takes place Setup of the participatory workshop using 3D visualisation Static images of the four landscape models represented through five images along the path Stakeholders’ ratings of different representation media Interplay of three walking modes The schematic model of the CSM method ‘River. Space. Design.’ Design guidelines are organised in five groups of design strategies. 15 17 19 21 69 87 92 110 111 112 113 114 139 140 143 150 152 165 165 166 167 170 171 172 174 184 188 198. vii .
(8) Review Copy – Not for Redistribution Eckart Lange - Department of Landscape, The University of Sheffield - 01/06/2017 List of figures . 12.2 ‘River. Space. Design.’ Three design tools from the design strategy ‘A1-Linear spatial expansion’ 12.3 The design guideline system of high-bay racking in the project on shrinking cities 12.4 Diagram of the research method or process to develop design guidelines 13.1 Planning model for heritage conservation management policy 13.2 Location of Wingecarribee Shire 13.3 Wingecarribee Study Model 13.4 Throsby Park, a painting by Conrad Martens 13.5 Present day view of Throsby Park 13.6 Paddock showing nineteenth century ridge and furrow plough marks 14.1 Quality of Life (QOL) predicted by various factors 14.2 Number of participants in each part of the study 14.3 Logic model of a longitudinal approach to study design 14.4 An example of two of the option tasks in the questionnaire 15.1 A small LI-COR pyranometer can be used to measure incoming solar radiation in open areas 15.2 A Kipp & Zonen CNR1 15.3 A radiation shield should always accompany temperature and humidity sensors to eliminate radiation error 15.4 An anemometer with three cups 15.5 A typical set-up of microclimate instruments 16.1 Sketch by Sven Ingvar Anderson (1994) showing the spiral of the design process 16.2 Conceptual framework, outlining variations in research approaches relevant to research on the urban water challenge 16.3 Diagram of the design process 16.4 Set-up of the design experiment 16.5 How the three studies presented in Chapter 16 differ in focus and research approach 16.6 The different roles of the researcher in the three studies presented in Chapter 16. 199 201 203 220 225 227 229 229 230 239 246 249 251 268 270 272 276 278 287 289 295 297 300 301. viii .
(9) Review Copy – Not for Redistribution Eckart Lange - Department of Landscape, The University of Sheffield - 01/06/2017. Tables. 1.1 4.1 5.1 5.2 5.3 6.1 6.2 6.3 6.4 6.5 6.6 6.7 6.8 6.9 9.1 9.2 9.3 13.1 13.2 13.3 15.1 16.1 16.2 16.3. Research proposal checklist Overview of types of RTD Standards for assessing the quality of research Methods reporting: survey of papers in 2009 published in Landscape Research Emerging themes from the Landscape Forward Symposium, 18 March 2015 Percentage of experts that selected each research domain as ‘most important’ or ‘most useful’ in round 3 of the Delphi study Search query applied in SCOPUS Percentage of empirical papers reporting a research objective, question or hypothesis Percentage of empirical papers reporting a research objective or question focused on a retrospective, prospective or present timeframe Percentage of empirical papers explicitly reporting the use of a case study, experiment or other study design Percentage of empirical papers reporting the use of a random or non-random sampling method Percentage of empirical papers reporting the use of various data collection methods Percentage of empirical papers reporting the quantitative and qualitative analysis of data Percentage of empirical papers related to a particular research domain Semantic analysis of the messages Distribution of the harvested photos Overview of invalid Flickr photos Examples of heritage value typologies Example landscape characteristics for rural landscapes Example landscape characteristics for urban landscapes Information for estimating temperature increase due to UHI Main characteristics of the three studies presented in Chapter 16 Five key parameters selected for project analysis and comparison Key themes and recommendations identified from the authors’ general knowledge of LSM design aspects. 14 60 71 74 79 89 91 94 94 94 95 96 97 98 146 149 151 216 223 223 274 291 292 298. ix .
(10) Review Copy – Not for Redistribution Eckart Lange - Department of Landscape, The University of Sheffield - 01/06/2017. Contributors. Antje Backhaus is assistant professor in landscape architecture at the University of Copenhagen, Denmark. Her research and teaching interests include green urban infrastructure, water sensitive cities and specifically the use of participatory- and design-based research methods on the interface between research and practice. Besides her work at the University, Antje is a partner in the landscape architecture office gruppe F Landschaftsarchitekten in Berlin. Simon Bell is professor and head of the Department of Landscape Architecture at the Estonian University of Life Sciences and associate director of the OPENspace Research Centre in the Edinburgh School of Architecture and Landscape Architecture (ESALA), University of Edinburgh, UK. He is also president of the European Council of Landscape Architecture Schools. His research interests currently focus on the relationship between landscape and health, especially forests and blue space. Koos Bosma (1952–2015) was professor of architectural history and heritage studies at VU University Amsterdam, the Netherlands. He was an expert on the history of urban space and European planning history. His other interests included the role of heritage in spatial design. He sadly passed away on 10 September 2015, but his personality, attitude and work will inspire his colleagues in the Netherlands (and abroad) for many years to come. Robert D. Brown is professor of landscape architecture at Texas A&M University. His research focuses on microclimatic design. He models and measures urban microclimates and applies this work to understanding how design of urban environments modifies microclimates, and how microclimates affect the thermal comfort of urban residents. Diedrich Bruns is professor and chair of landscape planning and land use at Kassel University, Germany. He has many years of experience in planning practice and research. Current teaching and research interests are in participatory planning methods, particularly with respect to inclusiveness and early public involvement. Torben Dam is an associate professor in landscape design at the University of Copenhagen, Denmark. His teaching and research interests are landscape architecture, design and detailing with a focus on the design process and the exchange between design and knowledge.. x .
(11) Review Copy – Not for Redistribution Eckart Lange - Department of Landscape, The University of Sheffield - 01/06/2017 List of contributors . Ingrid Duchhart is a senior researcher at Wageningen University, the Netherlands, with longstanding teaching experience in (strategic) landscape planning and design and with practical experience in transformative co-design and network governance, landscape architecture research methods, emerging economies and disaster management, adaptivity and nature-based solutions and climate change. Ole Fryd is a lecturer in urban and environmental planning at the University of Melbourne, Australia. His teaching and research interests include water sensitive cities, collaborative knowledge creation and urbanisation in developing countries. Terry J. Gillespie is professor emeritus in the School of Environmental Sciences at the University of Guelph in Ontario, Canada. His research and teaching interests centre on the measurement and modelling of microclimates. He applies his interests in microclimatology to agriculture and to methods of evaluating human comfort in outdoor environments. Sigrid Hehl-Lange is a research fellow in the Department of Landscape at the University of Sheffield, UK. Through her research projects, including a senior Marie-Curie fellowship, she has gained considerable experience in using virtual landscapes in a decision-making context. Jan Kolen is professor of landscape archaeology and cultural heritage at Leiden University, the Netherlands, and the director of the Centre for Global Heritage and Development of Leiden University, Delft University of Technology and Erasmus University Rotterdam. His research interests include the long-term history of landscapes (‘landscape biography’), the evolution of human niche construction, and the value and role of environmental heritage in landscape design and urban planning. Eckart Lange is a professor at the Department of Landscape at the University of Sheffield, UK. His research focuses on how digital methods in landscape and environmental planning can influence anthropogenic landscape change. Sanda Lenzholzer is an associate professor in the landscape architecture group of Wageningen University. She was trained as a landscape architect and urban designer in international practice and specialised in urban climate matters during her academic career. In her teaching and research she focuses on climate responsive design and the relation between research and design, specifically research through designing (RTD). Jurian Meijering is a PhD candidate and lecturer within the research methodology group at Wageningen University, the Netherlands. As a lecturer he has taught various courses in research methodology. His PhD project focuses on the use of the Delphi method as well as the application of the method to the development of urban sustainability rankings. Martin Prominski is professor and chair of Designing Urban Landscapes at Leibniz University Hannover, Germany, and a registered landscape architect. For many years he has been working on the interfaces between research, theory and practice. His current interests are in design. xi .
(12) Review Copy – Not for Redistribution Eckart Lange - Department of Landscape, The University of Sheffield - 01/06/2017 List of contributors . research strategies, qualification of urban landscapes, and concepts of nature and culture in the Anthropocene. Hans Renes is historical geographer at Utrecht University and professor of heritage and planning at VU University Amsterdam, the Netherlands. He has a background in human geography (Utrecht University) and rural planning (Wageningen University). His main interests are landscape history and the relationships between heritage and planning. He has published extensively on the history of the cultural landscapes of Europe. Maggie Roe is a senior lecturer at the School of Architecture, Planning and Landscape at Newcastle University, UK. Her research focus is generally on landscape planning and sustainability, particularly related to participatory landscape planning, cultural landscapes and landscape change. She is an editor of the international peer-review journal Landscape Research and has considerable experience in reviewing research proposals, grants, papers and books. Henrik Schultz is co-founder of Stein+Schultz, a lecturer at Leibniz University Hannover and a researcher at Studio Urbane Landschaften. He has many years of experience of research and design projects for sustainable landscapes and of methods of exploring and understanding landscapes. His current main interest is the role of bodily engagement in landscape transformation. Boris Stemmer is professor and chair of landscape and recreation planning at the University of Applied Science Ostwestfalen-Lippe, Germany. He earned his PhD with a thesis on landscape assessment methods in Germany. His current research interests are participatory planning methods especially for renewable energies as well as landscape as a resource of happiness, well-being and health. Simon Swaffield is professor of landscape architecture at Lincoln University, New Zealand. His research and scholarship is focused upon governance and planning of rural and peri-urban landscapes undergoing rapid change and upon the development of theory and research methodology in landscape architecture. Ken Taylor is an adjunct professor in the Centre for Heritage and Museum Studies, at the Australian National University, Canberra; emeritus professor of landscape architecture, the University of Canberra; and visiting professor at Silpakorn University, Bangkok. He has been teaching and researching in the field of cultural landscapes since the mid-1980s and more recently with a particular focus on urban cultural landscapes, particularly in Asia. Simone Theile is a lecturer and researcher in the Department of Landscape Planning and Land Use at Kassel University, Germany. Her research focus is on planning theory, participatory planning methods and on communication and protest organisation in social media in the context of planning projects. Ian H. Thompson is reader in landscape architecture in the School of Architecture, Planning and Landscape at Newcastle University, UK, where his research has mostly been within the fields of landscape design history and theory.. xii .
(13) Review Copy – Not for Redistribution Eckart Lange - Department of Landscape, The University of Sheffield - 01/06/2017 List of contributors . Hilde Tobi is associate professor and coordinator of the research methodology group at Wageningen University. She has many years of research experience in medical, social and environmental sciences. Her current main research and teaching interest is methodology for interdisciplinary research. Adri van den Brink is professor and chair of landscape architecture at Wageningen University, the Netherlands. Before that he worked as a landscape planner, research manager and policy advisor in public service, and as a professor of spatial planning, also at Wageningen University. In his research and teaching he explores the relationship between design and research. Rudi van Etteger is assistant professor of landscape architecture at Wageningen University, the Netherlands. Trained both as a landscape architect and a philosopher, his research is aimed at exploring the theoretical foundations of landscape design. His main focus is on the aesthetics of designed landscapes. Ron van Lammeren is associate professor of geo-information science at the Laboratory of Geoinformation Science and Remote Sensing at Wageningen University, the Netherlands. In his research and teaching he pays attention to the role of geo-information in planning and design of landscape and environment, especially the nature and impact of visual representations of locational data ensembles in participatory planning and design processes. Catharine Ward Thompson is professor of landscape architecture and director of OPENspace Research centre at the Edinburgh School of Architecture and Landscape Architecture (ESALA), University of Edinburgh, UK. Her research on inclusive access to outdoor environments and environment–behaviour interactions has informed government, public agencies and the World Health Organization (WHO). She teaches a master’s programme on landscape and well-being.. xiii .
(14) Review Copy – Not for Redistribution Eckart Lange - Department of Landscape, The University of Sheffield - 01/06/2017.
(15) Review Copy – Not for Redistribution Eckart Lange - Department of Landscape, The University of Sheffield - 01/06/2017. Chapter 10: Virtual environments Sigrid Hehl-Lange and Eckart Lange. Introduction Virtual environment technology has great promise to be used for purposes of basic and applied research in the wider field of the planning and design disciplines in general and in landscape planning and landscape architecture in particular. Virtual environments can be broadly characterised as computer-generated, three-dimensional environments providing interactivity and immersion (cf. Gaggioli 2001). Virtual environments are used for static or dynamic landscape representations; they are in essence descriptive and synthetic models of real environments, and they typically focus on external representation (Ervin 2001; Deming and Swaffield 2011, p.89). In order to represent possible future landscape developments, as required in all forms of landscape planning and design, virtual environments need to be linked to a simulation model, or they might follow a normative scenario approach with a particular target concerning, for example, environmental, social, economic and cultural factors (cf. Börjeson et al. 2006). In experimental settings, such as presented in this chapter, virtual environments are modelled to give participants the experience of computer-synthesised landscapes. In landscape planning and design static scenes are commonly used (e.g. Downes and Lange 2015). In addition, animated walks or sequences are increasingly utilised in order to enhance communication with stakeholders. In the first experiment presented here, people are invited to go on a virtual walk that follows a path leading through an agricultural landscape; alternative scenarios of future landscape development are presented and rated using preference scores. In the second experiment a mix of quantitative and qualitative approaches is pursued to investigate how real-time virtual landscape models might be used in a participatory setting, such as a stakeholder workshop (see also Stokols 2011; Schroth et al. 2011). Sophisticated visualisation has become increasingly important in the context of participatory planning and designing of landscapes. At policy level the foundations for democratic and bottomup decision making include the Rio Declaration on Environment and Development (1992), the Aarhus Convention on Access to Information, Public Participation in Decision-Making and Access to Justice on Environmental Matters (1998) and, most prominently for the field of landscape, the European Landscape Convention (2000). Much is still waiting for public involvement to have greater impact on planning and design practice (Lane 2005, p.283). Resulting from increasing demands for experts to transparently communicate with members of the public, we need to have more research in three dimensional (3D) landscape visualisation to support planning and design processes.. 161 .
(16) Review Copy – Not for Redistribution Eckart Lange - Department of Landscape, The University of Sheffield - 01/06/2017 Sigrid Hehl-Lange and Eckart Lange . In the remainder of this chapter, a short history of visualisation techniques in landscape architecture is given, concluding with the current status of research in landscape architecture that employs virtual environment technology. Then, a conceptual framework is provided upon which virtual environment research might be based. Two detailed examples of research using virtual environment technology in an experimental setup are presented and discussed. Finally, the chapter identifies directions for improving the way that virtual environment supported research in landscape architecture can contribute to knowledge building of the discipline. History of virtual environments in landscape architecture Research in landscape visualisation and related fields has advanced considerably in the previous decades. The turning point in terms of methods and approaches came during the late 1980s and early 1990s. It was then when the shift from analogue to digital techniques started to take effect. Before that time, landscape architects and planners communicated their ideas mainly by using hand-drawn sketches and perspectives or physical models (e.g. Markelin and Fahle 1979). During the early ages of digital 3D landscape imagery several major issues had to be tackled. First, hardware that could deal with complex graphics was very expensive (Danahy and Wright 1988) and such graphics still were far from real time. Second, software specifically dedicated to landscape visualisation purposes was largely missing (as e.g. in Orland et al. 2001). Third, the relatively small number of trained experts in this domain was a limiting factor (see Lange 2002, p.14). As a result, digitally rendered visualisation was, at best, used as a tool for a crude visual representation of landscape and landscape change (e.g. Nickerson 1979), or purely for visualising the results of a planning process. At the same time, digital 3D visualisation was not yet appreciated as a methodological opportunity that could potentially enhance landscape planning and designing together. However, landscape architecture soon made great progress in 3D modelling and visualisation. Within a relatively short period of time the field has come a long way: starting with the laborious production of static images, either through digital photomontages (Vining and Orland 1989) or, more sophisticated, through digital modelling of 3D environments (Hehl-Lange and Lange 1993) visualisation has, particularly with the advancement of real-time visualisation software, become more and more interactive (Danahy 2001). As a result, new opportunities arose for landscape architects to be better prepared to engage with the public in planning and design. Currently, research in virtual environments includes investigating multiple use of virtual reality models for on-site display on mobile devices (Gill and Lange 2015), novel approaches in augmenting the real world with digital 3D data (Haynes and Lange 2016) and studying the effects of multi-sensory environments on user perception (e.g. Lindquist et al. 2016). Conceptual framework Landscape architects are challenged by both the need to involve different stakeholders in planning and design, as well as wishing to establish linkages between participatory methods with 3D landscape visualisation. Provided that stakeholders have been properly identified (through systematic stakeholder analysis) and invited, the main research question that needs answering in this context is: ‘How should visualisations be prepared and presented for stakeholder involvement?’ (see e.g. Scottish Natural Heritage 2014).. 162 .
(17) Review Copy – Not for Redistribution Eckart Lange - Department of Landscape, The University of Sheffield - 01/06/2017 Virtual environments . The particular research gaps we are addressing in this chapter relate to the experience of dynamic movement through virtual environments. While static visualisations have a predetermined viewpoint, virtual environments offer opportunities for users to move around and explore their virtual surroundings. Gibson (1979), in his ‘Ecological Approach to Visual Perception’, underlines how important it is for people to be looking around and moving about. He argues that we normally perceive the world dynamically and that human perception is not confined to a particular frame of view (see e.g. Nassauer 1995). Any person exploring real environments is used to being able to move freely in and through the space and to view whatever attracts their attention. When it comes to virtual environments, there is a need to learn how ‘real’ people experience and explore them. We must, through research, also try to better understand how such experience can affect decision making, particularly from a planning and design perspective. Humans experience their daily environment while in motion (see e.g. Burckhardt 2006; Thwaites and Simkins 2007). Heft and Nasar (2000) point out three important aspects of our visual perception while in motion. The optical flow causes a streaming of features from a centre of expansion in the field of view accompanying forward movement. Motion parallax stands for the rates of ‘movement’ of static objects as a function of their relative distances from the perceiver. This means near objects seem to move faster than far objects. Through occlusion objects are gradually covered and uncovered while in motion. Considering an experience of space while in motion is typically not explicitly taken into account in planning and design. However, there are a number of famous Chinese examples, for example the Garden of the Master of Nets in Suzhou (see Henderson 2012) and Japanese parks including, for example, Katsura Imperial Villa and Shugaku-in Imperial villa in Kyoto, that are designed especially to be experienced in a sequential way (see Johnson 2003). Similarly, in the English landscape style there are purposefully designed vistas, which open up to visitors, in sequence, when driving or walking through a park. A more recent example where the notion of movement, in this case in architectural space (Samuel 2010), is taken explicitly into account is Le Corbusier’s concept of the ‘promenade architecturale’. In previous research studies Appleyard et al. (1966) analysed the perception of car drivers along a highway by using a set of photographs or perspective sketches combined with written descriptions of this sequential experience. In the Berkeley Environmental Simulation Laboratory (Appleyard and Craik 1978) a miniature endoscopic camera was used that was hung from overhead gantries. This setup gave users freedom of movement through the physical model of central San Francisco at eye level. Building on such research involving analogue technology in the planning and design disciplines the research described in the next section looks into the effects of static versus dynamic representation in virtual environments. Comparison of dynamic movement and static representation in an experimental setting Research question and hypothesis The aim of the study is to better understand which effect different visualisation modes (i.e. static or dynamic) have on landscape evaluation and on people’s assessment of scenarios of future landscapes. The main research question in this experiment is: ‘Does the way of exposure to a landscape have an effect on how landscape is rated?’ The underlying hypothesis is that scores will differ when people are experiencing static images in comparison to dynamic sequences.. 163 .
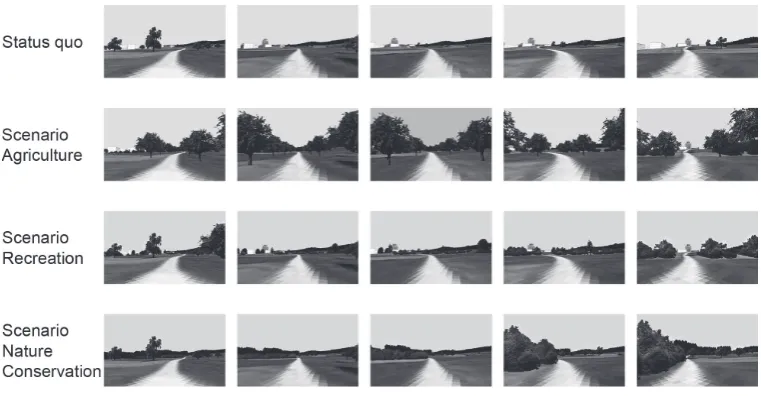
(18) Review Copy – Not for Redistribution Eckart Lange - Department of Landscape, The University of Sheffield - 01/06/2017 Sigrid Hehl-Lange and Eckart Lange . A virtual walk through different landscape scenarios: the Zürich case study For the purpose of this experiment we aimed at exposing participants to a virtual walk allowing navigation in real time. The virtual walk takes participants along a path leading through a rural landscape at the urban fringe near the university campus of ETH Zürich-Hönggerberg, Switzerland. The status quo is a farmed open space with a few fruit trees scattered about the fields and meadows. In addition to the status quo, three scenarios of possible future landscape change were developed: ‘agriculture’, ‘recreation’ and ‘nature conservation’ (see Lange et al. 2008). In the scenario ‘agriculture’ all of the fruit trees within the fields and meadows are removed, and instead fruit trees are newly planted at the edges of the plots and along the paths crossing the farmland. In the scenario ‘recreation’ additional single trees and new hedges of variable height and length have been added, compared to the status quo. The main feature of the scenario ‘nature conservation’ is a large new forest that could function as a wildlife corridor between the currently disconnected forests located east and west of the campus. Additionally, for the ‘nature conservation’ scenario, a new wetland with a buffer of shrubs is also created.. The visual stimuli The virtual model was constructed using Polytrim visualisation software from the Centre for Landscape Research at the University of Toronto (e.g. Danahy and Hoinkes 1995). The model consists of a digital terrain model with a draped orthophoto at a resolution of 0.5 metres (m). 3D objects such as ETH Zürich-Hönggerberg buildings and vegetation were visualised with geo-specific textures.. Static images The status quo and each of the three scenarios were represented with five still images (identical to the respective frames in the animations) spread evenly along a public path (Figures 10.1 and 10.2) including the start and endpoints. Thus, in total, the participants saw 20 images.. Dynamic walkthroughs For the status quo and each of the three scenarios, participants were presented with an animated sequence (Figure 10.3) of 60 seconds duration consisting of 856 single frames, leading viewers along an identical path of 131 m in length. This frame rate still provides fluid motion. The speed of the animation is equal to 7.8 kilometres/hour (km/h) which corresponds to the speed of a jogger or a slow cyclist (cf. Teknomo 2002).. Study participants The participants in the experiment (n=62) were recruited from the Department of Landscape at the University of Sheffield. The sample included staff as well as graduate and doctoral students. The participants were deliberately chosen for their unfamiliarity with the landscape they were going to be exposed to during the experiment, thus avoiding potential effects related to local knowledge.. 164 .
(19) Review Copy – Not for Redistribution Eckart Lange - Department of Landscape, The University of Sheffield - 01/06/2017 Virtual environments . Figure 10.1 The path in the virtual model. The numbers indicate the locations of the five viewpoints of the still images. Figure 10.2 Still images of the status quo and the three scenarios and five viewpoints. 165 .
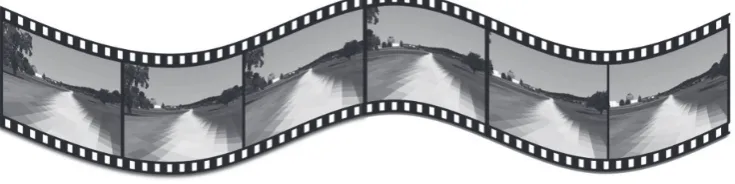
(20) Review Copy – Not for Redistribution Eckart Lange - Department of Landscape, The University of Sheffield - 01/06/2017 Sigrid Hehl-Lange and Eckart Lange . Figure 10.3 Filmstrip representing the animated walkthrough. Study design and protocol Before the experiment started all participants received a participant information sheet and a short questionnaire (four questions) to record their scores. The participants were briefly introduced to the task of rating a set of images or walkthroughs showing a virtual representation of an agricultural landscape at the urban–rural fringe of the City of Zürich, Switzerland. The actual purpose of the study, the comparison of static versus dynamic mode of representation, was not revealed. Neither was it mentioned to the participants that they would be looking at different scenarios for the same landscape. The participants were split up randomly into five separate groups (12–13 persons per group). One group saw the static images only. Each of the four other groups saw one of the walkthroughs only, that is one of the three scenarios or the status quo. No group saw more than one set of stimuli. As a warm-up for the group looking at the static scenes, four images from within the virtual model were shown. These four images were not considered for the results of the experiment. As a warm-up for the four groups looking at the sequences, an animation along a public footpath within the same landscape model was shown. This animation was not rated in the experiment. All images were shown with a data projector on a projection wall (approx. 3 m x 2 m). Each of the static images was shown for 30 seconds. During this time the participants ticked the boxes with their respective scores. To avoid an ordering effect the images were shown in random order. The walkthroughs were presented in real time using a laptop and a data projector. After seeing the walkthrough once, participants responded to all four questions. Participants were using a verbally anchored five-point rating scale, ranging from very little (1) to very much (5). For each of the 20 images the same questions (addressing preference) were asked: • •. How much do you like this landscape? Would you enjoy walking in this landscape?. After all participants rated all of the images, two further questions (addressing orientation) referring to the entire set of images were asked: • •. To what degree do the images help you to envisage the landscape? To what degree do the images help you to understand where you are in the landscape?. 166 .
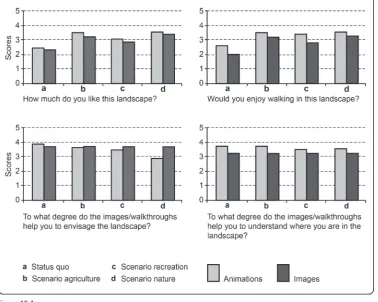
(21) Review Copy – Not for Redistribution Eckart Lange - Department of Landscape, The University of Sheffield - 01/06/2017 Virtual environments . As the participants were not familiar with the site, assigning scores for orientation when just looking at single images is impossible. Thus, for the last two questions the whole set of images was scored. For each of the four animations the same four questions (as above) were asked, that is questions referring to walkthroughs instead of images. Results The results are looked at in terms of representation type (walkthrough vs static) and in terms of the ratings of the status quo and the three scenarios. For the questions ‘How much do you like this landscape?’ and ‘Would you enjoy walking in this landscape?’ (Figure 10.4), the scores obtained for the walkthroughs are consistently higher than those given for the images. The difference in the scoring ranges from 0.14 (status quo, 2.46 vs 2.32) to a maximum of 0.62 (scenario ‘recreation’, 3.42 vs 2.8). As mentioned earlier, the questions ‘To what degree do the images / walkthroughs help you to envisage the landscape?’ and ‘To what degree do the images / walkthroughs help you to understand where you are in the landscape?’ (Figure 10.4) were asked after one group of participants saw all images. This is why the values for the images across the scenarios are the same. For the question ‘To what degree do the images / walkthroughs help you to envisage the landscape?’, with the. Figure 10.4 Participant’s ratings of four different landscape scenarios, dynamic walkthroughs versus static images. 167 .
(22) Review Copy – Not for Redistribution Eckart Lange - Department of Landscape, The University of Sheffield - 01/06/2017 Sigrid Hehl-Lange and Eckart Lange . exception of the status quo, the walkthroughs scored lower in the other three scenarios than the images. For the question ‘To what degree do the images / walkthroughs help you to understand where you are in the landscape?’, the walkthroughs scored consistently higher than the images. The scores for the individual scenarios regarding the questions addressing preference, ‘How much do you like this landscape?’ and ‘Would you enjoy walking in this landscape?’, show highest ratings for the scenario ‘nature conservation’, followed by the scenario ‘agriculture’ and then the scenario ‘recreation’, with the status quo scoring the lowest. Animations of individual scenarios consistently receive higher scores than static images. Regarding the two questions addressing orientation there is no clear pattern of scores for animations versus static images. Discussion The way visualisations are presented, that is static images or dynamic walkthroughs, has an effect on ratings for landscape preference and on people’s assessment of scenarios of future landscapes. Given the setup, the experiment could be conducted in a timeframe of approximately 15 minutes. Such a relatively short duration keeps the attention levels of the participants high and prevents fatigue, which is known to potentially have an effect on the results (Rathod and La Bruna 2005; Galesic and Bosnjak 2009). As the images were shown in random order and not identified as part of a particular scenario, it was not recognisable for the participants that the images were part of different scenarios. Also, because the static images were shown randomly and the sequences only once to one set of participants, it was possible to exclude an ordering effect. The disadvantage is that one needs a relatively large number of participants for the overall number of responses generated, that is there are rather low participant numbers (12–13 per test set), but this was accounted for by the rather homogenous composition of the participants. In terms of ranking the status quo and the three scenarios, the scoring pattern for the two landscape preference questions is fairly consistent (i.e. either as walkthroughs or as static images) with the scenario ‘nature conservation’ receiving the highest scores. Regarding the two questions addressing orientation in the model, there is a slight tendency that walkthroughs score higher, but the results do not support a conclusion that either of the two modi is better than the other. The reason for this could be a slight ambiguity in the phrasing of the question: that is ‘To what degree do the images / walkthroughs help you to envisage the landscape?’ is perhaps rather similar to ‘understand where you are’. On the other hand it may well be the case that a static image is better for focussing on particular features in order to envisage the landscape. Animations resemble walking. This might explain the comparatively large differences between high scores for walkthroughs and lower scores for images when asked ‘would you enjoy walking in this landscape?’ There are some important factors with a likely influence on the results that merit further research investigation. It would be interesting, for example, to repeat the same experiment with people from different backgrounds (e.g. laypeople only) and with larger numbers. There is a potential effect of comparing a predetermined path (as in this example) with a freely navigable environment. The predetermined movement itself, without free navigation, does not seem to be sufficient to support the assumptions used in the theory of ecological perception (Gibson 1979). Also, the length of the path or the duration of the experience could play a role. Another important factor could be connected to the complexity of the landscape that is studied, especially when it comes to the questions that relate to navigation and orientation.. 168 .
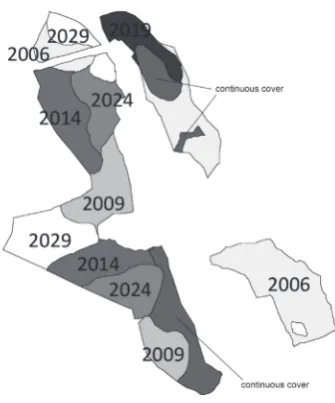
(23) Review Copy – Not for Redistribution Eckart Lange - Department of Landscape, The University of Sheffield - 01/06/2017 Virtual environments . Further research is also needed in comparing an image to a walkthrough in a truly immersive environment in 3D that is freely navigable. There have been a number of examples in which immersive and dynamic visualisation with a public participation approach is applied to real-world case studies (e.g. Orland and Uusitalo 2000; Stock and Bishop 2002; Danahy 2005). But, to date, there is still a considerable gap in empirical research in investigating whether people respond in a ‘natural’ way when moving or driving through a virtual model, considering sequential and/or immersive experiences in the landscape. Participatory stakeholder workshop with freely navigable virtual environments: the Alport Valley case study In this study the Alport Valley forest landscape management project in the Peak District National Park (UK) is used as a real-world case in order to look into the potential use of immersive and freely navigable virtual environments, as opposed to predetermined animation paths, when engaging with stakeholders. A time series of future landscapes was developed from a forest management plan and translated into 3D visualisation models. These were explored and assessed in two stakeholder workshops in an immersive environment facility supporting 3D vision. The Alport Valley is a steep sided valley carved into the upland gritstone plateau of the Dark Peak area of the Peak District National Park, which was established in 1951 as the first national park in the UK. While the surrounding upland plateau is very exposed and without any trees, in contrast, the Alport Valley is a sheltered and forested landscape. It is one of the largest and essentially ‘trafficfree’ valleys in the Peak District and has therefore an important function of tranquil enjoyment for walkers and hikers. As a result of policies to provide the UK with a strategic timber reserve (see e.g. Essex 1990), mostly in the first half of the twentieth century dense coniferous forests dominated by non-native species including Sitka Spruce (Picea sitchensis (Bong.) Carrière), with smaller stands of Japanese Larch (Larix kaempferi (Lamb.) Carrière), Lodgepole Pine (Pinus contorta Dougl. Ex Loud.) as well as native Scots Pine (Pinus sylvestris L.) were planted for fast growth. Not only are large areas dominated by non-native trees in conflict with the notion of a national park in general, nowadays forest policies also take into account the social and landscape benefits as well as benefits for plant communities and wildlife. Because of the overall unique landscape character, initial proposals for large scale timber extraction, including the construction of suitable access roads for heavy timber trucks, caused major opposition. Subsequently, a joint planning approach integrating the key stakeholders and landowners as well as the views of the public was pursued. As a result of the collaboration among the stakeholders the Alport Valley management plan (Figure 10.5) was developed. This includes unconventional measures such as trees felled to rot on site as well as ring-barking of trees (see Lange and Hehl-Lange 2010a). Both measures had been introduced because of the predicted impact on the tranquil valley associated with the removal of the logged trees and construction of new access roads. In line with forests requiring adaptation to climate change, the overall aim is to establish native woodlands mostly by natural regeneration through the preservation of individual native seed trees and partly if necessary through active plantings and seeding with material of local provenance. This process will take place in a period spanning several decades.. 169 .
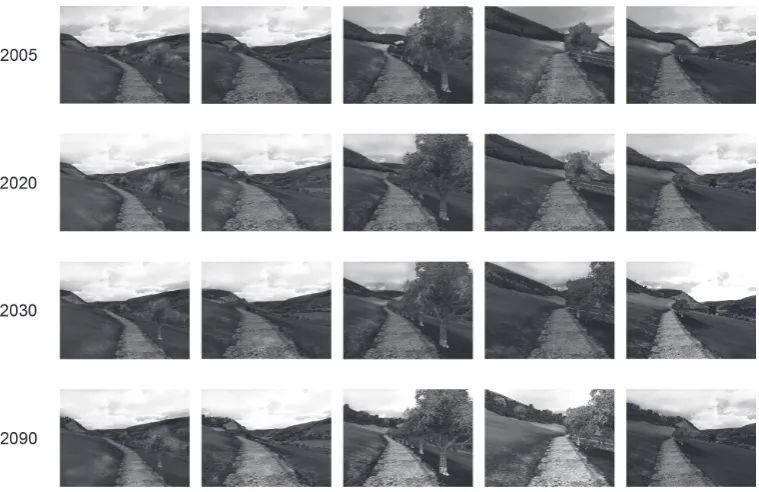
(24) Review Copy – Not for Redistribution Eckart Lange - Department of Landscape, The University of Sheffield - 01/06/2017 Sigrid Hehl-Lange and Eckart Lange . Figure 10.5 Long-term forest management plan indicating the year when felling takes place. The visual stimuli Some decades ago Dame Sylvia Crowe used hand-drawn sketches to illustrate forest management options (Crowe 1978). In the Alport Valley example, a virtual landscape model of the valley is constructed that consists of a digital terrain model (DTM), an orthophoto and a range of object types such as trees, dry stonewalls, buildings, paths and the sky as a backdrop. The DTM is based on an original map scale of 1:10,000 and has a resolution of 10 m. The resolution of the orthophoto is 1 m. This orthophoto is draped over the DTM using the visualisation software Simmetry3d. The terrain along the path was edited manually to provide a smooth animation. The geometry of the buildings is constructed in Sketchup. In order to achieve a realistic representation of the built objects they were photographed in the field and their textures applied to the building geometry. Similarly, for the vegetation, a library of geo-specific textures that were acquired on site is used. In addition to the billboards, in prominent locations along the main access to the valley, trees with texture-mapped 3D-geometry (see Paar 2003) were also included. The visualisation of several thousand trees while still being able to move around in real time was a major challenge that required fine-tuning with several iterations of model improvement. The landscape is shown in several stages over time (Lange and Hehl-Lange 2010b): ‘2005’ before forest management activities began, ‘2020’ after harvesting most of the existing woodlands, ‘2030’ when new woodlands have started to be established and ‘2090’ the proposed ‘final state’ with oak–birch woodland. Study participants A key issue for a success in conducting stakeholder workshops as in the example of the Alport Valley is to identify and involve the relevant stakeholders. Also, this ensures that management planning takes into consideration local experience. If the key decision-making parties are involved early there. 170 .
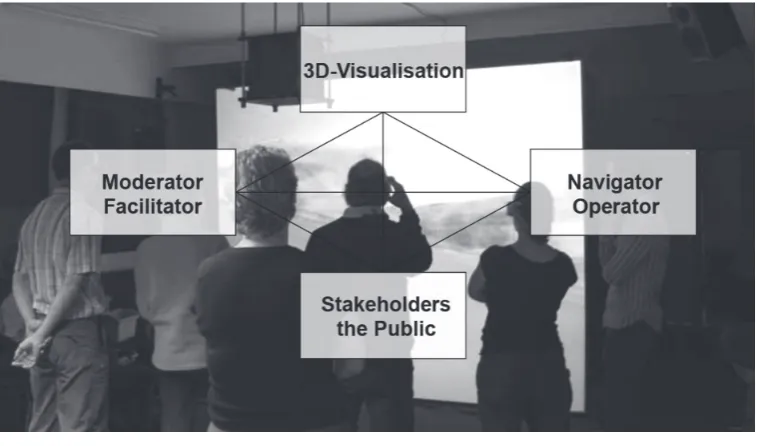
(25) Review Copy – Not for Redistribution Eckart Lange - Department of Landscape, The University of Sheffield - 01/06/2017 Virtual environments . is strong potential for the discussions in stakeholders’ workshops to lead to concrete action on the ground. The relevant stakeholders are the National Trust (the main landowner), the Forestry Commission, the Peak District National Park Authority (PDNPA), the British Mountaineering Council, the Campaign to Protect Rural England (CPRE), Friends of the Peak District and The Kinder and High Peak Advisory Committee. Study design and protocol The workshops were held in the virtual reality studio of the University of Sheffield. To provide unobstructed views for the participants, chairs were placed at the back of the room approximately 3–4 m away from the screen (3 m x 2.5 m) in a semi-circular arrangement. Prior to the actual stakeholder workshops a test run was conducted in order to eradicate any potential issues and provide a smooth operation. An essential requirement is a skilled operator of the system and a moderator guiding and structuring the process (Figure 10.6). In order to keep a record of the workshops, they were recorded with photographs and video. Also, a researcher took written notes during the workshops. A practical hurdle was finding a time slot in which everyone would be available for a workshop. In order to arrange the date a preparatory meeting was held with the main stakeholders, that is the National Trust and the Forestry Commission. Because of the limited availability of the stakeholders it turned out to be impossible to find a joint single slot, and therefore the workshop was conducted twice. In total 11 persons representing different stakeholder groups participated in the workshops. The workshops gave the stakeholders the opportunity to see, for the first time, and in three dimensions, the management plan and the landscape as it would develop over time. Workshop participants were presented with 4 x 5 static images (Figure 10.7). Each of the four landscape models were represented through five images, with five seconds showing time per image and. Figure 10.6 Setup of the participatory workshop using 3D visualisation. 171 .
(26) Review Copy – Not for Redistribution Eckart Lange - Department of Landscape, The University of Sheffield - 01/06/2017 Sigrid Hehl-Lange and Eckart Lange . Figure 10.7 Static images of the four landscape models represented through five images along the path. animations at 20 frames/s leading participants along a stretch of approximately 200 m of the sole access route in the Alport Valley. The speed of 8 km/h corresponds to the pace of a jogger. In addition, participants had the opportunity to explore the virtual environment on their own by using devices such as a joystick as used in computer games and stereo glasses for 3D immersion. After they had seen and explored the virtual environments on their own, participants were asked to fill in a short questionnaire and to answer four questions for which the answers could be given using a five-point rating scale with tick boxes (ranging from ‘not at all’ equalling 1 to ‘very much’ equalling 5). The four questions were: ‘To what degree do the following types of visualisations help you to envisage the landscape?’, ‘To what degree do the following types of visualisations help you to understand where you are in the landscape?’, ‘To what degree do the following types of visualisations help you to understand the visual transformation of the landscape in the future?’ and ‘How helpful are the different visualisations for you to participate in the forest management plan for the Alport valley?’ Results In the second experiment particular focus was put on gathering qualitative feedback (e.g. Lewis and Sheppard 2006; Schroth et al. 2011). When the stakeholders saw the images and the walkthroughs along the pre-recorded animation path they were sitting quietly, focussing and concentrating on the screen. Only a few comments were whispered. The stakeholders were then encouraged to get up from their seats and move towards the screen to try exploring the virtual environment at their own pace and along their own routes. They got a short introduction of how to use the joystick. 172 .
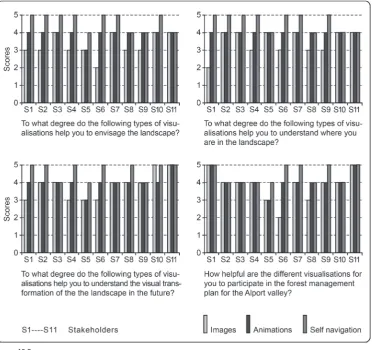
(27) Review Copy – Not for Redistribution Eckart Lange - Department of Landscape, The University of Sheffield - 01/06/2017 Virtual environments . for navigation. In particular, when they moved away from the path and explored the whole valley they engaged much more and spontaneously commented on the visualisations, for example ‘It’s fantastic, this is brilliant’, ‘The river there! That’s actually the view!’, ‘Look, the ridge there!’, that is they were immediately interacting more with the landscape and relating their own experiences and geographic knowledge to what they saw on the screen, or even deliberately going to particular locations that they wanted to explore. In comparison to the still images (‘the still images added very little, whereas the real time navigation was amazing and added real value’) the stakeholders made it clear that the navigation brought the landscape to life (‘captures the visual sensation of being in the valley from different vantage points’), because it gave them a sense of place and scale, expressing a feeling like being in that landscape, as well as a sense of ownership and control as they could explore the landscape freely (‘being able to navigate through the valley was a useful experience’). The visualisations were seen as providing a good representation of how the landscape might look in years to come. Some study participants wanted to see more foreground details including shrubs or bracken as well as boundaries such as fences (‘good to show some more boundaries’) to give more reality to the visualisation. For the majority of the stakeholders a high level of foreground detail was not considered to be important. For them the overall impression of the landscape as a whole is the key factor (‘at the scale of grand landscape the model is at its best’) as well as the ability to show how to manage large landscapes (‘overall it has given me great benefit and understanding on the impacts that the proposed felling and plantation will have’; ‘the visualisation will help to consider whether the landscapes we are working towards will meet our original objectives’; ‘it is an excellent tool to “get over” to people how you intend to manage large landscapes’). For a detailed quantitative analysis the sample with 11 stakeholders is rather small. However, the analysis of the responses shows clear patterns in terms of how the different representation media are rated by the individual stakeholders (Figure 10.8). Also, the results show that the scores overall tend to be between 3 and 5, that is clustering around 4. In general, there is a clear trend for all four questions that the real-time navigation scored higher than the animations, whereas the animations scored either equal or in most cases slightly higher than the images. Depending on the questions, in some cases the stakeholders treat the three representation methods as equal. Discussion The results provide quantitative and also qualitative information of people’s perception regarding the use of static imagery, animations and interactive computer visualisations as a basis for making decisions about future landscapes. All stakeholders participating in the study were directly involved in the Alport Valley management plan. They know this landscape well. Because of their high level of local knowledge and their familiarity with the site they were able to target specific locations they wanted to explore in order to view the landscape from different perspectives. For them, the question about orientation in the landscape, whether it is related to imagery, animations or self-navigation, in statistical terms did not have a distinct discriminatory effect. For the question referring to the role of visualisations for participation in the management plan, for the majority of the stakeholders (6 out of 11) both visualisation approaches resulted in high scores averaging clearly above 4, whereas 5 out of 11 clearly favoured the real-time navigation over images and animations. In particular the open comments. 173 .
(28) Review Copy – Not for Redistribution Eckart Lange - Department of Landscape, The University of Sheffield - 01/06/2017 Sigrid Hehl-Lange and Eckart Lange . Figure 10.8 Stakeholders’ ratings of different representation media. that were gathered beyond the rigidly structured questionnaires, especially when the stakeholders themselves took over and experienced the virtual landscape on their own, gave further insights that would not have been received by only relying on a typical questionnaire format. In terms of scheduling participatory events, a key effort is needed for organising them. This should not be underestimated, and thorough preparation and scripting needs to be done by the hosts. In addition, workshops and surveys need to be approved by the respective ethics committees. All this can take a considerable amount of time and needs flexibility in planning ahead and also in addressing alternatives in terms of timings. When digital landscape visualisations are used as an integral component of the process (e.g. Gill and Lange 2013) this complicates the setup even more. In such a case, because of the interactive nature of the involvement of the public this is very challenging and needs skilled operators and moderators. Detailed choreography is absolutely essential but can only account to a certain degree for the unpredictability of the focus of the aspects investigated when involving the public. While the level of complexity is relatively low when only static landscape visualisations are used, the challenge when using interactive landscape visualisations increases considerably. Also, as a virtual landscape. 174 .
(29) Review Copy – Not for Redistribution Eckart Lange - Department of Landscape, The University of Sheffield - 01/06/2017 Virtual environments . model can be freely explored, it needs a relatively high level of detail throughout (rather than providing detail only along certain routes) which increases rendering time. Compared to a workshop setting that does not rely on interactive 3D landscape models, this needs a skilled operator and a moderator who recognises the role of the visualisation. It also needs participants willing to engage. For digital natives the interactive nature of computer games is something they are used to and probably expect. For novices the moderator will have to be patient and encouraging in order for the workshop participants not to shy away. In the process of the preparation of the management plan, as part of the ongoing stakeholder involvement, the tree felling method was changed to ring-barking. As a result the dead tree trunks will be standing for some years in order to prevent erosion. As a consequence, the virtual model ‘2020’ (after harvesting most of the existing plantations) had to be adapted. Instead of visualising areas where harvested trees were lying on the ground to rot, these areas were populated with trunks of dead trees still standing. In this example dead tree trunks as seen from a distance are displayed as thin lines and when their positions change slightly from each pre-recorded image to the next image flickering appeared in parts of the animations. This was noticed by some of the stakeholders and is a common problem in computer graphics. It does not occur in still images. In forest management long-term planning decisions are made today but they will impact future generations. 3D visualisation gives us the opportunity to decide on the effects of forest management decisions today and to experience what future generations will potentially experience. General discussion and conclusions The setup of both of the experimental studies reported on above was exploratory in nature, and with the experience gained from them we were able to transfer the approaches as role models to other research settings (see e.g. Hehl-Lange et al. 2012; Gill et al. 2013; Hehl-Lange et al. 2015). Decisions to be made in planning and design processes are often complex. This requires sophisticated decision support techniques and favours the use of visual communication techniques that can potentially simplify and explain complex settings and spatial information in order to improve design and decision making. Landscape visualisation not only has the potential to visually communicate spatial characteristics of possible future landscapes to stakeholders, it can also be used to explore conflicting interests by involving the relevant stakeholders early on, for example by adapting models for public involvement such as focus groups, public hearings, round tables, workshops, design charrettes and so on or, further, it could be the basis to integrate adaptive, analytical and systematic approaches (see Milburn and Brown 2003) in research into a design context. Regarding the presentation mode perceived by the user/stakeholder, it seems not so much a question of static (an image) versus dynamic representation (an animation along a predetermined route). The real benefit lies in the possibility to explore virtual environments freely. More than any other form of virtual reality exposure, the self-determined exploration most resembles the behaviour of a real person in a real landscape. Moreover, it may even go beyond real world exposure, as in virtual representations of real environments, a user can easily navigate to, perhaps, otherwise inaccessible locations. The visualisation approaches in the research presented rely on representing the real world through a virtual surrogate. In the future, other approaches are likely to play an important role as. 175 .
(30) Review Copy – Not for Redistribution Eckart Lange - Department of Landscape, The University of Sheffield - 01/06/2017 Sigrid Hehl-Lange and Eckart Lange . well (e.g. Gill and Lange 2013, 2015). In particular, this includes developments for augmenting the real world with textual or graphical data. In combination with increasingly ubiquitous mobile devices such as tablets and smartphones, augmented reality for planning and designing our environments is likely to develop into a new field of research in the near future. Suggested further reading Appleyard, D. (1977) ‘Understanding professional media: Issues, theory and a research agenda’, Reprint No. 150 from Human Behavior and Environment 2, Berkeley, CA: Institute of Urban and Regional Development, University of California. Bishop, I. and Lange, E., eds. (2005) Visualization in Landscape and Environmental Planning: Technology and Applications, London, New York: Taylor & Francis. Buhmann, E., Paar, P., Bishop, I. and Lange, E., eds. (2005) Trends in Real-Time Landscape Visualization and Participation, Heidelberg: Wichmann. Conan, M., ed. (2003) Landscape Design and the Experience of Motion, Washington, DC: Dumbarton Oaks Trustees for Harvard University. Lange, E. (2011) ‘99 volumes later: We can visualise. Now what?’, Landscape and Urban Planning, 100, 403–406. Sheppard, S.R.J. (1989) Visual Simulation: A User’s Guide for Architects, Engineers, and Planners, New York: Van Nostrand Reinhold.. References Appleyard, D. and Craik, K.H. (1978) ‘The Berkeley environmental simulation laboratory and its research program’, Applied Psychology: An International Review, 27, 53–55. Appleyard, D., Lynch, K. and Myer, J.R. (1966) The View from the Road, Cambridge, MA: The MIT Press. Börjeson, L., Höjer, M., Dreborg, K.-H., Ekvall, T. and Finnveden, G. (2006) ‘Scenario types and techniques: Towards a user’s guide’, Futures, 38(7), 723–739. Burckhardt, L. (2006 [1979]) Warum ist Landschaft schön? Die Spaziergangswissenschaft, Berlin: Martin Schmitz Verlag. Crowe, S. (1978) ‘The landscape of forests and woods’, Forestry Commission Booklet 44, London: HMSO. Danahy, J. (2001) ‘Technology for dynamic viewing and peripheral vision in landscape visualization’, Landscape and Urban Planning, 54, 125–137. Danahy, J.W. (2005) ‘Negotiating public view protection and high density in urban design’, in Bishop, I.D. and Lange, E., eds. Visualization in Landscape and Environmental Planning: Technology and Applications, London, New York: Taylor & Francis, 195–202. Danahy, J.W. and Wright, R. (1988) ‘Exploring design through 3-dimensional simulations’, Landscape Architecture, 78(4), 64–71. Danahy, J.W. and Hoinkes, R. (1995) ‘Polytrim: Collaborative setting for environmental design’, in Tan, M. and Teh, R., eds. The Global Design Studio. Proceedings CAAD Futures ‘95. CASA, National University of Singapore, 647–658. Deming, M.E. and Swaffield, S. (2011) Landscape Architectural Research: Inquiry, Strategy, Design, Hoboken, NJ: John Wiley & Sons. Downes, M. and Lange, E. (2015) ‘What you see is not always what you get: A qualitative, comparative analysis of ex ante visualizations with ex post photography of landscape and architectural projects‘, Landscape and Urban Planning, 142, 136–146. Ervin, S.M. (2001) ‘Digital landscape modeling and visualization: A research agenda’, Landscape and Urban Planning, 54, 49–62. Essex, S.J. (1990) ‘Woodland planning in the Peak District National Park, UK: Formulation and implementation of a land use policy’, Land Use Policy, 7(3), 243–256.. 176 .
(31) Review Copy – Not for Redistribution Eckart Lange - Department of Landscape, The University of Sheffield - 01/06/2017 Virtual environments . Gaggioli, A. (2001) ‘Using virtual reality in experimental psychology’, in Riva, G. and Galimberti, C., eds. Towards Cyberpsychology: Mind, Cognition and Society in the Internet Age, Amsterdam: IOS Press, 157–174. Galesic, M. and Bosnjak, M. (2009) ‘Effects of questionnaire length on participation and indicators of response quality in a web survey’, Public Opinion Quarterly, 73(2), 349–360. Gibson, J.J. (1979) The Ecological Approach to Visual Perception, Boston, MA: Houghton Mifflin. Gill, L. and Lange, E. (2013) ‘Visualizing landscapes’, in Howard, P., Thompson, I. and Waterton, E., eds. The Routledge Companion to Landscape Studies, London, New York: Routledge, 417–426. Gill, L. and Lange, E. (2015) ‘Getting virtual 3D landscapes out of the lab‘, Computers, Environment and Urban Systems, 54, 356–362. Gill, L., Lange, E., Morgan, E. and Romano, D. (2013) ‘An analysis of usage of different types of visualisation media within a collaborative planning workshop environment’, Environment & Planning B: Planning and Design, 40(4), 742–754. Haynes, P.S. and Lange, E. (2016) ‘In-situ Flood Visualisation Using Mobile AR‘, IEEE Symposium on 3D User Interfaces, 19–23 March 2016, Greenville, SC, 241–242. Heft, H. and Nasar, J.L. (2000) ‘Evaluating environmental scenes using dynamic versus static displays’, Environmental Behavior, 32(3), 301–322. Hehl-Lange, S. and Lange, E. (1993) ‘2D3D4D’, Anthos, 2, 12–16. Hehl-Lange, S., Gill, L., Henneberry, J., Keskin, B., Lange, E., Mell, I.C. and Morgan, E. (2012) ‘Using 3D virtual geodesigns for exploring the economic value of alternative green infrastructure options’, in Buhmann, E., Ervin, S. and Pietsch, M., eds. Digital Landscape Architecture 2012, Berlin-Offenbach: Wichmann, 273–280. Hehl-Lange, S., Lange, E. and Bilge, G. (2015) ‘Plan and design together – Just a vision?‘, Proceedings REAL CORP 2015, Ghent, 483–487. Henderson, R. (2012) The Gardens of Suzhou, Philadelphia, PA: University of Pennsylvania Press. Johnson, N.B. (2003) ‘Mountain, temple, and the design of movement: Thirteenth-century Japanese Zen Buddhist landscapes’, in Conan, M., ed. Landscape Design and the Experience of Motion, Washington, DC: Dumbarton Oaks Research Library and Collection, 158–186. Lane, M.B. (2005) ‘Public participation in planning: An intellectual history’, Australian Geographer, 36(3), 283–299. Lange, E. (2002) ‘Visualization in landscape architecture and planning: Where we have been, where we are now and where we might go from here’, in Buhmann, E., Nothhelfer, U. and Pietsch, P., eds. Trends in GIS and Virtualization in Environmental Planning and Design, Heidelberg: Wichmann, 8–18. Lange, E. and Hehl-Lange, S. (2010a) ‘Citizen participation in the conservation and use of rural landscapes in Britain: The Alport Valley case study’, Landscape and Ecological Engineering, 7(2), 223–230. Lange, E. and Hehl-Lange, S. (2010b) ‘Making visions visible for long-term landscape management’, Futures, 42(7), 693–699. Lange, E., Hehl-Lange, S. and Brewer, M.J. (2008) ‘Scenario-visualization for the assessment of perceived green space qualities at the urban-rural fringe’, Journal of Environmental Management, 89(3), 245–256. Lewis, J.L. and Sheppard, S.R.J. (2006) ‘Culture and communication: Can landscape visualization improve forest management consultation with indigenous communities?’, Landscape and Urban Planning, 77(3), 291–313. Lindquist, M., Lange, E. and Kang, J. (2016) ‘From 3D landscape visualization to environmental simulation: The contribution of sound to the perception of virtual environments’, Landscape and Urban Planning, 148, 216–231. Markelin, A. and Fahle, B. (1979) Umweltsimulation: Sensorische Simulation im Städtebau, Schriftenreihe 11, Städtebau-Institut Universität Stuttgart, Stuttgart: Krämer. Milburn, L.-A.S. and Brown, R.D. (2003) ‘The relationship between research and design in landscape architecture’, Landscape and Urban Planning, 64, 47–66. Nassauer, J.I. (1995) ‘Messy ecosystems, orderly frames’, Landscape Journal, 14(2), 161–170. Nickerson, D.B. (1979) ‘Sightline, perspective plot, scope: Three desktop computer programs for forest landscape design’, Journal of Forestry, 77(1), 14–17. Orland, B. and Uusitalo, J. (2000) ‘Immersion in a virtual forest – some implications’, in Sheppard, S.R.J. and Harshaw, H.W., eds. Forests and Landscapes: Linking Ecology, Sustainability and Aesthetics, Wallingford, Oxon: CABI, 205–224.. 177 .
Figure
+4
Related documents
Transportation activities include personnel and freight movements and mobile plant activities.. Intertwined with these BMPs are enforceable
The government co ll ect s revenue f rom taxes on capital and labour income and value-added taxes on fina l demand , production taxes on intermediate inputs, and...
To choose a colour click on the appropriate button on the right and select a colour from the colour palette using your mouse or enter the relevant HTML colour code.. Colour selection
• psychiatric complications of non-psychiatric medications (e.g. steroids) • medical problems caused by psychiatric medications (e.g. lithium) • possible effects of
No.3 IP Fixed Mobile All-IP based FMC Single Platform Box Module Site or Central Office One Cabinet One Site 9KW 3×3KW Smart modularized power management 2KW
The easiest way to rollback the BackOrders table is to delete all the records it contains and use an append query to replace the records from the backup. • Open your BackOrders
The casualty rate for secondary schools (4.5 casualties per 1000 pupils) is significantly higher than that for primary schools (1.7), and our analysis found that a factor strongly
TO RESET TRIP DISTANCE, RESET SINGLE-RIDE DATA BY HOLDING THE LEFT AND CENTER BUTTONS FOR 3
