This is a repository copy of Improving rail wear and RCF performance using laser
cladding.
White Rose Research Online URL for this paper:
http://eprints.whiterose.ac.uk/100552/
Version: Submitted Version
Article:
Lewis, S.R., Fretwell-Smith, S., Goodwin, P.S. et al. (6 more authors) (2016) Improving rail
wear and RCF performance using laser cladding. Wear, 366. pp. 268-278. ISSN
0043-1648
https://doi.org/10.1016/j.wear.2016.05.011
Article available under the terms of the CC-BY-NC-ND licence
(https://creativecommons.org/licenses/by-nc-nd/4.0/)
[email protected] https://eprints.whiterose.ac.uk/
Reuse
Unless indicated otherwise, fulltext items are protected by copyright with all rights reserved. The copyright exception in section 29 of the Copyright, Designs and Patents Act 1988 allows the making of a single copy solely for the purpose of non-commercial research or private study within the limits of fair dealing. The publisher or other rights-holder may allow further reproduction and re-use of this version - refer to the White Rose Research Online record for this item. Where records identify the publisher as the copyright holder, users can verify any specific terms of use on the publisher’s website.
Takedown
If you consider content in White Rose Research Online to be in breach of UK law, please notify us by
Improving Rail Wear and RCF Performance using Laser Cladding
S. R. Lewis1, S. Fretwell-Smith2,P. S. Goodwin3I, L. Smith2, R. Lewis1, M. Aslam2, D. I. Fletcher1, K. Murray4,
R. Lambert2
(1) Department of Mechanical Engineering, University of Sheffield, UK. (2) Tata Steel Rail Technologies, Rotherham, UK.
(3) Laser Cladding Technology Ltd, Worksop, UK, (I) Present Address: TWI Technology Centre (Yorkshire), Rotherham, UK.
(4) Sandvik Osprey Ltd, Neath, UK.
.
ABSTRACT
Laser cladding has been considered as a method for improving the wear and RCF performance of standard grade rail. This paper presents results of small scale tests carried out to assess the wear and RCF performance of rail which had been laser clad. Using the Laser Cladding process premium metals can be deposited on to the working surface of standard rail with the aim of enhancing the wear and RCF life of the rail. Various laser clad samples were tested using a twin-disc method. The candidate metals were clad on to standard R260 grade rail discs and were tested against a disc of standard wheel material. During the tests, wear rates and RCF initiation were monitored and compared to those of a standard rail disc. Six candidate cladding materials were chosen for this test: A multi-phase Manganese Steel Variant (MMV), Martensitic Stainless Steel (MSS), TWIP Steel, NiCrBSi, Stellite 12 and Stellite 6. The MSS, Stellite 6, and Stellite 12 samples showed reduced wear rates relative to the standard R260 Grade rail discs, and also produced a reduction in wheel steel wear. The RCF initiation resistance of all of the candidate materials was superior compared to the R260 Grade material.
KEYWORDS: Laser Cladding, Wear, RCF, Rolling-Sliding, Eddy Current
1. INTRODUCTION
Rail maintenance and replacement represent some of the major costs of running a rail network. Rail lifetime is determined by two major factors; wear and rolling contact fatigue (RCF). The use of premium rail grades is one solution to increasing rail life. However, work carried out in [1, 2 and 3] showed that the laser cladding of rail shows great potential in increasing the RCF performance of standard grade rail. Laser cladding of rail also offers a potentially more cost effective solution to extending rail life as opposed to manufacturing and entire section of rail from premium material. With laser cladding only the top few millimeters of rail need to be treated with the bulk of material being a cheaper standard rail grade. Laser cladding is a hardfacing process which offers the opportunity of tailoring certain areas of engineering components and structures to individual operating conditions. For example the rail head needs to have strong tribological properties whereas the web and foot are required to have strong structural properties. It is rare that all requirements can be offered by one material. However, before laser cladding of rail track can widely adopted by the rail industry the process needs to be streamlined to the rail manufacture process and the costs involved brought down. In its current state however, laser cladding is suitable for repair/refurbishment/enhancement of high value track components such as switches, crossings and insulated rail joints. The objective of this work was to characterise the wear and RCF performance of a wide range of laser clad materials with a view to selecting the best performing ones for full scale testing.
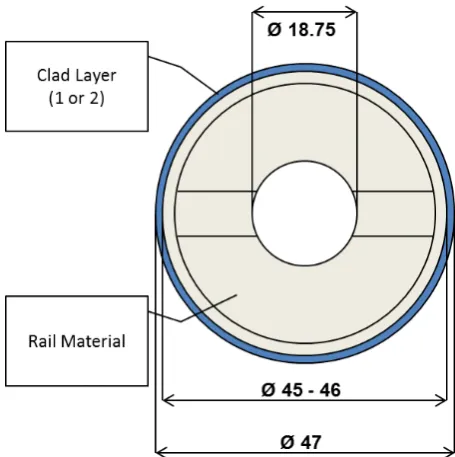
proven/expected wear and RCF resistance. Materials were deposited in nominally 1 mm thick layers. 1 or 2 layers were applied, as shown in Figure 1. The width of a deposited bead is typically 4mm and several beads are required to cover the 10 mm wide running band of a twin-disc specimen. Once the surface of a specimen is covered and the deposit cooled the surface has a “ploughed field appearance due to the adjacent beads of deposit. After the required number of layers are applied the discs then need to be ground to achieve the final test surface finish.
Figure 1. Schematic of a twin-disc specimen
2. TEST APPARATUS/METHODOLOGY
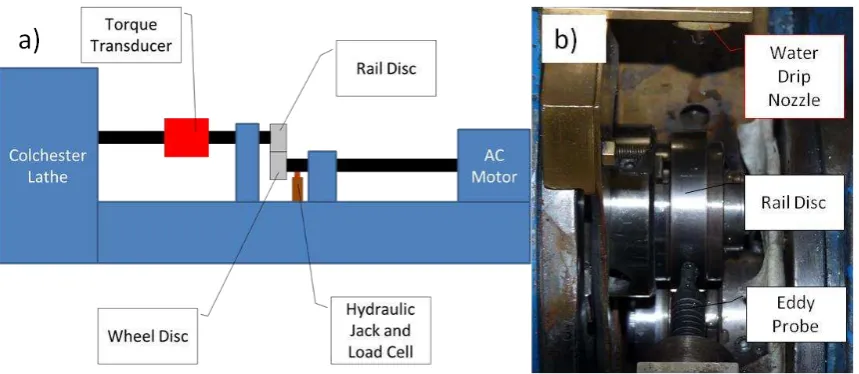
A Twin-Disc machine, shown in Figure 2a, was used in this study and is described in detail in [4]. The test samples were machined from sections of wheel and rail. A candidate material was then deposited on to the running band of each rail sample as shown in Figure 1. Only the R260 rail samples were clad with the materials mentioned above. The counter wheel discs were made from R8 wheel steel and were not clad as the focus of this work was the cladding of rails only.
disturbances are sent back to the detector unit. The unit is calibrated with a reference disc which has a 5mm long wire eroded crack in its surface parallel to the discs axis of rotation.
Six candidate cladding materials were chosen for this test: A multi-phase Manganese Steel Variant (MMV), Martensitic
Stainless Steel (MSS), TWIP Steel, NiCrBSi, Stellite 12 and Stellite 6. These were clad onto the running surface of test
samples machined from R260 grade rail. Clad samples were prepared with 1 or two layers deposited which gave
nominal thicknesses of 1mm and 2mm. However, the clad discs had to be ground back to a diameter of approximately
46mm due to an error during the grinding process. This meant that some of the discs with two layers may not still have
had two full layers of clad left on them after grinding.
R260 Grade material was also clad onto a solid R260 disc in 2 layers and tested. This was done in order to check if R260
material could be clad onto damaged track as a direct repair. This disc is referred to as “Clad R260 Grade” in the results
section below. Cladding of R260 material directly onto a R260 disc would also reveal any differences in material
properties between as rolled material and as clad material. Two types of reference disc were also tested; these were an
un-clad R260 grade rail disc, and a disc machined entirely from MMV steel. The testing of a solid MMV disc allowed
a comparison of performance between a rail that was manufactured entirely out of MMV and MMV being used just as
a cladding on the surface of standard grade rail. The Stellite material comes in different grades, and two variants:
Stellite 12 and Stellite 6 were both tested in this work. Stellite 6 was tested in [1] and was found to show superior wear
and RCF resistance. The microstructure of Stellite 12 is thought to promote greater RCF resistance over Stellite 6. It
was noted however, during manufacture of the discs that Stellite 12 was much harder to clad than Stellite 6. It was
therefore decided to test both materials in this work to see if there were any tribological benefits to using Stellite 12 over
Stellite 6.
Figure 2. a) Schematic of twin-disc machine b) Eddy current probe secured close to rail disc
This work follows on from previous tests [1] where much shorter duration wear tests were performed. Results of
previous wear testing were found to be inconclusive and it was decided that the short test duration had not been enough
to show steady state wear of the samples. The current wear tests were therefore extended to 30,000 cycles to allow the
samples to reach a steady state (i.e. fully developed work hardening, ratchetting or shakedown) which would be
[image:4.595.81.511.414.601.2]3. RESULTS
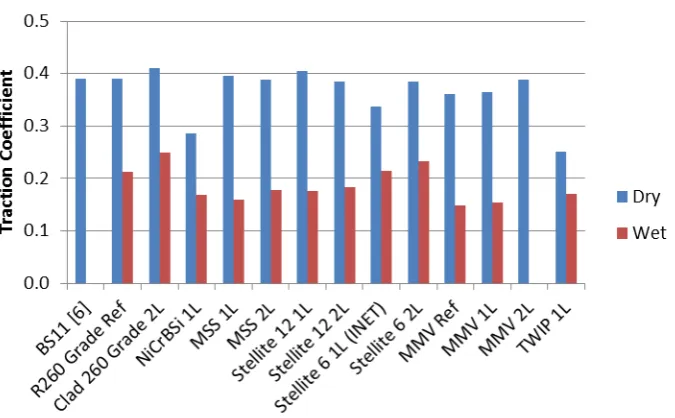
[image:5.595.129.467.96.305.2]3.1 Traction
Figure 3. Average traction coefficients for each cladding in both dry and wet conditions. Ref indicates reference, 1L indicates 1 clad layer and 2L indicates 2 clad layers
Figure 3 shows average traction results for each of the different claddings compared to an unclad reference R260 grade
rail disc. The dry traction data was taken from the wear tests and the wet data taken from the RCF tests.
3.2 Wear Tests
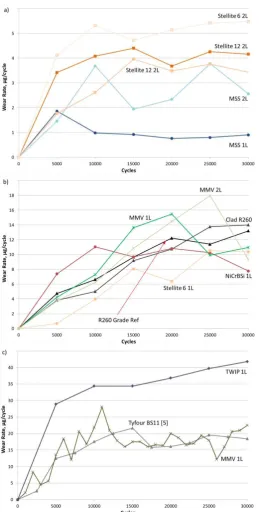
Figure 4 shows the evolution of the wear rate of the rail discs. The results have been compared to tests carried out by Tyfour et al. [6] in which the wear rate evolution of BS11 rail rolling against R8A wheel steel was measured using the same twin-disc machine under the same conditions as used in these tests.
Figure 4 shows that there is a wide variation in the wear behavior of the rail discs. There seems to be 3 distinct groups which the discs can be put into:
Group 1 (Figure 4a), where the wear rate stays below 5 g/cycle. This group includes both the 1 and 2 layer
MSS and Stellite 12 discs and the Stellite 6 2 layer disc.
Group 2 (Figure 4b), where the wear rate is between 5 and 15 g/cycle. This group includes both the 1 and 2
layer MMV, the Stellite 6 1 layer disc, the R260 grade reference disc, the clad 2 layer R260 grade disc and
the NiCrBSi disc.
Group 3 (Figure 4 c), where the wear rate remains mainly above 15 g/cycle. This group includes the MMV
Figure 4. Wear rate evolution of the rail discs under dry conditions. a) Group 1 (Wear < 5 µg/cycle), b) Group 2 (5 > wear < 15 µg/cycle), c) Group 3 (Wear > 15 µg/cycle)
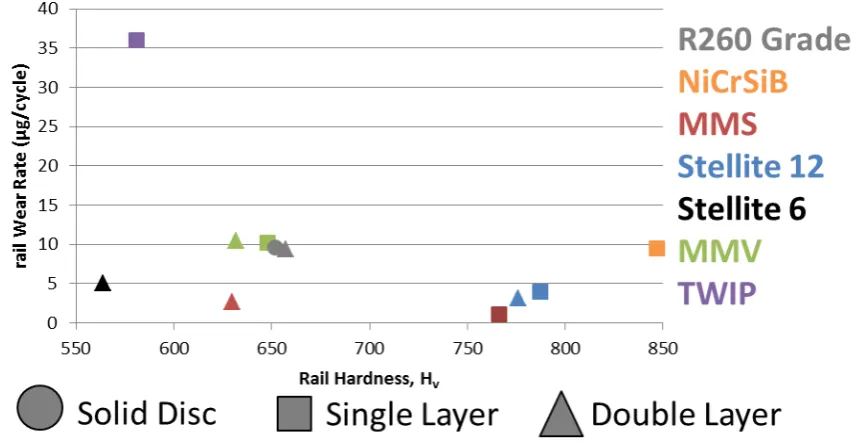
Figure 5. Average wear rate of wheel discs in dry conditions plotted against the end-of-test rail disc hardness, colour of data point indicates material/clad type, shape indicates number of layers
Figure 6. Average wear rate of rail discs in dry conditions plotted against the end-of-test rail disc hardness, colour of data point indicates material/clad type, shape indicates number of layers
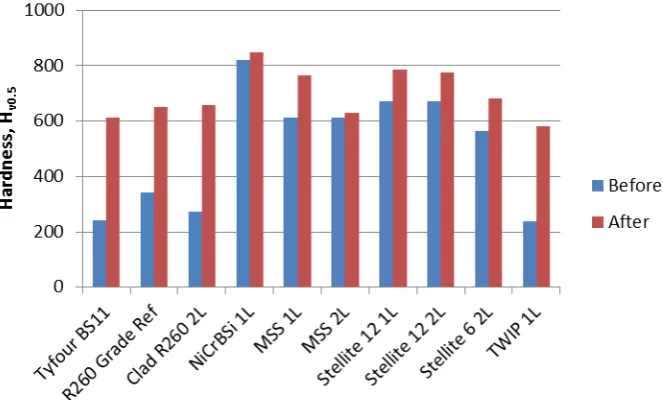
Figure 7. Before and after sub-section Vickers micro-hardness of wear test samples. Note the “R260 Grade Ref” sample had macro-hardness taken before but micro-hardness taken after the test but is included for reference purposes.
Figure 7 shows that all of the discs which had Vickers micro-hardness measured near the surface work hardened with the greatest amount of work hardening show by the BS11, R260 and TWIP samples. It is interesting to note that the hardness of all of the discs represented in Figure 7 increase toward the 600 – 800 Hv range during the test regardless
of the starting hardness value.
[image:8.595.88.506.494.760.2]Micro-hardness was measured at the surface of the wheel discs before and after the wear tests. Hardness readings taken on the disc surface are less reliable than section hardness results due to the curved running surface and hence should only be used as a guide. However it is interesting to note that all the wheel discs started at a mean hardness level of approximately 340 Hv and work hardened during the test to an average range of approximately 600 – 800 Hv as is also seen with the rail discs (Figure 7).
3.3 RCF TESTS
The RCF initiation life of each disc is quoted in rolling distance and results are shown in Figure 8. Tests were limited to 50,000 cycles (~7 km depending on disc size) for practicality reasons.Tests which ran beyond 7.14 km without failure (as defined by the eddy current method, see section 2) were stopped and recorded as run-out tests. 7.14 km equates to approximately 50,000 cycles for a standard 47 mm diameter disc.
Figure 8 shows that none of the clad samples showed any signs of RCF initiation and all ran out to the 50,000 cycle limit. (Note: the Stellite 12 1 layer sample had a reduced diameter, but still completed 50,000 cycles). The RCF initiation life of the reference sample was 3 km showing that all clad samples show superior RCF initiation resistance compared to standard R260 Grade rail. New, untested specimens of the best performing samples from the wear tests (MSS and Stellite 12 both 1 and 2 layer and Stellite 6 just 2 layer) were tested to 100,000 cycles. However, none showed any signs of crack initiation after being tested to double the original endurance limit.
4. SUB-SURFACE SPECIMEN INSPECTION
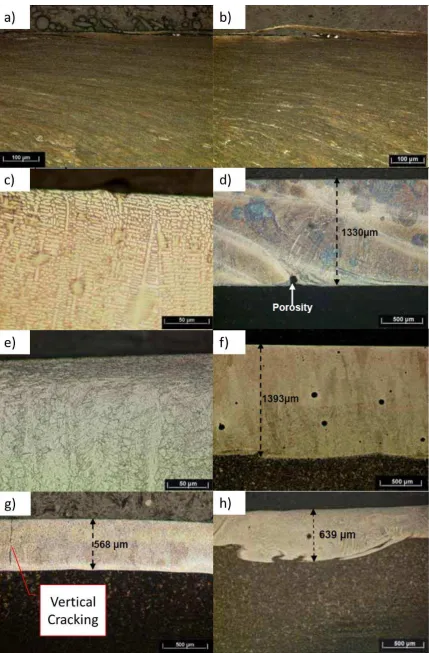
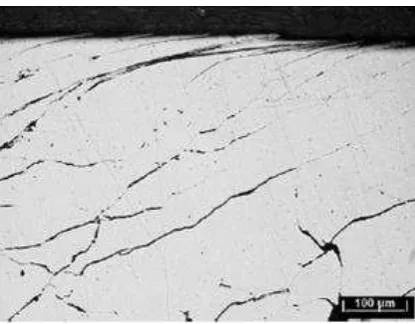
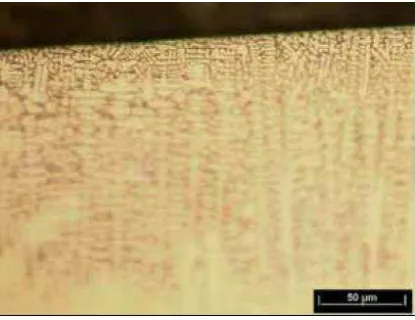
Each of the tested specimens along with an un-tested specimen of the same material were sectioned, polished, mounted and etched and then inspected under a light microscope. The quality of the deposit/interface, depth of deformation and surface damage was assessed. Electron Backscatter Diffraction, EBSD, was performed on some of the sections to gauge the amount of deformation below the surface and more information can be found in [7]. The microstructure of the HAZ of all the samples tested was also checked and found to consist of lamellar pearlite with no embritteling martensite structures seen. Figure 9 shows micrographs of a selection of the wear samples sectioned.
4.1 Wear Specimens
The R260 material clad onto a R260 specimen (Figure 9b) was only clad in two layers and it was found that the microstructure of the deposited layer was actually somewhere between that of R220 and R260 grade rail. This suggested that the carbon content of the deposit was somewhat lower than that of the parent R260 material.
Sub-surface deformation was measured in both the clad and un-clad R260 grade samples using a Prior Lineal Traverse Machine. Deformation depths were found to be similar for both samples being on average 643 µm and 607 µm for the un-clad and clad samples respectively. There were also similar wear rates seen between the two samples with 9.64 and 9.42 µm/cycle seen for the un-clad and clad samples respectively.
The Stellite 6 specimen (Figure 9c) showed the best deposit quality being virtually porosity free and with excellent fusion at the deposit/substrate interface. This was closely followed by the MMS sample (Figure 9e) which also showed excellent fusion at the interface and only small areas of small porosity in the deposit. It is interesting to note that these two materials exhibited very low wear rates compared to the reference R260 sample.
There was a large amount of porosity mostly present within the deposits of the 1 and 2 layer MMV samples (Figure 9f). Some of this porosity was very close to the interface and still had deposit powder trapped within it. The interfaces of both MMV samples was continuous with no lack of fusion.
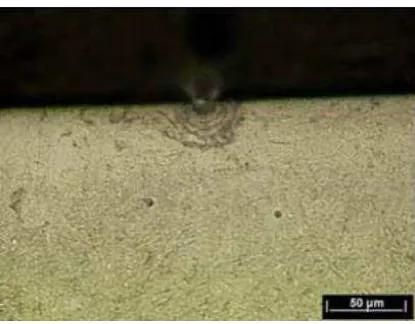
Only the 1 layer NiCrBSi was assessed in the wear tests. The 1 layer deposit (Figure 9g) showed a small amount of porosity distributed within the sample. However, there was a vertical crack in the untested 2 layer disc which extended through the full thickness of the deposit. It is assumed that similar cracks were also present in the 1 layer sample. The interface of the 1 and 2 layer NiCrBSi discs was continuous with no lack of fusion. However, some porosity can be seen in the deposit close to the interface in the 2 layer sample.
[image:11.595.188.396.357.519.2]Only the 1 layer TWIP sample (Figure 9h) was tested and was found to contain only minor porosity with some larger pores isolated within the deposit. This was the only sample which did not show an even clad/substrate boundary. The interface of the TWIP sample had a turbulent appearance. Whether this led to the high wear rate of the TWIP sample as seen in Figure 4 cannot be determined. However, it does suggest that the cladding parameters were not fully optimized which may have resulted in changes to the materials wear resistance. This is also supported by the marked increase in the porosity seen in the untested 2 layer sample. The amount of sub-surface deformation was much less than in the R260 reference sample despite the large amount of plastic flow which was seen on the running surface of the disc after testing.
Figure 10. Subsurface micrograph of MMV 2 layer wear sample showing pore at disc surface with associated cracking after 30,000 dry cycles
Figure 10 shows an area of porosity at the surface of the 2 layer MMV sample. It can be seen that the material below the pore deforms to a much greater extent than the surrounding material and cracks have developed around the pore within this deformed region. Thus it can be seen that any porosity within the deposit is likely to be detrimental to the wear performance of the deposit.
All of the clad samples exhibited little or no subsurface deformation compared to the R260 reference sample. In the R260 disc the deformation depth was on average 650 µm. However, for all of the clad wear specimens the depth of deformation below the surface was so shallow that it was not even possible to measure using an optical microscope.
4.2 RCF Specimens
Sectioning of the RCF specimens revealed that the only specimens to show extensive RCF-like cracks were the un-clad R260 reference disc and the clad 2 layer R260 disc. A section of an un-clad R260 RCF specimen which failed after 32,500 cycles is shown in Figure 11. Figure 11 shows there is an extensive network of RCF cracks within the zone of heavy deformation. The depth of deformation in this sample was roughly 630 µm.
[image:12.595.189.397.216.378.2]The microstructure of the clad R260 samples resembled that of R220 rail material and showed a similar depth of deformation to the un-clad R260 discs at 494 µm.
Figure 11. Un-etched subsurface micrographs of un-clad R260 sample which failed at 32,500 cycles. Sample is shown in the un-etched condition to aid the visualization of cracks
All of the other clad RCF samples showed no signs of RCF crack initiation. Some of the samples triggered the eddy current detector before the 50,000 cycle run-out and this is thought likely to be due to inclusions in the deposit such as porosity or cracks emanating from inclusions near the surface. No classic RCF cracks were seen in any of the discs clad with premium materials.
Although one of the best performers in terms of wear and RCF resistance, the Stellite 12 samples had gross porosity present within the deposit as seen in Figure 12. However, despite this the 1 layer sample which was tested to 50,000 cycles contained no RCF cracks and no evidence was seen of any surface damage or sub-surface deformation.
[image:12.595.72.520.570.743.2]The 2 layer sample triggered the eddy current crack detector at 45,000 cycles but no evidence of surface damage or embryonic RCF cracks were seen when the samples were sectioned. No deformation in the deposit was seen either. It is likely that the detector was triggered by the gross porosity in the clad layer.
[image:13.595.189.397.203.363.2]A 1 layer Stellite 12 sample was tested to 100,000 cycles, however upon inspection showed no signs of surface damage or RCF crack initiation. EBSD of the sample also showed no evidence of subsurface deformation. Generally this sample was free of porosity relative to the other samples tested with only a few isolated spots of smaller porosity.
Figure 13. Subsurface micrograph of the 2 layer Stellite 6 RCF sample tested to 100,000 cycles in the etched condition
The 2 layer Stellite 6 RCF sample was internally free of porosity unlike the Stellite 12 samples. Some evidence of surface damage was seen in the 2 layer sample which was tested to 50,000 cycles. However, no subsurface deformation and hence no RCF cracks were seen. Figure 13 shows a second 2 layer sample which was tested to 100,000 cycles with the surface appearing virtually untested. EBSD performed on this sample showed no signs of subsurface damage.
The 1 layer MMV disc had extensive porosity throughout the deposit as seen in Figure 14. Cracks seem to have developed from the edges of the pores closest to the specimen surface similar to what was seen in the MMV wear sample as shown in Figure 10.
Figure 14. Subsurface micrograph of the 1 layer MMV RCF sample tested to 50,000 cycles in the un-etched condition
[image:13.595.189.398.546.707.2]The solid MMV RCF sample ran-out to 50,000 cycles. However, the surface of the solid MMV sample looked virtually untested and no RCF cracks were observed. A very shallow layer of deformation was evident below the surface of the sample.
Micro-hardness traverses of the solid and clad MMV discs showed that the hardness of the solid disc is significantly lower than that of the deposited material on the clad disc. This is assumed to be due to the high cooling rate of the, relatively thin, as deposited layer of the clad disc compared to the solid disc which was machined from a much larger block of the MMV material.
[image:14.595.62.539.277.460.2]No RCF cracks were observed in the 1 layer MSS sample which was tested to 50,000 cycles. However, there seemed to be a shallow region of deformation between 20 and 50 µm below the surface of the sample. The 2 layer sample on the other hand showed signs of embryonic RCF crack formation at the surface and showed a greater depth of deformation as shown in Figure 15a.
Figure 15. Subsurface micrographs of the MSS RCF samples: a) 2 layer sample after 50,000 cycles in the etched condition, b) 1 layer sample after 100,000 cycles in the etched condition
A separate 1 layer sample was also tested to 100,000 cycles and was seen to exhibit less deformation than the 2 layer sample tested to 50,000 cycles. No typical RCF cracks were seen in this sample, however, cracks were seen around areas of porosity, as shown in Figure 15b; some of which were sub-surface and some exposed at the surface. EBSD showed that the depth of deformation in the 100,000 cycle sample is roughly 50µm.
The wear rate of the 1 layer RCF TWIP specimen was substantially lower in the wet conditions of the RCF test compared to the dry running of the Wear tests. The wear rate under wet conditions was 0.82 µg/cycle even lower than the reference R260 disc under the same conditions which was 1.69 µg/cycle. This is in stark contrast to the wear rates seen in the dry conditions of the wear tests. No RCF cracks were seen in the sample and only a very shallow layer of deformation was seen. Also no RCF cracks were seen in the 1 layer NiCrBSi sample tested to 50,000 cycles.
5. DISCUSSION 5.1 Traction
coefficients of the clad discs deviated far from the R260 Grade reference sample, indicating that in the field MSS, Stellite 12 and MMV clads would give similar adhesion levels to un-clad R260 Grade rail. Interestingly, in dry conditions, the 2 layer clad R260 and MMV samples show higher traction than their un-clad reference counterparts.
5.2 Wear
[image:15.595.103.481.313.543.2]The best performing cladding in this test was 1 layer MSS where the wear rate remained consistently below 1 g/cycle. The discs in group 1 (see Section 3.2) seemed to reach a steady state of wear relatively quickly (within 5000 cycles) where upon there was little variation in the wear rate after this point. Most of the discs in group 2 reached a maximum wear rate after which a lower cyclical wear rate was seen. However, the R260 Grade reference sample and the clad R260 sample both seemed to show gradually increasing wear rates. The worst performing disc, in terms of wear, was the 1 layer TWIP sample which showed a wear rate far in excess of any other sample tested. The wear rate of the TWIP disc also increased throughout the test. It was observed that there is a large degree of plastic deformation on the surface of the TWIP sample. What is not easy to determine here is whereabouts the wear rate of each sample lies on the curve representing the life of typical tribological components as shown in Figure 16 [8].
Figure 16. Typical wear behaviour over the lifetime of a component [8]
Due to the scaled nature of the tests and the range of mechanical properties of each of the materials tested it is difficult to say whereabouts 30,000 test cycles places each of the samples on the curve shown in Figure 16. It is possible that the samples in group 1 “Steady wear rate” may be in the “Steady Wear” regime as per Figure 16. It is also possible that those materials in group 1 do not exhibit typical wear behavior and instead transition straight to “Steady Wear”. Thus materials in Groups 2 and 3 which show increasing wear behavior may still be in the “Run-In” phase and may potentially show steady wear if the tests were continued beyond 30,000 cycles.
What can be definitely concluded, however, is that the materials in Group 1 show wear rates far lower than any other of the materials that even if the group 2 and 3 materials were to eventually reach steady wear the differences in cumulative material loss between the groups would be very large. It can be noticed from Figure 4 how the 1 layer Stellite 6 sample does not wear similar to its 2 layer counterpart and thus is in group 2 as opposed to group 1. It is not clear why this is, however, the 1 and 2 layer Stellite 6 samples were manufactured by different methods. The 1 layer sample was clad from a pre-machined disc whereas the 2 layer sample was manufactured by cladding a length of R260 grade cylinder which was then machined into discs. Only 2 of the samples used in this project were manufactured using this second method. All others were manufactured by cladding pre-machined discs. It should be noted that the chart in Figure 16 is representative of many tribological applications. However, it may not truly represent in-service conditions and is only used to support observations in these tests. Table 1 shows the average (overall) wear rates for the wheel and rail discs under dry conditions. The wear rates of each of the clad discs is also expressed as a percentage of the standard R260 Grade reference disc.
[image:16.595.172.411.376.561.2]In Table 1 any wear rate which was in excess of either the reference (R260 Grade) wheel or rail, i.e. 100% or greater, has been highlighted red. Any wear rate which is less than the reference is highlighted green indicating good wear performance. Wear rates which are less than 50% of the reference case are highlighted light green indicating superior wear performance. Six of the rail samples tested are in the good/superior wear category. These are: R260 Grade Clad, NiCrBSi 1L, both MSS samples, both Stellite 12 samples and both Stellite 6 samples. Of those 6, only the MSS and Stellite 12 samples showed superior wear performance.
Table 1. Twin-disc dry wear rates
In all but one of the cases tested the wheel wear rate was classified as good/superior with Stellite 6 and TWIP, both 1 layer, showing superior wheel wear rates. Figure 5 shows the wear rates of the wheel discs plotted against the measured rail disc hardness. It is difficult to draw a conclusion from this data as the surface disc hardness will have changed throughout the test. What is of more relevance is that the wear rate of the wheels has not increased as a result of running against a harder rail as would be expected. In all but one cases the wear of the wheel is lower than the reference case and in some cases substantialy.
The highest average wear rate was shown for the TWIP rail disc in dry conditions. Excluding the TWIP sample the highest wear rate in dry conditions was seen with the solid MMV sample “MMV Ref” with a wear rate of 16.41 g/cycle compared to 9.64 g/cycle with the, Un-clad, R260 grade reference disc. The clad MMV samples, however, showed a much lower wear rate than the solid MMV disc at 10.25 and 10.42 g/cycle for both the 1 layer and 2 layered samples respectively. These wear rates are also in line with the R260 Grade reference sample. The best performing discs in dry conditions were the MSS and Stellite 12 samples with the lowest wear rate shown by the 1 layer MSS sample at 1.04 g/cycle. This is almost 10% of the wear rate of the reference sample. The 2 layer MSS sample showed a higher wear rate at 2.63 g/cycle. The Stellite 12 samples were the second best performers with wear rates of 4.00 and 3.17 g/cycle for the 1 and 2 layer samples respectively. The third best performers were the Stellite 6 samples which both wore more than the Stellite 12 samples with wear rates of 6.66 and 5.03 g/cycle for the 1 and 2 layer samples respectively. Even though the Stellite 6 wear rates were higher than Stellite 12 they were still lower than the reference wear rate for un-clad R260. Wheel wear rates were also reduced with the majority of the other clad samples.
R260 Grade material was also clad onto a R260 grade disc to represent a direct repair to a damaged rail and to explore how much the results are dependent on the cladding material and how much on the heating and microstructural effect of the cladding process itself. The wear rate of this rail sample was similar to the reference case, however, the wheel ware rate was reduced. It can therefore be said that for the case of R260 grade rail material the cladding process does not necessarily affect rail wear behavior.
Figure 5 shows a comparison between the mean rail disc hardness and the wear rate of the wheel disc which it was tested against. No correlation between rail hardness and wheel wear can be seen in the data. However, only one of the samples showed a higher wheel wear rate than the reference case; that being the NiCrBSi sample. This suggests that in the majority of cases if a premium/harder material were to be clad onto a standard R260 Grade rail this would not adversely affect the wheel wear rate. In all but one of the claddings tested the wheel wear rate was either unaffected or lower than in the baseline R260 Grade case. This is shown in Table 1. This phenomenon of harder rail material yielding lower wheel and rail wear rates has also been seen in [10-12]. It is interesting to note from the hardness change of the rail discs and the indicated hardness change of the wheel discs that both wheel and rail specimens work hardened toward a range of 600 – 800 Hv.
It should be noted that even though twin-disc testing is a generally accepted small scale test method for testing friction and wear of wheel/rail materials the results yielded cannot be translated directly to the full scale. For example in the field new rails show higher wear rates due to non-conformal contacts between the wheel and rail. The wear rate then reaches a steady state as the contacts conform and the softer decarburised layer is worn from the rail. Such effect cannot be replicated in twin-disc testing. As such it is the relative ranking of the wear rates which need to be noted rather than the absolute wear rates.
5.3 RCF
stopped at the 7.0 km mark due to project time constraints. Therefore, these discs potentially could have run much further than 7.0 km.
5.4 Run-out RCF Tests
To investigate further the three best performing claddings from the wear tests, new MSS, Stellite 12 and Stellite 6 discs, were tested with the aim of running beyond 7.0 km. However, during these run-out tests the MSS and Stellite 12 discs showed signs of failure early on in the tests (below 1 km). It was therefore decided to perform run-out tests on the discs for a total of 14.0 km which was twice the distance used in the RCF tests. The Stellite 6 sample however, showed no early signs of failure and did not trigger the eddy current detector until 11.9 km. This is 410% of the reference sample. It was decided however, to continue the test up to a 14.0 km limit so that the Stellite 6 sample was comparable to the MSS and Stellite 12 run-out samples. No RCF like cracks were seen in the run-out RCF samples.
5.5. Sub-Surface Inspection
The average measured deposit thickness was 574 µm and 1444 µm for the worn samples labeled 1 layer and 2 layer respectively. Layer thicknesses for some 1 and 2 layer un-worn samples were also measured and the difference was less than 100 µm. It therefore seems that, assuming that the original deposit layers were 1000 µm, roughly 430 – 560 µm is removed during the grinding process. Only 30 – 100 µm on average is removed during the wear tests.
The R260 and MMV materials were used to investigate how the cladding process might change the wear and RCF resistance properties of the clad materials over their un-clad state. This was done by having samples machined directly from either R260 or MMV, and some samples consisting of R260 or MMV clad on top of a machined R260 disc. The wear and RCF properties of the solid R260 and the clad R260 discs were very similar. But there was a marked difference seen in their respective microstructures with the clad R260 resembling that of the less pearlitc R220 steel. A difference in material properties was also seen with the MMV samples with the solid MMV having a distinctly lower hardness compared to the clad MMV sample; the solid MMV sample correspondingly showing a distinctly higher wear rate than its clad counterparts. These changes are a result of a number of factors such as the atomization process of the metals and the cladding process itself. This shows though that the laser cladding process is likely to change the properties of the deposited materials. However, depending on the material this may or may not translate into a change in material performance.
The three best performing specimens in terms of wear were the Stellite 6, the MMS and the Stellite 12. Although not the lowest wearing; the Stellite 6 samples showed the best deposit quality being virtually porosity free and with excellent fusion at the deposit/substrate interface (Figure 9c). The best performing specimen in terms of wear was the MMS sample (Figure 9e) which also showed excellent fusion at the interface but small areas of porosity were present within the deposit. It is interesting to note that these two materials exhibited very low wear rates compared to the reference R260 sample.
The MSS deposit was generally sound with a good quality interface. However, a few isolated spots of gross porosity were seen in the RCF samples with associated cracking at the pores close to the surface of the deposit.
The Stellite 12 (Figure 9d) sample also exhibited a relatively low wear rate. However, cyclic porosity on the clad/substrate interface is a potential site for the nucleation of fatigue cracks. It is observed in the field that the failure of track component repair welds arises from inclusions within the weld itself. This porosity could potentially be eliminated with changes to the cladding parameters and despite its presence the Stellite 12 samples were still some of the best performers in terms of wear.
It seems as though the internal integrity of the deposit and the interface are just as important at dictating wear behavior as the material properties themselves. Although material properties do also play a major part in the overall wear and RCF resistance of the materials. This can be seen in the different sub surface features of the MMV, R260 Clad, Stellite 12 and MSS specimens which both contained gross porosity, see Figures 9, 10, 11 and 14 respectively. Despite the internal porosity in the Stellite 12 deposit, no cracking was seen around the inclusions and the sample yielded the second lowest wear rate. This shows that Stellite 12 has the ability to suppress the potential performance limitations caused by the presence of inclusions. The other three materials, to varying extents did not seem to be able to do this.
None of the specimens clad with the premium materials showed any significant levels of deformation compared to the R260 reference specimens even though they showed a similar level of hardness close to the surface post-test. The average depth of deformation for the solid and clad R260 discs was roughly 650 µm. In contrast the depth of deformation on a 1 layer MSS sample was only 50 µm. The depth of deformation for all the other samples was so shallow or absent that it was not possible to measure. As such none of these samples showed any signs of RCF crack nucleation. Some of the samples triggered the eddy current detector before the 50,000 cycle run-out mark and this is thought likely to be due to inclusions in the deposit such as porosity or cracks emanating from inclusions near the surface.
RCF performance of each of the premium materials tested is not possible to determine as none of these samples initiated genuine RCF cracks even when tested to distances far in excess of the reference sample.
6. CONCLUSIONS
Testing of laser clad twin-disc samples has been carried out and the following conclusions can be made:
MSS and Stellite 12 samples wore at a rate of less than 50% of the reference R260 Grade disc. However both
samples contained porosity in their deposited layers with the latter showing the greatest amount of porosity. Stellite 6 also shows wear rates of less than 70% of a R260 Grade disc. However, the deposit was much better
than either MSS or Stellite 12 having a virtually porosity free deposit and excellent fusion at the HAZ interface.
Testing also shows that the use of harder deposits on top of the rail does not increase wheel wear rates and in most
cases decreased it.
All of the clad samples showed superior RCF initiation resistance compared to the reference sample.
However, it is impossible to quantify the RCF resistance performance of the premium deposits as none showed
any evidence of RCF crack initiation.
None of the premium deposits showed any meaningful levels of subsurface deformation compared to the R260
reference sample even though they were tested far in excess of the reference sample
These results show that for the conditions tested cladding premium alloys on to standard R260 grade rail has the
potential to vastly increase RCF initiation life.
Cracking around individual pores in some of the specimens shows the necessity to produce porosity free deposits
Sub-surface inspection of the clad samples showed no delamination of the clad from the R260 Grade base material with the microstructure of the HAZ of all the samples consisting fully of lamellar pearlite with no
embritteling martensite formations seen.
Cladding performance seems to be dictated by a mixture of the materials properties and the internal
integrity of the deposit.
The next stage will be to take the two best performing materials in this case MMS and Stellite 6 and to clad them onto full-scale rail sections. The clad rails will then be tested for wear and RCF performance using a full scale wheel/rail test facility. Challenges will be faced in terms of cladding these materials to the much larger specimens, grinding the deposit back to the original profile of the rail, and finding an appropriate test regime which will yield a measurable amount of wear and RCF formation within a reasonable timeframe.
ACKNOWLEDGEMENTS
The authors would like to acknowledge The Technology Strategy Board (TSB, now reformed as Innovate UK) who provided funding to support this work (project no. 17742-125255)
REFERENCES
[1] S. R. Lewis, R. Lewis, D. I. Fletcher, 2015. Assessment of laser cladding as an option for repairing/enhancing rails. Wear, Vol. 330-331, pp 581 - 591
[2] Z. K. Fu, H. H. Ding, W. J. Wang, Q. Y. Liu, J. Guo, M. H. Zhu, 2015. Investigation on microstructure and wear characteristic of laser cladding Fe-based alloy on wheel/rail materials. Wear, Vol. 330-331, pp 592 – 599
[3] W. J. Wang, J. Hu, J. Guo, Q. Y. Liu, M. H. Zhu, 2014. Effect of laser cladding on wear and damage behaviors of heavy-haul wheel/rail materials, Wear, 311, pp 130–136
[4] D. I. Fletcher, J.H. Beynon, 2000. Development of a machine for closely controlled rolling contact fatigue and wear testing. Journal of Testing and Evaluation,Vol. 28 (4), pp. 267–275
[5] W. R. Tyfour, J.H. Beynon, A. Kapoor, 1996. Deterioration of rolling contact fatigue life of perletic rail steel due to dry – wet rolling – sliding line contact. Wear, Vol. 196, pp 255-265
[6] W. R. Tyfour, J.H. Beynon, A. Kapoor, 1995. The steady state wear behavior of pearlitic rail steel under dry rolling-sliding contact conditions. Wear, Vol. 180, pp 79-89
[7] S. Fretwell-Smith, 2014. Work Package 8: Deliverable D10 - Metallographic Characterisation of Laser Clad
SUROS RCF and Wear Discs. Tata Steel Rail Technologies.
[8] J. Williams., 2005. Engineering Tribology, New York: Cambridge University Press.
[9] P. J. Blau, 2015. How common is the steady-state? The implications of wear transitions for materials selection and design, Wear, Vol. 332–333, pp 1120–1128
[10] R. Heyder, K. Maedler, The Influence of Wheel and Rail Material on the Wear of the Respective Contact Partner, Proceedings of CM2015 10th International Conference on Contact Mechanics and Wear of Rail/Wheel Systems, Colorado, USA, 30 August - 3 September 2015.
[11] G. Vasic, 2013, “Modelling of Wear and Crack Initiation in Rails”, PhD Thesis, The University of Newcastle. [12] R. Stock, D. T. Eadie, K. Oldknow, 2013, “Rail Grade Selection and Friction Management: A Combined Approach