eurostat
STRUKTUR UND TÄTIGKEIT
DER INDUSTRIE
Ergebnisse nach Unternehmensgröße —
1988/1989/1990
STRUCTURE AND ACTIVITY
OF INDUSTRY
Data by size of enterprise — 1988/1989/1990
STRUCTURE ET ACTIVITÉ
DE INDUSTRIE
Données selon la taille des entreprises —
1988/1989/1990
/
/
eurostat
STATISTISCHES AMT DER EUROPÄISCHEN GEMEINSCHAFTEN
STATISTICAL OFFICE OF THE EUROPEAN COMMUNITIES
OFFICE STATISTIQUE DES COMMUNAUTÉS EUROPÉENNES
L-2920 Luxembourg - Tél. 43 01-1 - Télex COMEUR LU 3423
B-1049 Bruxelles, rue de la Loi 200 - Tél. 299 11 11
Eurostat hat die Aufgabe, den
Informa-tionsbedarf der Kommission und aller
am Aufbau des Binnenmarktes
Beteilig-ten mit Hilfe des europäischen
statisti-schen Systems zu decken.
Um der Öffentlichkeit die große Menge
an verfügbaren Daten zugänglich zu
machen und Benutzern die Orientierung
zu erleichtern, werden zwei Arten von
Publikationen angeboten: Statistische
Dokumente und Veröffentlichungen.
Statistische Dokumente sind für den
Fachmann konzipiert und enthalten das
ausführliche Datenmaterial:
Bezugsda-ten, bei denen die Konzepte
allgemein-bekannt, standardisiert und
wissen-schaftlich fundiert sind. Diese Daten
werden in einer sehr tiefen Gliederung
dargeboten. Die Statistischen
Doku-mente wenden sich an Fachleute, die in
der Lage sind, selbständig die
benötig-ten Dabenötig-ten aus der Fülle des
dargebote-nen Materials auszuwählen. Diese Daten
sind in gedruckter Form und/oder auf
Diskette, Magnetband, CD-ROM
verfüg-bar. Statistische Dokumente
unterschei-den sich auch optisch von anderen
Ver-öffentlichungen durch den mit einer
stili-sierten Graphik versehenen weißen
Einband.
Die zweite Publikationsart, die
Veröffent-lichungen, wenden sich an eine ganz
bestimmte Zielgruppe, wie zum Beispiel
an den Bildungsbereich oder an
Ent-scheidungsträger in Politik und
Verwal-tung. Sie enthalten ausgewählte und auf
die Bedürfnisse einer Zielgruppe
abge-stellte und kommentierte Informationen.
Eurostat übernimmt hier also eine Art
Beraterrolle.
Für einen breiteren Benutzerkreis gibt
Eurostat Jahrbücher und periodische
Veröffentlichungen heraus. Diese
enthal-ten statistische Ergebnisse für eine erste
Analyse sowie Hinweise auf weiteres
Datenmaterial für vertiefende
Untersu-chungen. Diese Veröffentlichungen
werden in gedruckter Form und in
Datenbanken angeboten, die in
Menü-technik zugänglich sind.
Um Benutzern die Datensuche zu
erleichtern, hat Eurostat Themenkreise,
d. h. eine Untergliederung nach
Sachge-bieten, eingeführt. Daneben sind sowohl
die Statistischen Dokumente als auch
die Veröffentlichungen in bestimmte
Reihen, wie zum Beispiel „Jahrbücher",
„Konjunktur", „Methoden",
unterglie-dert, um den Zugriff auf die statistischen
Informationen zu erleichtern.
Y. Franchet
It is Eurostat's responsibility to use the
European statistical system to meet the
requirements of the Commission and all
parties involved in the development of
the single market.
To ensure that the vast quantity of
accessible data is made widely
avail-able, and to help each user make proper
use of this information, Eurostat has set
up two main categories of document:
statistical documents and publications.
The statistical document is aimed at
specialists and provides the most
com-plete sets of data: reference data where
the methodology is well established,
standardized, uniform and scientific.
These data are presented in great detail.
The statistical document is intended for
experts who are capable of using their
own means to seek out what they
require. The information is provided on
paper and/or on diskette, magnetic tape,
CD-ROM. The white cover sheet bears a
stylized motif which distinguishes the
statistical document from other
publica-tions.
The publications proper tend to be
com-piled for a well-defined and targeted
public, such as educational circles or
political and administrative
decision-makers. The information in these
docu-ments is selected, sorted and annotated
to suit the target public. In this instance,
therefore, Eurostat works in an advisory
capacity.
Where the readership is wider and less
well defined, Eurostat provides the
infor-mation required for an initial analysis,
such as yearbooks and periodicals
which contain data permitting more
in-depth studies. These publications are
available on paper or in Videotext
databases.
To help the user focus his research,
Eurostat has created 'themes' i.e. a
sub-ject classification. The statistical
docu-ments and publications are listed by
series, e.g. yearbooks, short-term trends
or methodology, in order to facilitate
access to the statistical data.
Y. Franchet
Director-General
Pour établir, évaluer ou apprécier les
différentes politiques communautaires,
la Commission des Communautés
euro-péennes a besoin d'informations.
Eurostat a pour mission, à travers le
système statistique européen, de
répon-dre aux besoins de la Commission et de
l'ensemble des personnes impliquées
dans le développement du marché
unique.
Pour mettre à la disposition de tous
l'importante quantité de données
acces-sibles et faire en sorte que chacun
puisse s'orienter correctement dans cet
ensemble, deux grandes catégories de
documents ont été créées: les
docu-ments statistiques et les publications.
Le document statistique s'adresse aux
spécialistes. Il fournit les données les
plus complètes: données de référence
où la méthodologie est bien connue,
standardisée, normalisée et scientifique.
Ces données sont présentées à un
niveau très détaillé. Le document
statis-tique est destiné aux experts capables
de rechercher, par leurs propres
moyens, les données requises. Les
informations sont alors disponibles sur
papier et/ou sur disquette, bande
magnétique, CD-ROM. La couverture
blanche ornée d'un graphisme stylisé
démarque le document statistique des
autres publications.
Les publications proprement dites
peu-vent, elles, être réalisées pour un public
bien déterminé, ciblé, par exemple
l'en-seignement ou les décideurs politiques
ou administratifs. Des informations
sélectionnées, triées et commentées en
fonction de ce public lui sont apportées.
Eurostat joue, dès lors, le rôle de
conseiller.
Dans le cas d'un public plus large, moins
défini, Eurostat procure des éléments
nécessaires à une première analyse, les
annuaires et les périodiques, dans
les-quels figurent les renseignements
adé-quats pour approfondir l'étude. Ces
publications sont présentées sur papier
ou dans des banques de données de
type vidéotex.
Pour aider l'utilisateur à s'orienter dans
ses recherches, Eurostat a créé les
thèmes, c'est-à-dire une classification
par sujet. Les documents statistiques et
les publications sont répertoriés par
série — par exemple, annuaire,
conjonc-ture, méthodologie — afin de faciliter
l'accès aux informations statistiques.
STRUKTUR UND TÄTIGKEIT
DER INDUSTRIE
Ergebnisse nach Unternehmensgröße —
1988/1989/1990
STRUCTURE AND ACTIVITY
OF INDUSTRY
Data by size of enterprise —1988/1989/1990
STRUCTURE ET ACTIVITÉ
DE L'INDUSTRIE
Données selon la taille des entreprises —
1988/1989/1990
Bibliographische Daten befinden sich am Ende der Veröffentlichung.
Cataloguing data can be found at the end of this publication.
Une fiche bibliographique figure à la fin de l'ouvrage.
Luxembourg: Office des publications officielles des Communautés européennes, 1994
ISBN 92-826-6915-7
©CECA-CEE-CEEA, Bruxelles · Luxembourg, 1994
Inhaltsverzeichnis
Seite
Einleitung 5
I.
Tabellen
17
II.
Fußnoten
151
III.
Faltblätter
- Auszüge aus der Allgemeinen Sytematik der Wirtschaftszweige
in den Europäischen Gemeinschaften (NACE) 155
Zeichen und Abkürzungen
Null (nichts)
Kein Nachweis vorhanden oder geheim
Die folgenden Landesbehörden haben die Erhebung in den Mitgliedstaaten durchgeführt und
deren Ergebnisse an das SAEG weitergeleitet:
Deutschland
Frankreich
Italien
Niederlande
Belgien
Luxemburg
Vereinigtes Königreich
Irland
Dänemark
Griechenland
Spanien
Statistisches Bundesamt, Wiesbaden
Institut national de la statistique et des études économiques
(INSEE), Paris
Ministère de l'Industrie, Paris
Ministère de l'Agriculture, Paris
Ministère du Logement et de l'Urbanisme, Paris
Istituto central di statistica (ISTAT), Roma
Centraal Bureau voor de Statistiek (CBS), Voorburg
Institut national de statistique (INS), Bruxelles
Service central de la statistique et des études économiques
(STATEC), Luxembourg
Business Statistics Office (BSO), Newport
Central Statistics Office (CSO), Dublin
Danmarks Statistik, Kobenhavn
Einleitung
Beschäftigtenklassen gegliederte Angaben für sämtliche
NACE-Gruppen zusammenzustellen, die für die
Darstel-lung der Ergebnisse betreffend die Unternehmen
vorge-sehen wurden.
Im vorliegenden Band veröffentlicht das Statistische Amt
der Europäischen Gemeinschaften (Eurostat) einige nach
Größenklassen der Unternehmen gegliederte Ergebnisse
der koordinierten Jahreserhebung über die Struktur und
Tätigkeit der Industrie.
Diese Erhebung wird in den Mitgliedstaaten entsprechend
der Richtlinie 72/221/EWG des Rates vom 6. Juni 1972
'
1' jährlich durchgeführt; ihre Ergebnisse sind
Gegen-stand einer regelmäßigen Veröffentlichung von Eurostat.
Ein 1978 veröffentlichter Band "Methoden und
Defini-tionen" enthält eine detaillierte Beschreibung der
Erhe-bungsmethodik sowie eine Reihe nützlicher
Informa-tionen über die Bedingungen, unter denen die Erhebung in
den verschiedenen Mitgliedstaaten durchgeführt wird.
Der Leser kann außerdem die Erläuterungen in den
jährlichen Veröffentlichungen Eurostats mit den
wichtig-sten Erhebungsergebnissen heranziehen.
Es sei kurz an folgendes erinnert:
Die Erhebung erstreckt sich auf alle Unternehmen
mit 20 oder mehr Beschäftigten, deren
Haupt-tätigkeit in eine der Gruppen (dreistellige Positionen)
des Teils "Industrie" (einschließlich Energie und
Wasserwirtschaft sowie Baugewerbe) der
Allge-meinen Systematik der Wirtschaftszweige in den
Europäischen Gemeinschaften (Abteilungen 1 bis 5
der NACE) fällt.
Bei den fünf Tatbeständen, für die Eurostat derartige
Angaben übermittelt werden, handelt es sich um:
Zahl der Unternehmen,
Zahl der Beschäftigten,
Personalausgaben,
Umsatz,
Bruttowertschöpfung zu Faktorkosten.
Die Beschäftigtenklassen wurden wie folgt festgesetzt:
20 bis 49 Beschäftigte
50 bis 99 Beschäftigte
100 bis 199 Beschäftigte
200 bis 499 Beschäftigte
500 bis 999 Beschäftigte
1000 bis 4999 Beschäftigte
5000 und mehr Beschäftigte
Natürlich stellt sich bei der Darstellung derartiger
Ergeb-nisse in ganz besonderem Maße das Problem der
stati-stischen Geheimhaltung. Auch deren Auswertung,
ins-besondere auf der Ebene der Datenverarbeitung,
gestal-tet sich sowohl für die Mitgliedstaaten als auch Eurostat
außerordentlich schwierig.
Ziel vorliegender Veröffentlichung ist es, den Benutzern
einige Informationen über die relative Bedeutung der
Unternehmen mit 20 bis 99 bzw. 100 bis 499 und 500
Beschäftigten und mehr in den Jahren 1988, 1989 und
1990 zu vermitteln. Die Angaben nach Größenklassen
wurden für die Jahre 1979, 1981, 1983 bis 1989
veröf-fentlicht. Die Veröffentlichung "Wichtigste Ergebnisse"
von 1989/1990 enthielt Angaben über die Unternehmen
mit weniger als 20 Beschäftigten, die aus der sich auf
das Jahr 1990 beziehenden Fünf Jahreserhebung
stammten.
Die benutzten statistischen Einheiten sind das
Unternehmen, die fachliche Einheit und die örtliche
Einheit.
Die Tatbestände, für welche Angaben eingeholt
werden, umfassen neben den Auskünften über die
Zahl der Beschäftigten und über die
Personalaus-gaben alle Daten, die zur Berechnung der
Brutto-wertschöpfung zu Faktorkosten und zu
Markt-preisen erforderlich sind.
Die Erhebung wird nicht von Eurostat selbst
durchgeführt, sondern von den zuständigen
nationalen Behörden (statistische Ämter,
Ministe-rien), die Eurostat die Erhebungsergebnisse nach
einem gemeinsamen Schema übermitteln.
Bei der Ausarbeitung des Gemeinschaftsprogramms
haben Eurostat und die Mitgliedstaaten vereinbart, nach
(1) Amtsblatt der Europäischen Gemeinschaften L 133 vom
10.6.1972.
Es wurde als zweckmäßig erachtet, die Angaben bis
ein-schließlich 1990 zu veröffentlichen, obgleich diese nur
für sieben Länder vorliegen. Bei dieser Veröffentlichung
handelt es sich um einen Kompromiß zwischen
Aktua-lität und Verfügbarkeit der Information.
Der Leser wird auf die zahlreichen Fußnoten
hingewiesen, deren Bedeutung nach den Tabellen erklärt
wird, und die sich im allgemeinen auf von den
Mitglied-staaten durchgeführte Positionszusammenfassungen der
NACE beziehen.
Belgien
Bei den Angaben über die Unternehmen mit mindestens
20 Beschäftigten auftretende Geheimhaltungsprobleme
wurden im Institut National de Statistique in Belgien
geregelt; sie betreffen im wesentlichen die
Zusammen-fassung bestimmter NACE-Sektoren.
Dänemark
Die Geheimhaltungsprobleme wurden von Dänemark
geregelt. In den Fällen, die unter die statistische
Geheimhaltung fallen, wurde lediglich die Variable 01
geliefert.
Deutschland
Bestehende Lücken sind auf die Handhabung der
Ver-traulichkeitsprobleme durch das Statistische Bundesamt
zurückzuführen; sobald eine Situation als vertraulich
eingeschätzt wird, werden keinerlei Angaben nach
Größenklassen (für die betreffende NACE-Position)
geliefert.
Griechenland
Die letzten bei Eurostat verfügbaren Angaben beziehen
sich auf das Jahr 1983.
Spanien
Die Ergebnisse beziehen sich auf Kleinunternehmen und
liegen für die (zweistelligen) NACE-Klassen vor. Die
Probleme der statistischen Geheimhaltung wurden vom
Instituto Nacional de Estadística geregelt; in Fällen, wo
die Vertraulichkeit der Information tangiert ist, liegen nur
die Tatbestände 01 nach Größenklasse vor.
Frankreich
Die Angaben liegen sehr vollständig und detailliert vor;
die vertraulichen Angaben werden von Eurostat
aufbereitet.
Irland
Wegen der Probleme der statistischen Geheimhaltung
liegen keine nach Größenklassen untergliederten
' Angaben für die statistische Einheit "Unternehmen" vor.
Italien
Die nach Größenordnung untergliederten Ergebnisse
liegen sehr detailliert und vollständig vor und umfassen
auch vertrauliche Daten. Die Geheimhaltungsfrage wird
von Eurostat geregelt.
Luxemburg
Die Angaben liegen seit 1986 nicht mehr vor.
Niederlande
Nach Größenordnung untergliederte Ergebnisse liegen nur
auf der aggregierten Ebene der (zweistelligen)
NACE-Klassen vor; in manchen Fällen können diese NACE-Klassen
zusammengefaßt sein.
Die Angaben liegen bis 1988 vor.
Portugal
Portugal hat uns für die Jahre 1986 bis 1988 keine
Daten nach Größenklassen geliefert.
Vereinigtes Königreich
Die Angaben über die "Establishments" liegen nach
Größenklassen untergliedert vor. Lücken sind auf die
Handhabung des Vertraulichkeitsproblems durch das
"Business Statistics Office" (Amt für
Wirtschaftssta-tistik) zurückzuführen. Sobald eine Situation "als
ver-traulich eingeschätzt wird, werden für bestimmte
Größenklassen sämtliche Informationen (für die
betref-fende NACE-Position) zurückgehalten. Daher können
keine Gesamtwerte berechnet werden.
Ergebnisse werden für folgende, bereits oben erwähnte
Variablen geliefert:
V01 : Zahl der Unternehmen (in Einheiten),
V05: Zahl der Beschäftigten (in Einheiten),
V18: Personalausgaben (in Mio Ecu),
V24: Umsatz (in Mio Ecu),
V73: Bruttowertschöpfung zu Faktorkosten (in Mio
Ecu).
Für die Umrechnung der einzelnen Landeswährungen in
Ecu legt Eurostat folgende Umrechnungssätze zugrunde:
1 ECU =
Belgique Danmark Deutschland Grèce Espana France Ireland Italia Luxembourg Nederland Portugal United Kingdom
1 ECU
BFR DKR D M DR PTA FF IRL LIT LFR HFL ESC UKL
1 9 8 8
4 3 , 4 2 8 4 7 , 9 5 1 5 2 2 , 0 7 4 4 0 1 6 7 , 5 7 5 6 1 3 7 , 6 0 0 7 7 , 0 3 6 4 3 0 , 7 7 5 6 7 1
1 5 3 7 , 3 3 3 4 3 , 4 2 8 4 2 , 3 3 4 7 9 1 7 0 , 0 5 9 2 0 , 6 6 4 4 3 4
1989
4 3 , 3 8 0 6 8 , 0 4 9 2 8 2 , 0 7 0 1 5 1 7 8 , 8 4 0 4 1 3 0 , 4 0 5 8 7 , 0 2 3 8 7 0 , 7 7 6 8 1 8 1 5 1 0 , 4 6 9 4 3 , 3 8 0 6 2 , 3 3 5 2 6 1 7 3 , 4 1 3 1 0 , 6 7 3 3 0 2
1 9 9 0
4 2 , 4 2 5 2 7 , 8 5 6 4 5 2 , 0 5 2 1 1 2 0 1 , 4 1 2 1 2 9 , 3 1 5 6 , 9 1 4 1 6 0 , 7 6 7 7 7 1 5 2 1 , 9 4 4 2 , 4 2 5 2 2 , 3 1 2 1 1 1 8 1 , 1 0 7 0 , 7 1 3 8 6
Die Beschreibung der in den Tabellenköpfen aufgeführten
NACE-Positionen kann der Leser den in drei
Amtssprachen abgedruckten Faltblättern am Ende der
Veröffentlichung entnehmen.
Weitere Auskünfte sind bei folgender Stelle einzuholen:
Statistisches Amt der Europäischen Gemeinschaften
Abteilung Öffentlichkeitsarbeit, Informationsverbreitung,
Synthesen
Contents
Page
Introduction
9
I.
Tables 17
IV. Footnotes
151
III.
Fold-outs
- Extract from the General Industrial Classification of Economici
Activities within the European Communities (NACE) 157
Signs and abbreviations
Nil
Data not available or secret
The following national statistical offices have carried out the inquiry in the Member States and
sent the results to the SOEC:
Germany
France
Italy
The Netherlands
Belgium
Luxembourg
United Kingdom
Ireland
Denmark
Greece
Spain
Statistisches Bundesamt, Wiesbaden
Institut national de la statistique et des études économiques
(INSEE), Paris
Ministère de l'Industrie, Paris
Ministère de l'Agriculture, Paris
Ministère du Logement et de l'Urbanisme, Paris
Istituto centrai di statistica (ISTAT), Roma
Centraal Bureau voor de Statistiek (CBS), Voorburg
Institut national de statistique (INS), Bruxelles
Service central de la statistique et des études économiques
(STATEC), Luxembourg
Business Statistics Office (BSO), Newport
Central Statistics Office (CSO), Dublin
Danmarks Statistik, Kobenhavn
National Statistical Service of Greece, Athens
Introduction
Data of this type are forwarded to Eurostat for the fol
lowing five variables:
number of enterprises,
number of persons employed,
labour costs,
turnover,
gross valueadded at factor cost.
In this volume, the Statistical Office of the European
Communities (Eurostat) is publishing a number of the
results of the coordinated annual inquiry on the structure
and activity of industry, broken down by size of
enterprise.
This inquiry is carried out each year in the Member
States pursuant to Council Directive 72/221/EEC of 6
June 1972 H ' and its results are published regularly by
Eurostat.
A 'Methods and definitions' volume published in 1978
describes in detail the survey methods employed and
gives some useful information on the conditions under
which the inquiry is carried out in the various Member
States. The reader can also refer to the explanatory
notes given in Eurostat's annual publications containing
the main inquiry results.
The following points should be noted:
the inquiry covers all enterprises which employ 20 or
more persons and whose principal economic activity
is listed in one of the groups (threedigit headings) of
the General Industrial Classification of Economic
Activities within the European Communities (NACE)
relating to industry, including energy and water, and
building and civil engineering (Nace divisions 15);
the statistical units used are the enterprise, the kind
of activity unit and the local unit;
the variables covered by the inquiry, in addition to
persons employed and labour costs, are those
required to calculate gross valueadded at factor
costs and at market prices;
the inquiry is not conducted by Eurostat itself, but by
the relevant national authorities (statistical institutes,
ministries) which forward the results to Eurostat in a
standard form.
When the Community programme was being drawn up,
Eurostat and.the Member States agreed to compile data
broken down by size groups (number of employees) for
all the
NACE
groups used in presenting the results rela
ting to enterprises.
(1)
Official Journal of the European Communities No 133 of
10 June 1972.
The size groups have been fixed as follows:
20 to 49 persons employed,
50 to 99 persons employed,
100 to 199 persons employed,
200 to 499 persons employed,
500 to 999 persons employed,
1 000 to 4 999 persons employed,
5 000 and more persons employed.
The problem of statistical confidentiality is, of course,
particularly acute for this type of presentation and the
use of the results, especially in computerized form, is
therefore extremely difficult for both the Member States
and Eurostat.
The aim of this publication is to provide users with data
on the relative shares of enterprises employing 20 to 99,
100 to 499 and 500 or more persons in the years 1988,
1989 and 1990. Data by size of enterprises have pre
viously been published for the years 1979, 1981, 1983
to 1989. Data for enterprises employing fewer than 20
persons, taken
from
the
last
fiveyearly
survey
(reference year 1990) were published with the main
results for that year.
It was judged appropriate to publish data up to and
including 1990, although data are available only for
seven countries in this year. The present publication
represents a compromise between the desire to publish
data as rapidly as possible and the availability of data.
The reader's attention is drawn to the numerous foot
notes, which are explained after the tables and generally
describe groupings of NACE headings practised by the
Member States.
The total "Manufacturing industries" in principle com
prises the following NACE positions: 12, 14, 152, 22,
24, 25, 26 and 3 and 4. Because of problems related to
statistical confidentiality or because of the coverage of
the national inquiry, certain NACE positions may not be
included in the total for certain countries.
The following notes refer specifically to each country
and mainly explain the different ways in which statistical
confidentiality is observed. ■
Belgium
Denmark
The problems of confidentiality have been dealt with by
Denmark. In cases subject to statistical confidentiality
only variable 01 is supplied.
Germany
The gaps which exist are because of the way in which
confidentiality problems have been dealt with by the
Statistisches Bundesamt (Federal Statistical Office); as
soon as a situation is considered confidential, no
infor-mation is supplied by size group (for the individual NACE
heading concerned).
Greece
The last year available at Eurostat is 1983.
Spain
Data by establishment are available at NACE class
(two-digit) level. The problems of statistical confidentiality
have been dealt with by the 'Instituto Nacional de
Estadística. When information is confidential only
vari-able 01 is availvari-able by size group.
France
Data are available in very detailed and complete form.
Eurostat is responsible for confidential data.
Ireland
Data by size group for enterprises are not available
because of problems relating to statistical confidentiality.
Italy
Results by size group are available in very detailed and
complete form and even include confidential data.
Eurostat is responsible for confidentiality.
Luxembourg
Data are available only for 1986.
Netherlands
Results by size group are available only at an aggregated
level (NACE two-digit classes), and in some cases these
classes may be combined.
Data are available until 1988.
Portugal
Portugal did not provide any data for 1986 to 1988.
United Kingdom
Data on establishments are available by size group. The
gaps which exist are linked to the way in which
confi-dentiality problems have been dealt with by the Business
Statistics Office. Where a situation is regarded as
confi-dential, all information on certain size groups is deleted
(for the individual NACE heading concerned). This
pro-blem excludes the possibility of calculating totals.
The variables for which results are given are those
already mentioned above, namely:
V01: number of enterprises (in units),
V05: number of persons employed (in units),
V1 8: labour costs (in MECU),
V24: turnover (in MECU),
V73: gross value-added at factor cost (in MECU).
The rates used by Eurostat to convert national data into
ECU are as follows: 1 ECU =
Belgique Danmark Deutschland Grèce Espana France Ireland Italia Luxembourg Nederland Portugal United Kingdom
1 ECU
BFR DKR DM
DR PTA FF IRL LIT LFR HFL ESC UKL
1 9 8 8
4 3 , 4 2 8 4 7 , 9 5 1 5 2 2 , 0 7 4 4 0 1 6 7 , 5 7 5 6 1 3 7 , 6 0 0 7 7 , 0 3 6 4 3 0 , 7 7 5 6 7 1 1 5 3 7 , 3 3 3 4 3 , 4 2 8 4 2 , 3 3 4 7 9 1 7 0 , 0 5 9 2 0 , 6 6 4 4 3 4
1989
4 3 , 3 8 0 6 8 , 0 4 9 2 8 2 , 0 7 0 1 5 1 7 8 , 8 4 0 4 1 3 0 , 4 0 5 8 7 , 0 2 3 8 7 0 , 7 7 6 8 1 8 1 5 1 0 , 4 6 9 4 3 , 3 8 0 6 2 , 3 3 5 2 6 1 7 3 , 4 1 3 1 0 , 6 7 3 3 0 2
1 9 9 0
4 2 , 4 2 5 2 7 , 8 5 6 4 5 2 , 0 5 2 1 1 2 0 1 , 4 1 2 1 2 9 , 3 1 5 6 , 9 1 4 1 6 0 , 7 6 7 7 7 1 5 2 1 , 9 4 4 2 , 4 2 5 2 2 , 3 1 2 1 1 1 8 1 , 1 0 7 0 , 7 1 3 8 6
At the end of this volume the reader will find on
three-language fold-out pages the titles of the NACE headings
given above the tables.
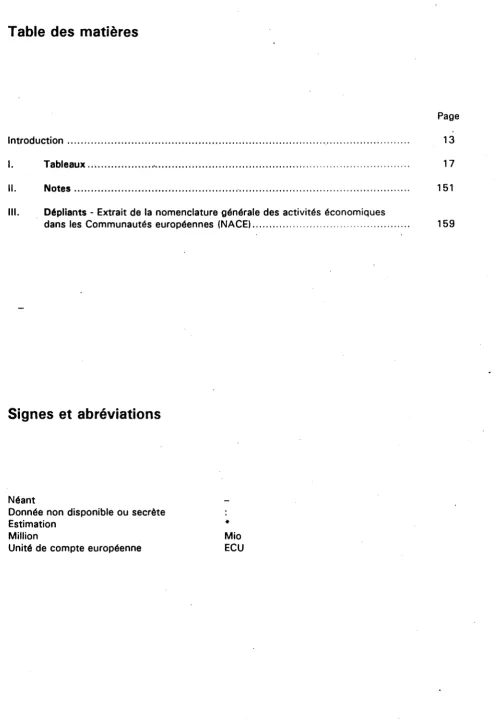
Table des matières
Page
Introduction 13
I.
Tableaux... 17
II. Notes
151
III. Dépliants
- Extrait de la nomenclature générale des activités économiques
dans les Communautés européennes (NACE) 159
Signes et abréviations
Néant
Donnée
non disponible ou secrète
Les services nationaux suivants ont exécuté l'enquête dans les Etats membres et assuré la
transmission des résultats à l'OSCE:
Allemagne
France
Italie
Pays-Bas
Belgique
Luxembourg
Royaume-Uni
Irlande
Danemark
Grèce
Espagne
Statistisches Bundesamt, Wiesbaden
Institut national de la statistique et des études économiques
(INSEE), Paris
Ministère de l'Industrie, Paris
Ministère de l'Agriculture, Paris
Ministère du Logement et de l'Urbanisme, Paris
Istituto central di statistica (ISTAT), Roma
Centraal Bureau voor de Statistiek (CBS), Voorburg
Institut national de statistique (INS), Bruxelles
Service central de la statistique et des études économiques
(STATECI, Luxembourg
Business Statistics Office (BSO), Newport
Central Statistics Office (CSO), Dublin
Danmarks Statistik, Kobenhavn
National Statistical Service of Greece, Athens
Introduction
dépenses de personnel,
chiffre d'affaires,
valeur ajoutée brute au coût des facteurs.
Dans le présent volume, l'Office statistique des
Commu-nautés européennes (Eurostat) publie quelques résultats
de l'enquête annuelle coordonnée sur la structure et
l'activité de l'industrie, ventilés selon la taille des
entreprises.
Cette enquête est effectuée annuellement dans les Etats
membres en conformité avec la directive 72/221/CEE du
Conseil, du 6 juin 1972
">,
et ses résultats font l'objet
d'une publication régulière par Eurostat.
Un volume "Méthodes et définitions" publié en 1978
donne une description détaillée de la méthodologie de
l'enquête ainsi qu'un certain nombre d'informations utiles
sur les conditions dans lesquelles s'effectue l'enquête
dans les différents Etats membres. Le lecteur pourra
également se référer aux explications qui figurent dans
les publications annuelles d'Eurostat comportant les
principaux résultats de l'enquête.
Il y a lieu de rappeler brièvement que
- l'enquête couvre toutes les entreprises qui occupent
20 personnes et plus et dont l'activité principale
relève d'un des groupes (positions à trois chiffres) de
la nomenclature générale des activités économiques
dans les Communautés européennes (NACE)
concer-nant l'industrie, y compris l'énergie et l'eau, ainsi que
le bâtiment et le génie civil (divisions 1 à 5 de la
NACE),
- les unités statistiques utilisées sont l'entreprise,
l'unité d'activité économique et l'unité locale,
- les variables recueillies auprès des enquêtes sont,
outre les informations portant sur les personnes
occupées et les dépenses de personnel, toutes celles
nécessaires au calcul de la valeur ajoutée brute au
coût des facteurs et aux prix du marché,
l'enquête n'est pas effectuée par Eurostat lui-même,
mais par les administrations nationales compétentes,
instituts statistiques, ministères), qui transmettent
les résultats des enquêtes à Eurostat selon un
schéma commun.
Lors de la mise sur pied du programme communautaire,
Eurostat et les Etats membres sont convenus que des
données ventilées par classes d'effectifs seraient
établies pour tous les groupes de la NACE, retenus pour
la présentation des résultats concernant les entreprises.
Les variables pour lesquelles de telles données sont
transmises à Eurostat sont au nombre de cinq:
- nombre d'entreprises,
- nombre de personnes occupées,
(1) JOL 133 du 10.6.1972
Quant aux classes d'effectifs, elles ont été fixées
comme suit:
20 à 49 personnes occupées,
50 à 99 personnes occupées,
100 à 199 personnes occupées,
200 à 499 personnes occupées,
500 à 999 personnes occupées,
1.000 à 4.999 personnes occupées,
5.000 personnes occupées et plus.
Bien entendu le problème du secret statistique se pose
avec une acuité particulière pour ce genre de
présenta-tion des résultats et l'exploitaprésenta-tion, notamment sur le plan
informatique, est rendue extrêmement difficile aussi bien
pour les Etats membres que pour Eurostat.
L'objectif de la présente publication est de mettre â la
disposition des utilisateurs quelques informations sur
l'importance relative, en 1988, 1987 et 1990, des
entreprises qui occupent respectivement 20 à 99, 100 à
499 personnes, ainsi que 500 personnes et plus. Les
données par classes de taille ont fait l'objet de
publica-tions pour les années 1979, 1981, 1983 à 1989. La
publication "Principaux résultats" 1989/1990 comportait
les données pour les entreprises occupant moins de 20
personnes qui provenaient de la dernière enquête
quin-quennale qui portait sur l'année 1990.
Il a été jugé opportun de publier les données jusqu'à
1990 inclus, bien que ces données ne soient disponibles
que pour sept pays. Cette publication représente un
compromis entre l'actualité et la disponibilité de
l'information.
Il faut attirer l'attention du lecteur sur les nombreux
ren-vois, dont la signification est donnée à la suite des
tableaux et qui concernent en général des regroupements
de positions de la NACE effectués par les Etats
membres.
Le total "Industries manufacturières" comprend en
principe les positions suivantes de la NACE: 12, 14,
152, 22, 24, 25, 26, 3 et 4. Certaines de ces positions
ne sont pas comprises dans ce total pour certains Etats
membres soit à cause de problèmes de confidentialité
statistique, soit à cause du champ couvert par l'enquête
nationale.
Une description des particularités de chaque pays est
exposée ci-dessous. Elle porte essentiellement sur les
différentes manières de traiter le secret statistique.
Belgique
Danemark
Les problèmes de confidentialité ont été traités par le
Danemark. Dans les cas qui relèvent du secret
statis-tique, seule la variable 01 est fournie.
Allemagne
Les lacunes existantes sont liées à la manière dont les
problèmes de confidentialité ont été traités par le
"Statistisches Bundesamt"; dès qu'une situation est
jugée confidentielle, aucune information n'est fournie par
classe de taille (pour la position NACE particulière
impliquée).
Grèce
La dernière année disponible à Eurostat concerne 1983.
Espagne
Les données concernent les établissements et sont
disponibles au niveau de la classe NACE (2 chiffres). Les
problèmes liés au secret statiétique ont été traités par
"l'lnstituto Nacional de Estadística"; dans les cas de
con-fidentialité de l'information on ne dispose que des
variables 01 par classe de taille.
France
Les données sont disponibles d'une façon très complète
et détaillée; les données confidentielles sont traitées par
Eurostat.
Irlande
Les données par classe de taille pour l'unité statistique
"entreprise" ne sont pas disponibles à cause des
pro-blèmes de secret statistique.
Italie
Les résultats par taille sont disponibles d'une façon très
détaillée et complète et incluent même les données
con-fidentielles. Le traitement du secret est fait par Eurostat.
Luxembourg
Les données ne sont plus disponibles depuis 1986.
Portugal
Le Portugal ne nous a pas envoyé de données pour les
années 1986 à 1988.
Royaume-Uni
Les données concernant les "establishments" sont
disponibles par classe de taille, les lacunes existantes
sont liées à la manière dont les problèmes de
confiden-tialité ont été traités par le "Business Statistics Office".
Dès qu'une situation est jugée confidentielle, il y a des
classes de taille pour lesquelles toute l'information est
supprimée (pour la position NACE particulière impliquée).
Ce problème exclut la possbilité de calcul de totaux.
Les variables pour lesquelles des résultats sont fournis
sont celles déjà citées plus haut, à savoir:
VOI: nombre d'entreprises (en unités),
V05: nombre de personnes occupées (en unités),
V18: dépenses de personnel (en Mio ECU),
- V24: chiffre d'affaires (en Mio ECU),
V73: valeur ajoutée brute au coût des facteurs (en
Mio ECU),
Les taux de conversion utilisés par Eurostat pour
conver-tir les données nationales en écus sont les suivants: 1
ECU =
Belgique Danmark Deutschland Grèce Espana France Ireland Italia Luxembourg Nederland Portugal United Kingdom
1 ECU
BFR DKR D M
DR PTA FF IRL LIT LFR HFL ESC UKL
1988
4 3 , 4 2 8 4 7 , 9 5 1 5 2 2 , 0 7 4 4 0 1 6 7 , 5 7 5 6 1 3 7 , 6 0 0 7 7 . 0 3 6 4 3 0 , 7 7 5 6 7 1
1 5 3 7 , 3 3 3 4 3 , 4 2 8 4 2 , 3 3 4 7 9 1 7 0 , 0 5 9 2 0 , 6 6 4 4 3 4
1989
4 3 , 3 8 0 6 8 , 0 4 9 2 8 2 , 0 7 0 1 5 1 7 8 , 8 4 0 4 1 3 0 , 4 0 5 8 7 , 0 2 3 8 7 0 , 7 7 6 8 1 8 1 5 1 0 , 4 6 9 4 3 , 3 8 0 6 2 , 3 3 5 2 6 1 7 3 , 4 1 3 1 0 , 6 7 3 3 0 2
1990
4 2 , 4 2 5 2 7 , 8 5 6 4 5 2 , 0 5 2 1 1 2 0 1 , 4 1 2 1 2 9 , 3 1 5 6 , 9 1 4 1 6 0 , 7 6 7 7 7 1 5 2 1 , 9 4 4 2 , 4 2 5 2 2 , 3 1 2 1 1 1 8 1 , 1 0 7 0 , 7 1 3 8 6
A la fin de l'ouvrage, le lecteur trouvera sur les dépliants
en trois langues les intitulés des positions de la NACE
figurant au-dessus des tableaux.
Pays-Bas
Les résultats par taille ne sont disponibles qu'à un niveau
agrégé classes NACE (2 chiffres), et même dans certains
cas .ces classes peuvent être regroupées.
Les données-sont disponibles jusqu'en 1988.
Pour tous renseignements complémentaires, s'adresser à
l'unité:
INTERNEHMEN MIT
BIS . . . BESCHAEFTIGTEH
ENTREPRISES EMPLOYING . . . TO . . . PERSONS
NACE 1« (a>
MINERALOELVERARBEITUNG MINERAL OIL REFINING RAFFINAGE DE PETROLE
ENTREPRISES EMPLOYANT ... A ... PERSONNES
I I I Β
I I I DK
I I I D
I I I GR
I I I E
I I I F
I I I IRL
I I I I
I I I L
I I I NL
I I I Ρ
I I I UK
I
τ
I
U0-<i99
TOTAL 1988 1989 1990 1988 1989 1990 1988 1989 1990 1988 1959 1990
Zahl der Unternehmen / NuBiber of ont er pr i SÖS / Nombra d'gntrepri 17 :
21 : 18
19 12 11 47 51 51
2 2 2 8 8 8 10 10 10
30 32 29 12 8 7 7 8 8 19 48 44
47 40 14 12 16 11 77 63
29 29 20
3 3
59 56 58
20-9$ 100-499 >=500 TOTAL
1988 1989 1990 1988 1989 1990 1988 1989 1990 1988 1989 1990
V05: 707 875 3780 4023 25828 20102 30315 25896 25000
Beschaaft igte / Parsons eaployed / Personnes occupées
7924 7488 7229
1159 1328 1187 2920 2108 1827 24126 22294 20929 28205 25730 23943
1878 1661 4654 3832 18391 12742 24923
18235 2259 2157
1508 1462 4334
15184 14385 13861 V18: Ausgaben fuer Personal / Labour costs / Depenses de personnel
20-99 100-499 >=500 TOTAL
1988 1949 1990 1988 1)89 1990 1988 1989 1990 1988 1989 1990
20-99 100-499 >=500 TOTAL
1988 1989 1990 1988 198 9 1990 1988 1989 1990 1588 1989 1990
22.9 32.0 143.6 167.0 1407.9 1269.9 1574.4 1471.0 1468.9
V24: Ui 112.8
167.9
1267.J ι
1 1
4250.1 ι 33613.6
I
41036.1 3Ί993.7 40135.6 45454.1
238 267 288
:
:
0 0 0
28.2 37.2 36.1 109.7 83.6 80.2 1214.8 1204.8 1186.4 1352.7 1325.6 1302.7
: 51.1 : 54.8
: 161.3 ι 146.4
: 635.0 : 476.6
: 847.4 t 677.8
satz / Turnover / Chiffre d'affaires
5!11 6600 7264
I
t
:
:
0 0 0
117.9 167.3 156.0 971.7 772.7 853.3 23897.7 27080.0 30295.9 24987.2 28020.0 31305.2
! 728.7 1893.1
ι 5906.6 : 1401.6
: :
> 20612.0 s 12159.1
: 27247.2 : 15453.7
3 5 . 9
3 2 . 5
3 5 . 9
3 1 . 8
:
3 3 . 0 1 2 0 . 7
:
:
2 8 0 . 0 4 3 2 . 5 4 5 0 . 9 4 3 7 . 9
3 0 0 . 9
ι
3 4 9 . 3
5 5 2 7 . 1
1547.5 22576.8 1864.9 23837.1 ι 26023.9
100-499
>'=500
TOTAL 1988 1989 1990 1988 1989 1990 1988 1989 1990 1988 1989 1990
V73: Bruttowartschoepfung / Gross value added / Valeur ajoutée brute
: 35.3 ■
: 48.2 ! I
264.0 306.7 1112.2 1668.1 1411.5 1600.1 2023.0
40.8 61.1 46.8
1207 1335 1062
2 0 5 . 9 1 7 6 . 1 1 0 4 . 4
1504.8 2118.8 2040.0 1751.5 2356.0 2191.2
136.0 124.0 266.8 371.2 1436.3 988.1 1839.2 1483.3
76.2 85.4 456.8
92.5 2401.8 90.3 2612.1 ·■ 3417.2
UNTERNEHMEN MIT
. . . BIS . . . BESCHAEFTIGTEN
ENTREPRISES EMPLOYING . . . TO . . . PERSONS
NACE 16 Cb)
ERZEUGUNG UND VERTEILUNG VON ELEKTRIZITAET, GAS, DAMPF UND UARMUASSER PRODUCTION AND DISTRIBUTION OF ELECTRICITY, GAS, STEAM AND HOT MATER PRODUCTION ET DISTRIBUTION D'ENERGIE ELECTRIQUE, DE GAZ, DE VAPEUR ET D'EAU CHAUDE
ENTREPRISES EMPIOYAN ... A ... PERSONNE
GR UK
Zahl dar Unternahmen / Number of enterprises / Noabre d'entreprises 20-99
>=500 1988 1989 1990 1988 1989 1990 1988 1989 1990 1988 1989 1990
456 459 209 210 97 98 762 767
23 24 24 4 4 4 2 2 1 29 30 29
53 55 49 11 11 11 8 9 9 72 75 69
87 87 32 33 19 20 138 140
9 9 26 V05: Baschaeft igte / Persons eaployed / Personnes occupées
100-499 1988 1989 1990 1988 1989 1990 1988 1989 1990 1988 1989 1990
20340 20520 49251 49352 206790 206160 276381 276031
932 986 1014
4230 4216 2713
2104 2125 1934 3423 3419 3186 157076 157165 153759 162603 162709 158879
3868 3902 6727 6850 147115 147446 157710
158198 223042 224262 219739
TOTAL
20-99
>=500 1988 1989 1990 1988 1989 1990 1988 1989 1990 1988 1989 1990 1988 1989 1990 1988 1989 1990 1988 1989 1990 198S 1989 1990
VIS; Ausgaben fuer Personal / Labour costs / Depenses de personnel 539.6
552.7 1583.7 1594.3 7867.9 7741.5 9991.2 9888.5
4533.8 4855.9 13711.7 14848.7 50876.1 53262.8 69121.5 72967.4
V24!
23.0 27.0 32.0
i
121.0 134.0 89.0
68.1 71.5 71.9 108.1 111.0 113.6 5665.2 -5951.9 6310.2 5841.5 6134.3 6495.7
112.6 : 124.9 ! 196.4 219.9 : 5316.9 : 5880.7 : ι : 5625.9 > 6225.5 / Turnover / Chiffre d'affaires 183.0
403.0 638.0
:
:
910.0 1017.0 1273.0
478.2 512.0 531.5 414.7 429.1 447.0 26289.0 27739.6 30021.6 27182.0 28680.8 31000.1
' 7 8 3 . 0 : 922.3 : 1042.0 ι 1167.0 ι : : 23869.8 ■ 25873.7
:
:
: 25694.3 : 27963.1
:
:
283.0 5425.6 6107.8 6132.«
30607.2 32574.9 48089.5 V73: Bruttowertschoepfung / Gross value added / Valeur ajoutée brute
20-99 1988 1989 1990 1988 1989 1990 1988 1989 1990 1988 1989 1990
1434.8 1448.9 4325.7 4491.2 15803.2 15478.2 21563.7 21418.3
53 116 207
313 317 443
0 0 0
0 0 0
100.4 121.6 101.6 168.8 170.2 162.4 15452.3 14960.9 16822.7 15721.5 15252.7 17086.7
267 281 385.6 430.5 12499.9 12705.3 13152.8 13416.8
12855.4 12854.8 15663.7 VC1, V05
VI», V24,
UNTERNEHMEN MIT
. . . BIS . . . BESCHAEFTIGTEN
ENTREPRISES EMPLOYING . . . TO . . . PERSONS
NACE 17
WASSERGEWINNUNG, -REINIGUNG UND -VERTEILUNG
WATER SUPPLY: COLLECTION, PURIFICATION AND DISTRIBUTION OF WATER CAPTAGE, EPURATION ET DISTRIBUTION D'EAU
ENTREPRISES EMPLOYANT ... A ... PERSONNES
20-99 100-499 >=500 TOTAL
1988 1989 1990 1988 1989 1990 1988 1989 1990 1988 1989 1990
VOI: Zahl der Unternehaen / Nuaber of enterprises / Noabre d'entreprises
·■ 54 ι 52
79 88 93 29 31 29 3 3 3 111 122 125
46 47 49 12 14 11 11 11 12 69 72 72
24 24
82 81
14 15 13 28 29 31 16 15 15 58 59 59 V05: Beschaaf t igte / Persons eaployed / Personnes occupées
20-99 100-499 >=500 TOTAL
1988 1989 1990 1988 1989 1990 1988 1989 1990 1988 1989 1990 1988 1989 1990 1988 1989 1990 1988 1989 1990 1988 1989 1990
3345 3593 4012 5160 5628 5584 3860 3842 3909 12365 13063 13505 onal /
55.0 69.0 84.0 103.0 125.0 137.0 90.0 105.0 119.0 248.0 299.0 340.0
2172 2120 2407 2514 2726 2362 22053 22280 24453 26739 27126 29222 Labour costs
52.2 52.0 64.3 68.4 78.3 72.5 673.3 719.9 857.2 793.9 850.2 994.0
2673 : 2350
:
:
! 4938 : 4524
:
:
' 4529 : 5262 : 12140 : 12136 ' Depenses de ρ 69.0 72.8 141.2 142.6 : 138.8 : 212.7
:
:
: 349.0 428.2
918 942 773 6723 7243 7529 34986 28266 27661 42627 36451 35963
1 9 . 4 2 1 . 5 1 8 . 3 1 3 6 . 0 1 6 1 . 0 1 7 6 . 8
6 8 5 . 7 6 1 7 . 3 5 6 3 . 9 8 4 1 . 799. 758.
V24> Uasatz / Turnover / C h i f f r e d ' a f f a i r e s 2099
TOTÍL 1988 1989 1990 1988 1989 1990 1988 1989 1990 1983 1989 1990
186 236 309 347 399 449 293 329 363 826 964 1122
0 0 0 0 0 0 0 0 0 0 0 0
320 313 396 469 530 532 2871 3113 3765 3661 3957 4694 S 0 1 8 7 8 2 6 7 9 3 7
2 0 0 . 3 2 5 1 . 2
4 4 5 . 6 4 9 4 . 4
2 9 4 . 9 4 1 6 . 1
9 4 0 . 8 1 1 6 1 . 7
4 1 . 1 5 4 . 1 4 7 . 6
4 2 4 . 5 5 6 6 . 8 6 2 0 . 7
2551.4 2527.2 2744.0 3016.9 3148.1 3412.3 20-99
100-499 >=500 TOTAL
1988 1989 1990 1988 1989 1990 1988 1989 1990 1988 1989 1990
V73: Bruttowartschoepfung / Gross value added / Valeur ajoutée brute : 91.9 :
104.8 95
120 159 202 220 246 214 230 262 511 570 668
0 0 0 0 0 0 0 0 0 0 0 0
106 114 153 158 171 203 963 1074 1263 1228 1361 1620
4 9 7 1 8 6 9 3 0 4 1 3
221.5 221.3 174 201 488 527.
18.3 21.9 27.0 220.1 278.8 357.7
1 8 1 4 . 1 1 4 8 0 . 1 1 9 3 4 . 6
2 0 5 2 . 5 1 7 8 0 . 8 2 3 1 9 . 3
UNTERNEHMEN MIT
. . . BIS . . . BESCHAEFTIGTEN
ENTREPRISES EMPLOYING . . . TO . . . PERSONS
NACE 221
ERZEUGUNG VON EISEN UND STAHL (OHNE HUETTENKOKEREI) IRON AND STEEL INDUSTRY, EXCLUDING INTEGRATED COKE OVENS
SIDERURGIE, NOH COMPRIS LES COKERIES INTEGREES
ENTREPRISES EMPLOYANT ... A ... PERSONNES
I I
I Β
I I
I DK
I I
I D
I I
I GR
I I
I E
I I
I F
I I
I IRL
I I
I I
I I
I L
I I
I NL
I I
I Ρ
I I
I UK
I I I
VOI: Zahl der Unternehaen / Huaber of enterprises / Noabre d'entreprises 20-99
>=500 1988 1989 1990 1988 1989 1990 1988 1989 1990 1988 1989 1990
44 42 42
4 4 4 13 13 14 15 13 12 32 30 30
76 74 40 42
19 17 135
133 9 8
:
51 52 51
Beschaaft igte / Persons employed / Parsonnos occupées 20-99
100-499
>=500
TOTAL 1988 1989 1990 1988 1989 1990 1988 1989 1990 1988 1989 1990
149007 145636 147302
327 320 334 3753 3790 4341 56569 49774 47242 60649 53884 51917
3622 3449 9231 9435 62410 58679 75263 71563
5843 4748
378 433
55162 54700 50835
VIS: Ausgaben fuer Personal / Labour costs / Depenses de personnel 20-99
100-499
>=500
TOTAL 1988 1989 1990 1988 1989 1990 1988 1989 1990 1988 198 9 1990
4640.5 4742.6 4940.3
8.0 9.6 10.2 123.6 108.7 137.5 2039.2 1949.1 1984.3 2170.8 2067.4 2132.1
89.9 95.4 235.4 273.5 1680.7 1781.5 2006.1 2150.4
2.1 8.0 9.7
59.5 55.9
1412.1 1457.0 1357.3
Uasatz / Turnover / Chiffre d'affairée 20-99
100-499
>=500
TOTAL 1988 1989 1990 1988 1989 1990 1988 1989 1990 1988 1989 1990
19463.8 22097.4 20878.0
46.3 51.7 41.8 716.2 1015.0 1017.6 9500.8 10312.0 9220.1 10263.3 11378.7 10279.5
1262.3 1272.3
2231.5 2600.7 7957.0 10203.2 11450.8 14076.2
75.9 87.4
375.8 421.3
9931 10340 8962
3 9 6
V73: Brut tower tschoepfung / Gross value added / Valeur ajoutée brute
100-499
TOTAL 1988 1989 1990 1988 1989 1990 1988 1989 1990
1988 1989 1990
6197.1 6937.6 6378.Ζ
1 1 . 9 1 2 . 1 1 4 . 0 1 7 6 . 4 1 7 6 . 4 2 7 9 . 7
3385.2 3524.9 2764.7 3573.5 3713.5 3058.4
2 1 7 . 0 2 0 4 . 0
4 9 9 . 7 5 3 2 . 1
2 6 0 0 . 5 2 8 8 3 . 2
3 3 1 7 . 3
3 6 1 9 . 3 1 2 6 . 3 1 3 5 . 5
1 6 . 9 1 8 . 4
3 3 9 0 . 9 3 1 1 6 . 0 2 4 2 3 . 8
VOI, V05
UNTERNEHMEN MIT
... BIS ... BESCHAEFTIGTEN
ENTREPRISES EMPLOYING ... TO ... PERSONS
NACE 222
HERSTELLUNG VON STAHLROHREN MANUFACTURE OF STEEL TUBES FABRICATION DE TUBES D'ACIER
ENTREPRISES EMPLOYANT ... A ... PERSONNES
I I I Β
I I I DK
I I I D
I I I GR
I I I E
I I I F
I I I IRL
I I I I
I I I L
I I I NL
I I I Ρ
I I I UK
I I I
VOI Ï Zahl der Unternehmen / Number of enterprises / Noabra d'entreprises 20-99
100-499 >=500 TOTAL
1988 1989 1990 1988 1989 1990 1988 1989 1990 1988 1989 1990
42 42 42
12 12 11 7 7 7 7 8 8 26 27 26
58 55 19 21
82 81
:
:
2
2 2
59 54 57 28 29 29 9 8 8 96 91 94
V05: Beschaeft igte / Persons employed / Personnes occupées 100-499
TOTAL 1988 1989 1990 1988 1989 1990 1988 1989 1990 1988 1989 1990
37127 37436 32999
624 654 642 1430 1208 1197 11373 11645 11270 13427 13507 13109
2803 2660 3761 3759 11210 11238 17774
17657 360
3066 2897 3049 7130 7330 7331 7737 6995 6761 17933 17222 17141
>=500 1988 1989 1990 1988 1989 1990 1988 1989 1990 1988 1989 1990
VIS: Ausgaben fuor Personal / Labour costs / Depenses de personnel 16.7 :
16.8 : 18.8
1173.7 1163.4 1089.2
3 2 . 9 2 8 . 2 3 0 . 8 2 7 1 . 3 2 9 6 . 6 3 0 1 . 1 3 2 0 . 8 3 4 1 . 6 3 5 0 . 6
67 64 84 101 260 296 412 461 1 3
:
7 0
:
5 1 3 4
5 0 . 6 5 0 . 8 5 7 . 1 1 3 6 . 6 1 4 3 . 8 1 4 7 . 8
1 6 8 . 2 1 6 1 . 2 1 4 8 . 9 3 5 5 . 4 3 5 5 . 8 3 5 3 . 9
V24: Uasatz / Turnover / Chiffre d'affaires 20-99
100-499
TOTAL 1988 1989 1990 1988 1989 1990 1988 1989 1990 1988 1989 1990
3981.7 4166.1 3846.2
124.7 169.6 186.6 179.0 198.7 199.7 1469.3 1844.7 1647.6 1773.0 2213.0 2033.9
732.6 766.3 757.0 945.5 1537.2 2609.3 3026 .9
4321.1 56.7
2 2 9 . 8 2 1 0 . 5 2 5 9 . 7
8 1 8 . 1
:
7 7 0 . 5
9 6 4 . 3
ι
7 8 9 . 2
2012.3 1867.9 1819.4 V 7 3 : Bruttowertschoepfung / Gross value added / Valeur ajoutée brute
20-99 100-499 >=500 TOTAL
1988 1989 1990 1988 1989 1990 1988 1989 1990 1988 1989 1990
1487.6 1536.7 1301.6
2 5 . 4 3 2 . 3 3 3 . 8
5 4 . 6 4 2 . 2 6 1 . 1
4 1 0 . 9 5 1 5 . 3 4 5 2 . 3
4 9 0 . 9 5 8 9 . 8 5 4 7 . 2
1 4 2 . 9 1 3 2 . 1 1 5 8 1 2 7 .
389 4 3 9 .
6 9 0 . 6 6 9 9 . 1
6 7 . 7 5 6 . 9 7 4 . 9
2 5 1 . 4 2 2 1 . 3 2 2 1 . 3
3 0 6 . 3 2 5 5 . 3 2 8 0 . 1 6 2 5 . 4 5 3 3 . 4 5 7 6 . 3