S H O R T R E P O R T
Open Access
Validity and predictors of BMI derived from
self-reported height and weight among 11- to
17-year-old German adolescents from the
KiGGS study
Anna-Kristin Brettschneider
*, Angelika Schaffrath Rosario and Ute Ellert
Abstract
Background:For practical and financial reasons, self-reported instead of measured height and weight are often used. The aim of this study is to evaluate the validity of self-reports and to identify potential predictors of the validity of body mass index (BMI) derived from self-reported height and weight.
Findings:Self-reported and measured data were collected from a sub-sample (3,468 adolescents aged 11-17) from the German Health Interview and Examination Survey for Children and Adolescents (KiGGS). BMI was calculated from both reported and measured values, and these were compared in descriptive analyses. Linear regression models with BMI difference (self-reported minus measured) and logistic regression models with weight status misclassifications as dependent variables were calculated.
Height was overestimated by 14- to 17-year-olds. Overall, boys and girls under-reported their weight. On average, BMI values calculated from self-reports were lower than those calculated from measured values. This
underestimation of BMI led to a bias in the prevalence rates of under- and overweight which was stronger in girls than in boys. Based on self-reports, the prevalence was 9.7% for underweight and 15.1% for overweight. However, according to measured data the corresponding rates were 7.5% and 17.7%, respectively. Linear regression for BMI difference showed significant differences according to measured weight status: BMI was overestimated by underweight adolescents and underestimated by overweight adolescents. When weight status was excluded from the model, body perception was statistically significant: Adolescents who regarded themselves as‘too fat’
underestimated their BMI to a greater extent. Symptoms of a potential eating disorder, sexual maturation, socio-economic status (SES), school type, migration background and parental overweight showed no association with the BMI difference, but parental overweight was a consistent predictor of the misclassification of weight status defined by self-reports.
Conclusions:The present findings demonstrate that the observed discrepancy between self-reported and measured height and weight leads to inaccurate estimates of the prevalence of under- and overweight when based on self-reports. The collection of body perception data and parents’ height and weight is therefore recommended in addition to self-reports. Use of a correction formula seems reasonable in order to correct for differences between self-reported and measured data.
* Correspondence: [email protected]
Department of Epidemiology and Health Reporting, Robert Koch Institute, General-Pape-Str. 62-66, 12101 Berlin, Germany
Background
The prevalence of overweight and obesity has increased worldwide in recent years. Especially for children and ado-lescents, this issue has emerged as a major public health concern [1]. In Germany, the proportion of overweight and obese children and adolescents aged between 3 and 17 has risen by about 50% compared to the early 1990s. The percentage of overweight (including obese) adoles-cents aged 11-17 has almost doubled, and the prevalence of obesity has nearly tripled [2]. Overweight and obesity can act as predictor of various diseases. In the short term it is associated with several cardiovascular risk factors and mental health problems, e.g. low self-esteem [3,4]. In terms of long-term consequences, obesity in childhood is a predictor of adult obesity. Increased mortality and mor-bidity can be consequences of overweight and obesity in adulthood [5]. Continuous monitoring of weight status in the population therefore needs to be established. For prac-tical and financial reasons, large-scale studies frequently use self-reported height and weight assessed via self-admi-nistered questionnaires or telephone interviews.
A number of previous studies have examined the valid-ity of self-reported height and weight among children and adolescents. Results for height were mixed; most stu-dies reported a systematic overestimation of height [6-20], while some found underestimation or no differ-ence [21-25]. Weight, on the other hand, was consistently under-reported [6-28]. This resulted in a lower body mass index (BMI) and led to a bias in the prevalence rates of under- and overweight compared to prevalence rates based on measured values [6-16,18-20,22,24,26-28]. The results of previous studies vary with respect to gen-der differences. Mostly, height was more often over-reported and weight more often under-over-reported by girls than by boys [6,9,12,16,23,28]. Some previous studies reported age-related differences in self-reports of height and weight [8,15,16,21].
Underweight children and adolescents over-reported their weight [7], while normal weight and overweight/ obese children tended to underestimate their weight. Differences between measured and selfreported weight -and consequently BMI - were significantly greater for overweight/obese children and adolescents compared to subjects of normal weight [7,9,11,12,15,16,22,24,25,27]. Some studies have examined whether body perception has an influence on self-reports. Boys and girls who felt‘too fat’or wished to be leaner under-reported their weight to a greater extent than those who were satisfied with their body size [9,22]. Several studies have also considered the effects of ethnicity and socio-economic status (SES) or school type [6,8,9,17,20,22,24,28], but few have analysed other potential predictors of the validity of self-reports [20].
The purpose of the present study was, first, to evaluate the validity of BMI derived from self-reported height and weight in a sample of 11- to 17-year-old adolescents, and, second, to identify potential predictors of the validity of BMI calculated from self-reported height and weight.
Findings
Methods
Study population
The data used in this study is based on a subset of the German Health Interview and Examination Survey for Children and Adolescents (KiGGS). KiGGS is a cross-sec-tional study which was conducted from May 2003 to May 2006 in order to collect comprehensive data on the health status of children and adolescents aged 0-17. A total of 17,641 boys and girls from 167 study locations representa-tive of Germany were surveyed (response rate 66.6%). Participants over the age of 14 and all parents/caregivers gave their written informed consent prior to the interview and examination. The survey was approved by the Federal Office for Data Protection and by the ethics committee of Charité Universitätsmedizin Berlin.
Among other methods, self-administered question-naires filled in by parents, parallel questionquestion-naires for ado-lescents aged 11 and older, and physical examinations were used in the survey [29]. Self-reports of height and weight were collected face-to-face and only in the second half of the survey (starting in November 2004). Partici-pants with implausible or missing values for measured or self-reported height and weight were excluded from the analysis. Measured height data was missing for 3 and measured weight data for 23 adolescents. Self-reported height (weight) was missing for 181 (169) adolescents; in 2 adolescents the self-reports were not plausible.
Anthropometric measurements and self-reports
Anthropometric measurements were taken by trained staff using standardized methods. Body height was measured without shoes to an accuracy of 0.1 cm using a portable Harpenden stadiometer (Holtain Ltd., UK). Body weight was measured to the nearest 0.1 kg, wearing underwear, using a calibrated electronic scale (SECA Ltd., Germany).
Prior to the standardized measurement, adolescents were asked face-to-face to report their height (without shoes) and weight (without clothes) to an accuracy of 1 cm or 1 kg, respectively.
Potential predictors of the quality of self-reported height, weight and BMI
Each adolescent’s body perception was examined by ask-ing the followask-ing question in the self-administered ques-tionnaire:‘Do you think you are ...’ ‘much too thin’,‘a bit too thin’,‘exactly the right weight’, ‘a bit too fat’, or
‘much too fat’? Responses were classified into the follow-ing categories: (1)‘too thin’, (2)‘right weight’, and (3)
‘too fat’.
The SCOFF 5-question screening instrument, which addresses the core features of anorexia nervosa and buli-mia nervosa, was used to detect symptoms of eating disor-ders [31]. Two positively answered questions were considered suspicious of an eating disorder.
Information on sexual maturation status was obtained by the self-assessment of pubic hair status according to standardized drawings (Tanner stages) [32]. They were classified into the following categories: (1) infantile (Tanner stage 1), (2) early puberty (Tanner stage 2-3), and (3) late or post puberty (Tanner stage 4-6).
Data taken from the parental questionnaire on the par-ents’income, occupational status, and educational and occupational qualification was used to quantify the SES of the adolescents. Each of the three components was rated using a point system (1-7 points). The sum was calculated and categorized into the following groups: (1) low SES (3-8 points), (2) medium SES (9-14 points), and (3) high SES (15-21 points) [33]. Participants were referred to as immi-grants if they themselves had immigrated and had at least one parent who was not born in Germany or was of non-German nationality, or if both parents had immigrated or were of non-German nationality [34]. Self-reported height and weight of mothers and fathers were used to calculate parental BMI, which was classified into overweight (yes/ no) according to the WHO cut-off point of≥25 kg/m2 [1]. They were allocated to the following categories: (1) both parents overweight, (2) one parent overweight (including single parents who are overweight), and (3) no parent overweight.
Statistical analysis
SPSS 14 for Windows (Chicago, Illinois) was used for data management and statistical calculations. The sam-ple of 3,468 adolescents was tabulated according to age groups (11-13 and 14-17) and gender. The differences between self-reported and measured values for height, weight and BMI were calculated and tested for differ-ence from zero using the paired samples t-test. The strength of the relationship between self-reported and measured values was described by Cohen’s d as ≤0.2, >0.2 to <0.8, and ≥0.8 indicating a small, medium, and large effect, respectively [35]. Differences between boys and girls or between age groups were also tested using Student’s t-test. Bland-Altman plots were used to visua-lize the agreement of self-reported and measured data
[36]. Sensitivity and specificity for underweight, normal weight and overweight were assessed and expressed as percentages. Confidence intervals (CI) for sensitivity and specificity were calculated via the normal approximation to the binomial distribution. The difference in the pre-valence of self-reported vs. measured overweight was assessed using the McNemar test for paired data [37].
In linear regression models adjusted for age (in years, as a categorical variable), the association of potential pre-dictors of the validity of self-reports with the difference between self-reported and measured BMI was examined, separately for boys and girls. All variables which showed significance in univariate linear regression models were included in a multivariate model. The multivariate model was run in two versions: Model 1a including weight sta-tus based on measured BMI as an independent variable, and Model 1b without this variable. Model 1b simulates the situation in a study where only self-reports are avail-able. In this situation, it is important to know how self-reports differ from measured values and which variables predict these differences, independent of the actual weight status.
Logistic regression models were estimated in order to identify potential predictors for a misclassification of weight status. Misclassification was defined as discor-dance between weight status determined by measured and self-reported data. Four different models based on different analysis populations were built:
Model 2a: Includes all overweight adolescents, with the target variable‘overweight misclassified by self-reports as normal weight or underweight’. This is equal to 1-sensitivity for overweight.
Model 2b: Includes all normal weight adolescents, with the target variable‘normal weight misclassified by self-reports as overweight’.
Model 2c: Includes all normal weight adolescents, with the target variable‘normal weight misclassified by self-reports as underweight’.
Model 2d: Includes all underweight adolescents, with the target variable‘underweight misclassified by self-reports as normal weight or overweight’. This is equal to 1-sensitivity for underweight.
A secondary analysis with type of school (low, moderate, high) as potential predictor (instead of SES) in linear and logistic regression models was conducted.
Survey weights [29] were not used in the analysis, since only data from the second half of the survey were included.
Results
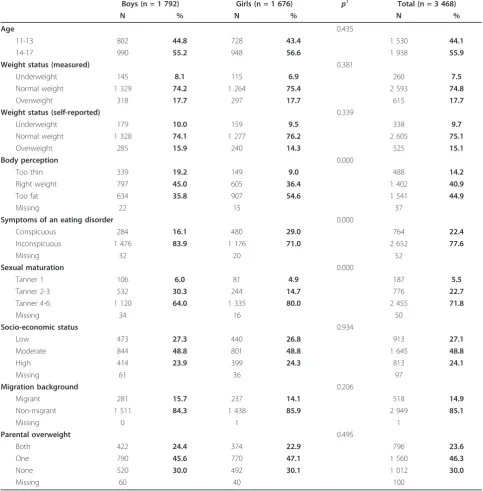
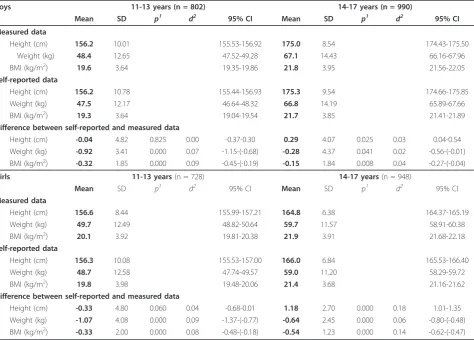
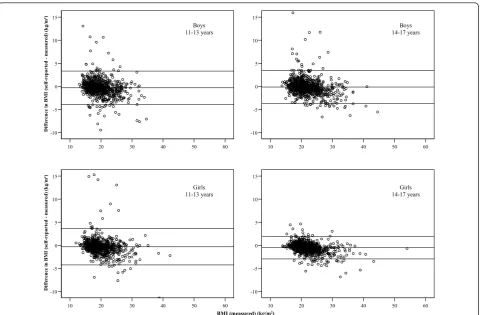
The subsample analysed comprised 3,468 adolescents (1,792 boys and 1,676 girls) aged 11-17. Characteristics of the study population are shown in Table 1. Girls were almost twice as likely to show symptoms of an eating dis-order, to be less satisfied with their body shape than boys (55% feeling‘too fat’compared to 36% in boys), and to be more advanced in their sexual maturation, while mea-sured prevalence rates for overweight were identical in boys and girls. Differences between self-reported and measured height and weight varied by gender and by age group as shown in Table 2. Height differences were not statistically significantly different from zero in 11- to 13-year-olds, but height was overestimated by 14- to 17-year-old adolescents. In 14- to 17-17-year-olds, overestima-tion of height was higher in girls than in boys (p< 0.001). Overall, boys and girls reported weight, the under-estimation being stronger among 11- to 13-year-olds (p = 0.001 andp< 0.01, respectively). In 14- to 17-year-olds, girls under-reported their weight to a larger extent than boys (p< 0.05). The average difference between self-reported and measured height and weight corresponds to 0.7% of the mean value for height and to 1.1% of the mean value for weight. On average, BMI values calcu-lated from self-reported height and weight were lower than BMI values calculated from measured data. In 11-to 13-year-olds, there was no gender difference, while 14-to 17-year-old girls underestimated their BMI more strongly than boys (p< 0.001) and more strongly than 11- to 13-year-old girls (p= 0.01), but they had the low-est standard deviation in the differences and showed fewer gross differences. Cohen’s d indicated a small effect (<0.20) for all types of differences. The Bland-Altman plots, shown in Figure 1, suggest a general tendency for a stronger underestimation with increasing BMI.
Based on self-reported data, prevalence estimates were 9.7% (95% CI 8.7-10.7) for underweight, 75.1% (95% CI 73.7-76.5) for normal weight, and 15.1% (95% CI 13.9-16.3) for overweight. However, according to measured data the corresponding rates were 7.5% (95% CI 6.6-8.4) for underweight, 74.8% (95% CI 73.4-76.2) for normal weight, and 17.7% (95% CI 16.4-19.0) for overweight. The difference in prevalence rates for overweight was higher for girls (14.3% self-reported vs. 17.7% measured) than for boys (15.9% vs. 17.7%), but was statistically sig-nificant in both boys (McNemar p = 0.003) and girls (McNemar p < 0.001). Sensitivity for overweight was 75.8% for boys and 73.7% for girls; specificity was 97.0% for boys and 98.5% for girls (see Table 3 for CI and the values for under- and normal weight).
Univariate linear regression models (adjusted for age) confirmed that BMI was overall under-reported to a lesser extent by boys than by girls (p< 0.001), with 14- to 17-year-old girls showing the largest bias (data not shown). Sexual maturation, SES, type of school, and migration background showed no significant association with the dif-ference between self-reported and measured BMI in uni-variate models (data not shown). Table 4 shows the results of the multivariate linear regression for BMI difference with the potential predictors age, weight status, body per-ception, symptoms of an eating disorder, and parental overweight. For boys, age was a significant predictor of the difference between self-reported and measured BMI (p< 0.05). The multivariate model including weight status as independent variable (Model 1a) showed that underweight boys over-reported their BMI compared to normal weight boys, whereas BMI was under-reported by overweight boys. No significant association between BMI difference and body perception could be seen in this model. How-ever, in the multivariate model not including weight status (Model 1b), boys with the body perception‘too fat’ under-reported their BMI compared to boys who considered themselves‘the right size’. Boys who considered them-selves‘too thin’over-reported their BMI, but this estimate was not statistically significant (p= 0.10). For girls, age had a statistically significant predictive effect on the differ-ence between self-reported and measured BMI (p< 0.05) in Model 1a, but only borderline significance in Model 1b (p= 0.07). In Model 1a, underweight girls over-reported their BMI compared to normal weight girls, whereas BMI was under-reported by overweight girls. Even controlled for weight status, girls perceiving their body as‘too fat’ under-reported their BMI by -0.2 kg/m2
compared to nor-mal weight girls, with borderline statistical significance (p= 0.06). In Model 1b, results were similar to those for boys: Girls who felt‘too fat’significantly under-reported their BMI compared to normal weight girls, while the over-reporting in girls perceiving their body as‘too thin’ was not statistically significant (p= 0.09). Symptoms of an eating disorder and parental overweight were not statisti-cally significantly associated with the difference between measured and reported BMI in any model (Table 4). The R-squared values in linear regression models were low; the models explained only 4-7% of the variability in the abso-lute difference between self-reported and measured BMI. In Model 1a the values were higher than in Model 1b.
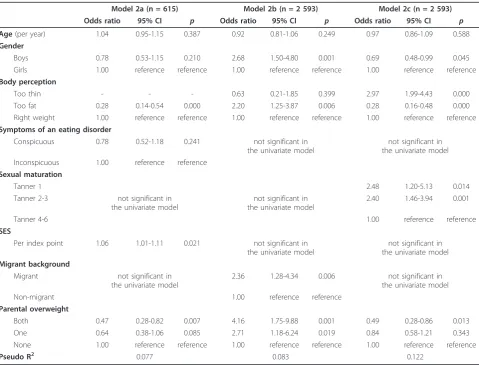
index point). Overweight adolescents with two over-weight parents had 53% (95% CI 0.18-0.72) lower odds to be classified as normal weight or underweight by their self-reports than overweight participants with normal weight parents. Age, gender, symptoms of an eating dis-order, maturation status, type of school and migration background had no statistically significant association with the misclassification of overweight adolescents. Model 2b showed that normal weight boys have 2.68fold
(95% CI 1.50-4.80) higher odds to be misclassified as overweight than normal weight girls. Normal weight ado-lescents who described themselves as‘too fat’had 2.2fold (95% CI 1.25-3.87) higher odds to be classified as over-weight than those who considered themselves to be of
[image:5.595.56.540.103.595.2]‘the right weight’. Normal weight adolescents with a migration background had 2.36fold (95% CI 1.28-4.34) higher odds to misclassify themselves as overweight. The odds that normal weight adolescents were classified as
Table 1 Description of study population
Boys (n = 1 792) Girls (n = 1 676) p1 Total (n = 3 468)
N % N % N %
Age 0.435
11-13 802 44.8 728 43.4 1 530 44.1
14-17 990 55.2 948 56.6 1 938 55.9
Weight status (measured) 0.381
Underweight 145 8.1 115 6.9 260 7.5
Normal weight 1 329 74.2 1 264 75.4 2 593 74.8
Overweight 318 17.7 297 17.7 615 17.7
Weight status (self-reported) 0.339
Underweight 179 10.0 159 9.5 338 9.7
Normal weight 1 328 74.1 1 277 76.2 2 605 75.1
Overweight 285 15.9 240 14.3 525 15.1
Body perception 0.000
Too thin 339 19.2 149 9.0 488 14.2
Right weight 797 45.0 605 36.4 1 402 40.9
Too fat 634 35.8 907 54.6 1 541 44.9
Missing 22 15 37
Symptoms of an eating disorder 0.000
Conspicuous 284 16.1 480 29.0 764 22.4
Inconspicuous 1 476 83.9 1 176 71.0 2 652 77.6
Missing 32 20 52
Sexual maturation 0.000
Tanner 1 106 6.0 81 4.9 187 5.5
Tanner 2-3 532 30.3 244 14.7 776 22.7
Tanner 4-6 1 120 64.0 1 335 80.0 2 455 71.8
Missing 34 16 50
Socio-economic status 0.934
Low 473 27.3 440 26.8 913 27.1
Moderate 844 48.8 801 48.8 1 645 48.8
High 414 23.9 399 24.3 813 24.1
Missing 61 36 97
Migration background 0.206
Migrant 281 15.7 237 14.1 518 14.9
Non-migrant 1 511 84.3 1 438 85.9 2 949 85.1
Missing 0 1 1
Parental overweight 0.495
Both 422 24.4 374 22.9 796 23.6
One 790 45.6 770 47.1 1 560 46.3
None 520 30.0 492 30.1 1 012 30.0
Missing 60 40 100
overweight by self-reports were also higher if they had overweight parents, especially when both parents were overweight. The secondary analysis with type of school instead of SES showed that normal weight adolescents who visited a low level school had 2.8fold (95% CI 1.34-5.68) higher odds to be classified as overweight than ado-lescents who visited a high level school. Age, symptoms of an eating disorder, maturation status and SES had no statistically significant odds ratios in this model. Model 2c included normal weight adolescents where the target variable was the misclassification of normal weight as underweight. Normal weight boys had 31% (95% CI 0.01-0.52) lower odds to be classified as underweight by their self-reports than girls. Normal weight boys and girls who thought they were‘too thin’had 2.97fold (95% CI 1.99-4.43) increased odds to be misclassified as underweight compared to those who felt‘the right weight’, whereas a body perception of‘too fat’decreased these odds by 72% (95% CI 0.52-0.84). The less sexual maturation was advanced, the higher were the odds to be misclassified as underweight. Age, symptoms of an eating disorder, SES,
type of school and migration background showed no sig-nificant association with the misclassification of normal weight as underweight.
No multivariate model was generated for underweight adolescents and the target variable‘misclassification of underweight as normal or overweight’ (Model 2d), because no significant associations on the univariate level could be found.
Discussion
[image:6.595.62.537.100.440.2]The aim of this study was to evaluate the validity of BMI derived from self-reported height and weight in adoles-cents aged 11-17, and to identify potential predictors of the validity of BMI calculated from self-reported height and weight. The study demonstrated that the observed discrepancy between self-reported and measured height and weight led to inaccurate estimates of the prevalence of under- and overweight in Germany, if the estimates are based on self-reports. Although the bias in mean BMI differences was small, self-reports resulted in a consider-able underestimation of BMI and thus a lower prevalence
Table 2 Mean, standard deviation (SD),p-value, Cohen’sdand 95% CI of measured and self-reported data
Boys 11-13 years (n = 802) 14-17 years (n = 990)
Mean SD p1 d2 95% CI Mean SD p1 d2 95% CI
Measured data
Height (cm) 156.2 10.01 155.53-156.92 175.0 8.54 174.43-175.50
Weight (kg) 48.4 12.65 47.52-49.28 67.1 14.43 66.16-67.96
BMI (kg/m2) 19.6 3.64 19.35-19.86 21.8 3.95 21.56-22.05
Self-reported data
Height (cm) 156.2 10.78 155.44-156.93 175.3 9.54 174.66-175.85
Weight (kg) 47.5 12.17 46.64-48.32 66.8 14.19 65.89-67.66
BMI (kg/m2) 19.3 3.64 19.04-19.54 21.7 3.85 21.41-21.89
Difference between self-reported and measured data
Height (cm) -0.04 4.82 0.825 0.00 -0.37-0.30 0.29 4.07 0.025 0.03 0.04-0.54
Weight (kg) -0.92 3.41 0.000 0.07 -1.15-(-0.68) -0.28 4.37 0.041 0.02 -0.56-(-0.01)
BMI (kg/m2) -0.32 1.85 0.000 0.09 -0.45-(-0.19) -0.15 1.84 0.008 0.04 -0.27-(-0.04)
Girls 11-13 years(n = 728) 14-17 years(n = 948)
Mean SD p1 d2 95% CI Mean SD p1 d2 95% CI
Measured data
Height (cm) 156.6 8.44 155.99-157.21 164.8 6.38 164.37-165.19
Weight (kg) 49.7 12.49 48.82-50.64 59.7 11.57 58.91-60.38
BMI (kg/m2) 20.1 3.92 19.81-20.38 21.9 3.91 21.68-22.18
Self-reported data
Height (cm) 156.3 10.08 155.53-157.00 166.0 6.84 165.53-166.40
Weight (kg) 48.7 12.58 47.74-49.57 59.0 11.20 58.29-59.72
BMI (kg/m2) 19.8 3.98 19.48-20.06 21.4 3.68 21.16-21.62
Difference between self-reported and measured data
Height (cm) -0.33 4.80 0.060 0.04 -0.68-0.01 1.18 2.70 0.000 0.18 1.01-1.35
Weight (kg) -1.07 4.08 0.000 0.09 -1.37-(-0.77) -0.64 2.45 0.000 0.06 -0.80-(-0.48)
BMI (kg/m2) -0.33 2.00 0.000 0.08 -0.48-(-0.18) -0.54 1.23 0.000 0.14 -0.62-(-0.47)
1
paired samples t-test for difference from zero
2
of overweight and a higher prevalence of underweight, especially in girls. The identified main predictors of the validity of the BMI self-reports in adolescents were gen-der, age, weight status, and body perception (the latter only in the absence of information about the actual weight status). In models where misclassification prob-ability was a target variable, other potential predictors also had a predictive effect; the most consistent results were for parental overweight.
The results for sensitivity and specificity cannot be directly compared with other studies, since they were based on the national German cut-off points for defin-ing under- and overweight, but like previous studies we found low values for sensitivity and higher values for specificity [6,9,17,26].
The descriptive analysis showed that differences between self-reported and measured values were on average larger in girls than in boys, as found by others [6,9,12,16,23,28]. One reason for this stronger misreporting in girls might be seen in the social desirability and social norms for thin-ness, which place a burden on girls in particular [6,11,23]. This desire was not just shown in their under-reporting of body weight, it was also apparent in their over-reporting of height. Girls might even know how BMI is calculated and that over-reporting height leads to a lower BMI, which could explain the stronger overestimation of height in girls aged 14-17 compared to boys. An alternative explanation might be that boys in this age group continue to grow at a faster pace than girls [38] and thus tend to report outdated height values. The significant BMI
60 50 40 30 20 10 15
10
5
0
-5
-10
Dif
ference i
n
B
MI (
se
lf
-report
ed
m
eas
ured)
(
k
g/m
²)
60 50 40 30 20 10 15
10
5
0
-5
-10
60 50 40 30 20 10 15
10
5
0
-5
-10
Dif
ference i
n
B
MI (
se
lf
-report
ed
m
eas
ured)
(
k
g/m
²)
60 50 40 30 20 10 15
10
5
0
-5
-10
BMI (measured) (kg/m²)
Boys 11-13 years
Boys 14-17 years
Girls 11-13 years
[image:7.595.59.541.87.402.2]Girls 14-17 years
Figure 1Bland-Altman plots of differences between self-reported and measured BMI (3 extremes not displayed).
Table 3 Sensitivity and specificity for weight status by gender
Sensitivity Specificity
Boys Girls Boys Girls
% 95% CI % 95% CI % 95% CI % 95% CI
Weight status
Underweight 66.9 59.2-74.6 76.5 68.8-84.2 95.0 91.5-98.5 95.5 91.7-99.3
Normal weight 90.7 89.1-92.3 92.7 91.3-94.1 73.7 71.3-76.1 74.5 72.1-76.9
[image:7.595.56.542.642.731.2]differences between self-reported and measured values, combined with the low standard deviation, suggest a systematic under-reporting of BMI by girls aged 14-17. Age-related differences were also seen in our study, as reported by others. Height was overestimated by 14- to 17-year-olds, as in the majority of preceding studies [6-17,21-28], whereas the under-reporting of height seen by Himes et al. (2001) and Jansen et al. (2006) was not confirmed in our study [21,22]. Weight was under-reported to a larger extent by adolescents aged 11-13 com-pared to 14- to 17-year-old boys and girls. One explana-tion might be the growth spurt, especially the higher weight gain in 11- to 13-year-olds [38], which may occur too rapidly for them to update their measurements.
Linear regression models showed that BMI was under-reported to the largest extent by overweight adolescents, as found by others [7,9,11,12,15,16,22,24,25,27].
This may also be associated with the desire to be lea-ner. The few studies that have considered self-reports by
[image:8.595.61.537.101.458.2]underweight adolescents confirmed the result of this study, i.e. that underweight adolescents tend to over-report their BMI [10,14]. When measured weight status was not included in the linear regression model, body perception was a major predictor of the quality of self-reports. Boys and girls who regarded themselves as‘too fat’under-reported their BMI significantly, as reported in previous studies [9,22]. But in the logistic regression model restricted to overweight adolescents, those who felt‘too fat’had lower odds to be misclassified as normal weight by their self-reports. Similarly, normal weight adolescents who described themselves as‘too fat’ had lower odds to be misclassified as underweight, but higher odds to be misclassified as overweight by their self-reported height and weight. Thus, it seems that body per-ception can be a source of some information on the deviation of self-reports from actual weight status; it can also be used to correct self-reports to better approximate the actual weight status in situations where self-reports
Table 4 Summary of multivariate linear regression models for the difference between self-reported and measured BMI
Boys (n = 1 792) Girls (n = 1 676)
Model 1a Model 1b Model 1a Model 1b
B p B p B p B p
Intercept -0.39 -0.34 -0.25 -0.27
Age(in years)
11 0.00 ref. 0.00 ref. 0.00 ref. 0.00 ref.
12 0.18 0.250 0.23 0.140 0.31 0.025 0.32 0.022
13 0.36 0.021 0.39 0.015 0.06 0.687 0.06 0.669
14 0.49 0.002 0.49 0.002 -0.08 0.572 -0.03 0.838
15 0.34 0.031 0.31 0.058 -0.03 0.839 0.05 0.741
16 0.45 0.006 0.45 0.006 -0.20 0.160 -0.14 0.338
17 0.22 0.194 0.21 0.225 -0.07 0.647 0.02 0.884
Weight status (measured)
Underweight 0.64 0.000 not included
in the model
0.37 0.028 not included
in the model
Overweight -0.87 0.000 -0.67 0.000
Normal weight 0.00 ref. 0.00 ref.
Body perception
Too thin 0.03 0.825 0.20 0.101 0.10 0.531 0.24 0.085
Too fat -0.11 0.360 -0.46 0.000 -0.17 0.057 -0.38 0.000
Right weight 0.00 ref. 0.00 ref. 0.00 ref. 0.00 ref.
Symptoms of an eating disorder
Conspicous -0.07 0.572 -0.15 0.231 -0.12 0.171 -0.16 0.072
Inconspicous 0.00 ref. 0.00 ref. 0.00 ref. 0.00 ref.
Parental overweight
Both -0.08 0.487 -0.21 0.084 not significant in
the univariate model
not significant in the univariate model
One 0.06 0.581 0.01 0.943
None 0.00 ref. 0.00 ref.
R2 0.068 0.037 0.062 0.037
are of relevance, i.e. when no measured BMI values are available. Parental overweight also had a predictive effect on the probability of misclassification in some of the models. This may be related to the fact that overweight parents have heavier children [39], and if these children are near the border between normal weight and over-weight, a misclassification is more likely, even if the BMI difference between the self-reported and measured values is small. The same mechanism can explain why a migra-tion background, a lower SES or school type, or a more advanced stage of sexual maturation were associated with the misclassification probabilities in some of the models, as these groups had a higher risk of overweight [39-41]. The results for these variables were not as consistent as for parental overweight, however. Results for SES and migration background are difficult to compare with other
studies, because most other studies did not use multivari-ate models.
The descriptive finding that girls tended to underesti-mate their BMI more strongly than boys was not reflected by higher regression coefficients in the multivariate linear regression models. It rather seems to be due to the higher proportion of girls who considered themselves to be‘too fat’.
[image:9.595.58.538.98.463.2]This study has strengths and limitations. The first strength is that the self-reported and measured data were collected at the same time. A second advantage is the large sample size and the wide age range covered (11-17 years). A third strength is the high number of covariables that were examined in this study and included in multi-variate models, e.g. the collection of the adolescents’ body perception. An important limitation is the fact that
Table 5 Summary of multivariate logistic regression models
Model 2a (n = 615) Model 2b (n = 2 593) Model 2c (n = 2 593)
Odds ratio 95% CI p Odds ratio 95% CI p Odds ratio 95% CI p
Age(per year) 1.04 0.95-1.15 0.387 0.92 0.81-1.06 0.249 0.97 0.86-1.09 0.588
Gender
Boys 0.78 0.53-1.15 0.210 2.68 1.50-4.80 0.001 0.69 0.48-0.99 0.045
Girls 1.00 reference reference 1.00 reference reference 1.00 reference reference
Body perception
Too thin - - - 0.63 0.21-1.85 0.399 2.97 1.99-4.43 0.000
Too fat 0.28 0.14-0.54 0.000 2.20 1.25-3.87 0.006 0.28 0.16-0.48 0.000
Right weight 1.00 reference reference 1.00 reference reference 1.00 reference reference
Symptoms of an eating disorder
Conspicuous 0.78 0.52-1.18 0.241 not significant in
the univariate model
not significant in the univariate model
Inconspicuous 1.00 reference reference
Sexual maturation
Tanner 1 2.48 1.20-5.13 0.014
Tanner 2-3 not significant in
the univariate model
not significant in the univariate model
2.40 1.46-3.94 0.001
Tanner 4-6 1.00 reference reference
SES
Per index point 1.06 1.01-1.11 0.021 not significant in
the univariate model
not significant in the univariate model Migrant background
Migrant not significant in
the univariate model
2.36 1.28-4.34 0.006 not significant in
the univariate model
Non-migrant 1.00 reference reference
Parental overweight
Both 0.47 0.28-0.82 0.007 4.16 1.75-9.88 0.001 0.49 0.28-0.86 0.013
One 0.64 0.38-1.06 0.085 2.71 1.18-6.24 0.019 0.84 0.58-1.21 0.343
None 1.00 reference reference 1.00 reference reference 1.00 reference reference
Pseudo R2 0.077 0.083 0.122
Model 2a includes all overweight individuals, with the target variable‘overweight misclassified by self-reports as normal weight or underweight’(n = 77 individuals misclassified).
Model 2b includes all normal weight individuals, with the target variable‘normal weight misclassified by self-reports as overweight’(n = 42 individuals misclassified).
the self-reported values were collected face-to-face, so that gross over- or underestimation was more difficult than in a written questionnaire. Furthermore, many ado-lescents in this study may have been aware that height and weight would be measured following the self-reports, because a description of the study procedures had been available to the participants on the internet beforehand. Another limitation is that we do not know whether the participants had measured their height and weight recently prior to the survey, so it is not known which ages the self-reported measurements in fact correspond to. This point is of particular importance in adolescents because of the changes in height and weight during pub-ertal development. Furthermore, the difference in accu-racy between self-reports (to the nearest cm) and measurements (to the nearest mm) may in principle be a limitation. But a comparison of rounded with unrounded measured data lead to almost identical results.
Conclusions
The use of self-reported height and weight leads to a bias in the prevalence rates for over- and underweight which is stronger in girls than in boys. Gender and age exert an influence on the patterns of accuracy of the self-reported measures. Biases in reporting were larger in overweight adolescents than in normal weight or underweight adoles-cents. Use of a correction formula seems reasonable in order to correct for differences between self-reported and measured data. Body perception might be used to improve the validity of such a formula. The collection of body per-ception data is therefore recommended in addition to self-reports. If possible, data on the parents’height and weight should also be collected. One possible correction proce-dure for estimates of the prevalence of overweight and obesity is proposed in Kurth and Ellert (2010) [42]. The development of a correction factor at the individual level based on the existing data is planned for the future. This would improve not only the estimation of the prevalence of over- and underweight in future surveys, but also the assessment of the association between the individual BMI and other variables.
Abbreviations
BMI: Body mass index; SES: Socio-economic status; WHO: World Health Organisation; CI: Confidence interval
Acknowledgements
The KiGGS study was funded by the German Federal Ministry of Health, the Ministry of Education and Research, and the Robert Koch Institute. Basis of this paper is a master’s degree thesis supervised by Prof. Dr. Ingrid-Ute Leonhäuser from the Institute of Nutritional Sciences, Nutrition Education and Consumer Behaviour, Justus Liebig University, Giessen, Germany.
Authors’contributions
AKB performed the statistical analysis. ASR and UE were involved in the study-design and data-validation process and counselled and supported AKB
on statistical questions. ASR, UE and AKB interpreted the results and AKB wrote the first draft of the manuscript. ASR and UE were involved in writing the manuscript, made substantial contributions and revised the manuscript critically. All authors have read and approved the final version.
Competing interests
The authors declare that they have no competing interests.
Received: 23 September 2010 Accepted: 17 October 2011 Published: 17 October 2011
References
1. World Health Organization:Obesity: Preventing and managing the global epidemic.WHO Technical Report SeriesGeneva; 2000.
2. Kurth BM, Schaffrath Rosario A:[The prevalence of overweight and obese children and adolescents living in Germany. Results of the German Health Interview and Examination Survey for Children and Adolescents (KiGGS)].Bundesgesundheitsblatt Gesundheitsforschung Gesundheitsschutz 2007,50:736-743.
3. Reilly JJ, Methven E, McDowell ZC, Hacking B, Alexander D, Stewart L, Kelnar CJ:Health consequences of obesity.Arch Dis Child2003, 88:748-752.
4. Strauss RS:Childhood obesity and self-esteem.Pediatrics2000,105:e15. 5. Must A, Strauss RS:Risks and consequences of childhood and adolescent
obesity.Int J Obes Relat Metab Disord1999,23(Suppl 2):S2-11. 6. Brener ND, McManus T, Galuska DA, Lowry R, Wechsler H:Reliability and
validity of self-reported height and weight among high school students. J Adolesc Health2003,32:281-287.
7. Hauck FR, White L, Cao G, Woolf N, Strauss K:Inaccuracy of self-reported weights and heights among American Indian adolescents.Ann Epidemiol 1995,5:386-392.
8. Himes JH, Hannan P, Wall M, Neumark-Sztainer D:Factors associated with errors in self-reports of stature, weight, and body mass index in Minnesota adolescents.Ann Epidemiol2005,15:272-278.
9. Rasmussen F, Eriksson M, Nordquist T:Bias in height and weight reported by Swedish adolescents and relations to body dissatisfaction: the COMPASS study.Eur J Clin Nutr2007,61:870-876.
10. Farre Rovira R, Frasquet Pons I, Martinez Martinez MI, Roma Sanchez R: Self-reported versus measured height, weight and body mass index in Spanish Mediterranean teenagers: effects of gender, age and weight on perceptual measures of body image.Ann Nutr Metab2002,46:68-72. 11. Wang Z, Patterson CM, Hills AP:A comparison of self-reported and
measured height, weight and BMI in Australian adolescents.Aust N Z J Public Health2002,26:473-478.
12. Giacchi M, Mattei R, Rossi S:Correction of the self-reported BMI in a teenage population.Int J Obes Relat Metab Disord1998,22:673-677. 13. Tienboon P, Wahlqvist ML, Rutishauser IH:Self-reported weight and height
in adolescents and their parents.J Adolesc Health1992,13:528-532. 14. Galan I, Gandarillas A, Febrel C, Meseguer C:[Validation of self-reported
weight and height in an adolescent population].Gac Sanit2001, 15:490-497.
15. Tokmakidis SP, Christodoulos AD, Mantzouranis NI:Validity of self-reported anthropometric values used to assess body mass index and estimate obesity in Greek school children.J Adolesc Health2007,40:305-310. 16. Crawley HF, Portides G:Self-reported versus measured height, weight
and body mass index amongst 16-17 year old British teenagers.Int J Obes Relat Metab Disord1995,19:579-584.
17. Abalkhail BA, Shawky S, Soliman NK:Validity of self-reported weight and height among Saudi school children and adolescents.Saudi Med J2002, 23:831-837.
18. Zhou X, Dibley MJ, Cheng Y, Ouyang X, Yan H:Validity of self-reported weight, height and resultant body mass index in Chinese adolescents and factors associated with errors in self-reports.BMC Public Health2010, 10:190.
19. Landsberg B, Bastian I, Plachta-Danielzik S, Lange D, Johannsen M, Seiberl J, Muller MJ:[Self-Reported and Measured Height and Weight in Adolescents].Gesundheitswesen2010.
21. Himes JH, Faricy A:Validity and reliability of self-reported stature and weight of US adolescents.Am J Hum Biol2001,13:255-260. 22. Jansen W, van de Looij-Jansen PM, Ferreira I, de Wilde EJ, Brug J:
Differences in measured and self-reported height and weight in Dutch adolescents.Ann Nutr Metab2006,50:339-346.
23. Strauss RS:Comparison of measured and self-reported weight and height in a cross-sectional sample of young adolescents.Int J Obes Relat Metab Disord1999,23:904-908.
24. Morrissey SL, Whetstone LM, Cummings DM, Owen LJ:Comparison of self-reported and measured height and weight in eighth-grade students.J Sch Health2006,76:512-515.
25. Shannon B, Smiciklas-Wright H, Wang MQ:Inaccuracies in self-reported weights and heights of a sample of sixth-grade children.J Am Diet Assoc 1991,91:675-678.
26. Elgar FJ, Roberts C, Tudor-Smith C, Moore L:Validity of self-reported height and weight and predictors of bias in adolescents.J Adolesc Health 2005,37:371-375.
27. Tsigilis N:Can secondary school students’self-reported measures of height and weight be trusted? An effect size approach.Eur J Public Health2006,16:532-535.
28. Goodman E, Hinden BR, Khandelwal S:Accuracy of teen and parental reports of obesity and body mass index.Pediatrics2000,106:52-58. 29. Kurth BM, Kamtsiuris P, Holling H, Schlaud M, Dolle R, Ellert U, Kahl H,
Knopf H, Lange M, Mensink GB,et al:The challenge of comprehensively mapping children’s health in a nation-wide health survey: design of the German KiGGS-Study.BMC Public Health2008,8:196.
30. Kromeyer-Hauschild K, Wabitsch M, Kunze D, Geller F, Geiß HC, Hesse V, von Hippel A, Jaeger U, Johnson D, Korte W,et al:[Percentiles of body mass index in children and adolescents evaluated from different regional German studies].Monatsschrift Kinderheilkunde2001,149:807-818. 31. Morgan JF, Reid F, Lacey JH:The SCOFF questionnaire: assessment of a
new screening tool for eating disorders.Bmj1999,319:1467-1468. 32. Tanner JM:Growth at adolescence.Second edition. Oxford: Blackwell
Scientific Publications; 1962.
33. Lange M, Kamtsiuris P, Lange C, Schaffrath Rosario A, Stolzenberg H, Lampert T:[Sociodemographic characteristics in the German Health Interview and Examination Survey for Children and Adolescents (KiGGS) - operationalisation and public health significance, taking as an example the assessment of general state of health].Bundesgesundheitsblatt Gesundheitsforschung Gesundheitsschutz2007,50:578-589.
34. Schenk L, Ellert U, Neuhauser H:[Children and adolescents in Germany with a migration background. Methodical aspects in the German Health Interview and Examination Survey for Children and Adolescents (KiGGS)].Bundesgesundheitsblatt Gesundheitsforschung Gesundheitsschutz 2007,50:590-599.
35. Cohen J:Statistical Power Analysis for the Behavioural Sciences.2 edition. Hillsdale, New Jersey: Lawrence Erlbaum Associates; 1988.
36. Bland JM, Altman DG:Measuring agreement in method comparison studies.Stat Methods Med Res1999,8:135-160.
37. Rothman KJ, Greenland S:Modern Epidemiology.second edition. Philadelphia: Lippincott-Raven Publishers; 1998.
38. Stolzenberg H, Kahl H, Bergmann KE:[Body measurements of children and adolescents in Germany. Results of the German Health Interview and Examination Survey for Children and Adolescents (KiGGS)]. Bundesgesundheitsblatt Gesundheitsforschung Gesundheitsschutz2007, 50:659-669.
39. Kleiser C, Schaffrath Rosario A, Mensink GB, Prinz-Langenohl R, Kurth BM: Potential determinants of obesity among children and adolescents in Germany: results from the cross-sectional KiGGS Study.BMC Public Health 2009,9:46.
40. Walter C, Friedrich L, Leonhaeuser IU:[Nutrition behaviour and nutritional status of primary school children living in Nuremberg, Germany. A regional study considering socioeconomic differences].Ernaehrung2008, 2:58-67.
41. Kahl H, Schaffrath Rosario A, Schlaud M:[Sexual maturation of children and adolescents in Germany. Results of the German Health Interview and Examination Survey for Children and Adolescents (KiGGS)]. Bundesgesundheitsblatt Gesundheitsforschung Gesundheitsschutz2007, 50:677-685.
42. Kurth B, Ellert U:Estimated and measured BMI and self perceived body image of adolescents in Germany: Part 1: General implications for
correcting prevalence estimations of overweight and obesity.Obesity facts2010,3:181-190.
doi:10.1186/1756-0500-4-414
Cite this article as:Brettschneideret al.:Validity and predictors of BMI derived from self-reported height and weight among 11- to 17-year-old German adolescents from the KiGGS study.BMC Research Notes2011
4:414.
Submit your next manuscript to BioMed Central and take full advantage of:
• Convenient online submission
• Thorough peer review
• No space constraints or color figure charges
• Immediate publication on acceptance
• Inclusion in PubMed, CAS, Scopus and Google Scholar
• Research which is freely available for redistribution