S H O R T R E P O R T
Open Access
Expression stability of putative reference genes
in equine endometrial, testicular, and conceptus
tissues
Claudia Klein
1*, Josep Rutllant
2and Mats HT Troedsson
1Abstract
Background:Quantitative RT-PCR data are commonly normalized using a reference gene. A reference gene is a transcript which expression does not differ in the tissue of interest independent of the experimental condition. The objective of this study was to evaluate the stability of mRNA expression levels of putative reference genes in three different types of equine tissue, endometrial, testicular, and conceptus tissue.
Findings:The expression stability of four (uterine tissue) and six (testicular and conceptus tissue) was assessed using descriptive data analysis and the software programs Normfinder and geNorm. In uterine samples,18S showed the largest degree of variation in expression whileGAPDH,B2M, and ACTBwere stably expressed.B2Mand GAPDHwere identified as the most stably expressed genes in testicular samples, while18Sshowed some extent of regulation between samples. Conceptus tissue overall was characterized by very low variability of the transcripts analyzed withGAPDH, YWHZ, and 18S being the most stably expressed genes.
Conclusions:In equine endometrium,GAPDH,B2M, andACTBtranscript levels are equally stable, while18S is less stably expressed. In testes and associated structures,B2M andGAPDHare the transcripts showing the least amount of variation, while in conceptus tissueGAPDH,YWHZ, and18Swere identified as the most suitable reference genes. Overall, transcripts analyzed in conceptus tissue were characterized by less variation than transcripts analyzed in uterine and testicular tissue.
Background
Real-time reverse transcription PCR (Real-time RT-PCR), also referred to as quantitative PCR (RT-qPCR) is a powerful tool to determine quantitative changes in mRNA expression levels and is widely applied in repro-ductive biology research. This technology provides a means to compare the abundance of a certain transcript of interest in tissue obtained from different biological sta-tuses or to assess the impact of an experimental treat-ment on the expression of the gene of interest. Normalization procedures are an essential step in the analysis of real-time RT-PCR data to ensure that observed changes in transcript abundance reflect biologi-cal variation rather than systematic variation. Sources for systematic or non-biological variation include the
amount of RNA input into the reverse transcription reac-tion, the efficiency of the reverse transcription reacreac-tion, pipetting accuracy while preparing the PCR reaction, and the presence of PCR inhibitory substances in a sample. Normalization procedures are therefore applied to cor-rect for the occurrence of these systematic variations. A common normalization procedure is to report the expression level of the transcript of interest relative to the expression level of a reference gene. A reference gene, also referred to as maintenance or internal control gene, is a transcript whose expression level is constant in the specific tissue of interest, i.e. its mRNA abundance does not change with experimental treatment or with dif-ferent biological conditions [1]. Stability of the reference gene/genes used in real-time RT-PCR events is crucial to avoid changes in gene expression of the transcript of interest due to their variation being interpreted as biolo-gical variation. Studies to determine reliable reference genes for equine skin and equine lymphocytes during
* Correspondence: [email protected] 1
University of Kentucky, Department of Veterinary Science, 108 Gluck Equine Research Center, Lexington, KY, 40546, USA
Full list of author information is available at the end of the article
exercise induced stress have been carried out [2,3]. There is no consensus regarding the most appropriate gene to use as an internal reference gene in RT-qPCR utilizing equine endometrial, testicular, or conceptus tissue sam-ples. The objective of this study was to evaluate the stabi-lity of mRNA expression levels of putative reference genes in three different types of equine tissue, endome-trial, testicular, and conceptus tissue.
Materials and methods
Animals and Tissue Collection
Collection of endometrium and conceptuses
All animal procedures were completed in accordance with and with the approval of the Institutional Animal Care and Use Committee at the University of Kentucky (protocol number 2008-0351). Endometrial tissue samples were recovered from cyclic mares 8 days (n = 4), 10 days (n = 5), 12 days (n = 6), 14 days (n = 5), and 16 days (n = 4) after ovulation, from pregnant mares endometrial tissue samples were recovered at Day 10 (n = 4), Day 12 (n = 4), and Day 16 (n = 3) of pregnancy. Pregnancy status was confirmed via transrectal ultrasonography. If no embryo was detected the mare was excluded from sample collection. Endome-trial tissue samples were recovered transcervically using a punch biopsy instrument. Tissue specimens were snap-fro-zen in liquid nitrogen and stored at -80°C till further pro-cessing. Tissue samples were collected from a total of 17 different mares. Ten mares were used more than once for sample collection such that a total of 35 samples could be collected. Conceptuses were retrieved from pregnant mares through transcervical flush. Four conceptuses each were recovered 8, 10, 12, and 14 after ovulation.
Collection of testis and associated structures
Testes and associated structures were collected from mature stallions during routine castration and trans-ported on ice to the lab within 30 min. Samples were obtained from testicular parenchyma (n = 11), head (n = 4), body (n = 4), and tail of the epididymis (n = 5), and the ductus deferens (n = 6). Tissue specimens were snap-frozen in liquid nitrogen and stored at -80°C till further processing.
Isolation of RNA
Total cellular RNA from endometrial and testicular samples was isolated using Trizol reagent (Invitrogen, Carlsbad, CA) according to the manufacturer’s recom-mendation followed by precipitation using an equal volume of isopropanol and 1/10 volume of 3 M sodium acetate. Total cellular RNA from conceptus tissue was isolated using RNeasy Mini kit (Quiagen, Valencia, CA). RNA was quantified via spectrophotometry using a NanoDrop ND-1000. Samples with a 260/280 ratio of 1.95 or greater and a 260/230 ratio of 2.0 or greater were used for analysis.
Real-time RT-PCR
Real-time RT-PCR experiments were carried out under the consideration of the MIQE guidelines [4]. RNA sam-ples (2 μg/reaction for endometrial and testicular speci-mens, and 200 ng/reaction for conceptus specimens) were treated with RNase-free DNase I (Ambion, Austin, TX) for 15 min at 37°C, heat denatured (75°C for 10 min), then reverse transcribed using High Capacity cDNA Reverse Transcription Kit and random hexamers (Applied Biosystems, Foster City, CA). cDNA was puri-fied using the QIAquick®PCR Purification Kit (Qiagen, Germantown, MD) and cDNA concentration was deter-mined via spectrophotometry. Purified cDNA (50 ng) was used for each PCR reaction.
For endometrial specimen, the mRNA expression of four putative reference genes, glyceraldehyde 3-phos-phate dehydrogenase (GAPDHP), 18S rRNA (18S), beta-2-microglobulin (B2M), and beta actin (ACTB) and one non-reference gene, solute carrier family 36 member 2 (SLC36A2) were measured by real-time RT-PCR. For testicular samples, the mRNA expression ofGAPDH, 18S, B2M, ACTB, Succinate dehydrogenase complex (SDHA), and beta glucoronidase (GUSB) as putative internal control genes and aromatase (Cyp19a1) as non-reference transcript were determined. For conceptus tis-sue, the expression of GAPDH, 18S, B2M, ACTB, SDHA, and tyrosine 3-monooxygenase/tryptophan 5-monooxygenase activation protein (YWHAZ) as refer-ence gene candidates and Cyp19a1as non-reference genes was assessed using quantitative PCR. Primers spe-cific for the selected transcripts were designed using Jel-lyfish 3.3.1 (Field Scientific LLC, Lewisburg, PA) and are listed in Table 1. Specificity of the primers was con-firmed via sequencing of the PCR products to confirm amplification of the intended target sequence. Primer efficiency was assessed using Linreg http://www.gene-quantification.de to ensure all primers resulted in PCR efficiencies of at least 1.9. Real-time PCR was completed using SYBR Green PCR Master Mix (Applied Biosys-tems) with the following cycling conditions: 95°C for 10 min; 40 cycles of 95°C for 15 sec, 59°C for 1 min; 55 to 95°C for dissociation. Each PCR was performed in tripli-cate. Specificity of amplification was monitored by including non-reverse transcribed RNA reactions for each sample and by completing a dissociation analysis at the end of each real-time run to verify the amplification of a single product. Cycle threshold (Ct) values were obtained through the auto Ct function.
Data analysis
(Microsoft Corporation, Redmond, WA). Excel and GraphPadPrism (La Jolla, CA) were used for further analysis of the dataset. Linreg was used to determine the efficiencies of each PCR reaction. Efficiency corrected Ct values from triplicate reactions were averaged for further analysis and are from now on referred to as Ct value. Mean Ct values, their standard error of measurement (SEM) and their coefficient of variation across the 35 samples were calculated for each of the putative refer-ence genes. Ct values were logarithmically transformed and mean log transformed Ct values for each gene visualized using box and whisker plots. For each sample, ratios of mean Ct values among the putative reference genes were formed including all possible combinations. The mean and the coefficient of variation (CV) of the resulting ratios were calculated. Box and whisker plots were used to visualize the ratios of mean Ct values.
Two freely available software packages designed to identify stably expressed genes among a set of candidate genes, NormFinder http://www.mdl.dk/publications-normfinder.htm and geNorm http://medgen.ugent.be/ ~jvdesomp/genorm/, were used for further expression stability analysis. Bestkeeper [5] is another freely avail-able software that determines stavail-able reference genes through pair-wise correlation analysis. This software was not used in the current study to limit the extent of the manuscript.
NormFinder
NormFinder is publicly available software that uses an algorithm to identify the optimal normalization gene among a set of candidates. It ranks the set of candidate normalization genes according to their expression stabi-lity in a given sample set. The output provided by NormFinder includes an arbitrary stability value for each gene. The model and statistical framework underly-ing this software are described in Andersen et al. [6]. geNorm
geNorm is publicly available software package that determines the most stable genes from a set of tested genes. This application differs from NormFinder in that
it determines the stability of the best pair of reference genes and not the most stable individual gene. The underlying principles and calculations are described in Vandesompele et al. [7].
Calculation of delta values
Delta Ct (ΔCt) values for SLC36A2(endometrial sam-ples), and Cyp19a1 (testicular and conceptus tissue) were calculated using each of the putative reference genes. Delta delta Ct (ΔΔCt) values relative to expres-sion levels at Day 8 of the cycle (endometrial samples), ductus deferens (testicular samples), and Day 8 concep-tus (concepconcep-tus tissue) respectively were then deter-mined. Pearson’s correlation coefficients were calculated for the resulting ΔΔCt values using SAS (SAS, Cory, NY).
Results
Endometrial samples
18Sshowed the highest level of mRNA abundance with a mean Ct value of 9.01 ± 0.25, whereas GAPDH, ACTB, andB2MmRNA showed lower expression levels with mean Ct values of 23.47 ± .21, 21.29 ± 0.23, and 20.64 ± 0.24, respectively.
Mean Ct values for18Sdisplayed the greatest amount of deviation with a CV of 17.07%. Mean Ct values for GAPDHdisplayed the least amount of variation with a
CV of 5.24%. Mean Ct values for ACTB and B2M
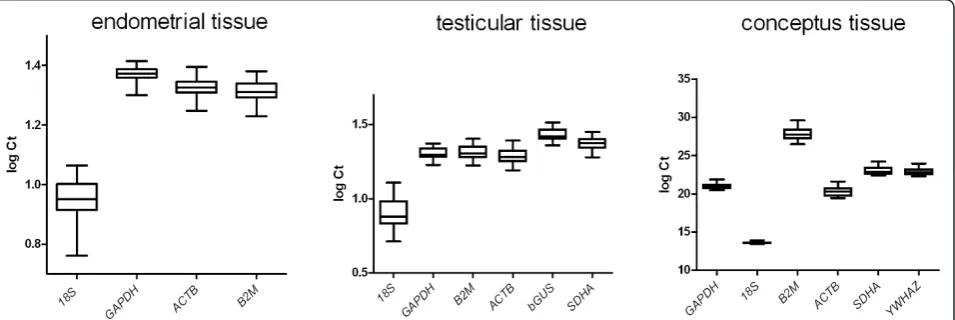
showed a similar degree of variability as those for GAPDH, with coefficient of variations of 6.39% and 7.04% (Table 2). Figure 1 displays the log transformed mean cycle threshold values for each of the four puta-tive reference genes in the form of box and whiskers plots. Ct values are shown as median (lines), whereby the length of the box represents the 25thand 75th per-centile, respectively. The symbol in the box indicates the mean. The vertical lines, i.e. whiskers, extend to the group minimum and maximum values. Upon subjective evaluation, 18Sshowed the greatest degree of variation.
[image:3.595.57.540.100.233.2]To evaluate expression stability, ratios of Ct values for all possible gene combinations were formed and graphed
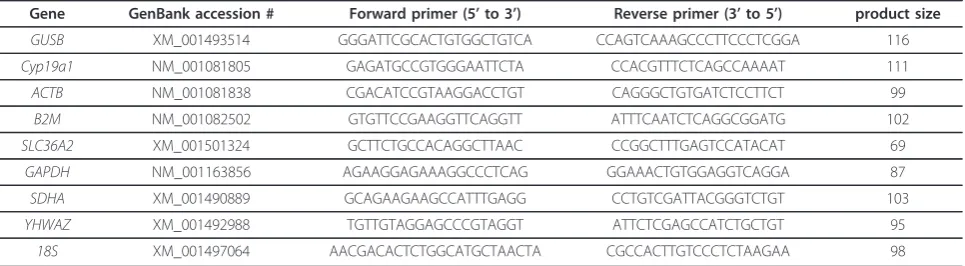
Table 1 Primer sequences used in the current study
Gene GenBank accession # Forward primer (5’to 3’) Reverse primer (3’to 5’) product size
GUSB XM_001493514 GGGATTCGCACTGTGGCTGTCA CCAGTCAAAGCCCTTCCCTCGGA 116
Cyp19a1 NM_001081805 GAGATGCCGTGGGAATTCTA CCACGTTTCTCAGCCAAAAT 111
ACTB NM_001081838 CGACATCCGTAAGGACCTGT CAGGGCTGTGATCTCCTTCT 99
B2M NM_001082502 GTGTTCCGAAGGTTCAGGTT ATTTCAATCTCAGGCGGATG 102
SLC36A2 XM_001501324 GCTTCTGCCACAGGCTTAAC CCGGCTTTGAGTCCATACAT 69
GAPDH NM_001163856 AGAAGGAGAAAGGCCCTCAG GGAAACTGTGGAGGTCAGGA 87
SDHA XM_001490889 GCAGAAGAAGCCATTTGAGG CCTGTCGATTACGGGTCTGT 103
YHWAZ XM_001492988 TGTTGTAGGAGCCCGTAGGT ATTCTCGAGCCATCTGCTGT 95
in the form of box and whiskers plots (Figure 2). The
gene comparisons involving 18S rRNA showed the
greatest extent of variability. This observation was also reflected in an increased CV for the Ct ratios when 18S was compared with the other genes. Mean Ct ratios including 18S had an average CV of 13.29, whereas those ratios not including 18S had an average CV of 4.37.
The stability values provided by NormFinder are listed in Table 3.B2Mhad the lowest stability value with 0.02, thereby being the most stable gene among the tested transcripts. GAPDH and ACTBhad the same stability value of 0.028, which was slightly higher than the value forB2M. 18Swas ranked the least stable gene with the highest stability value of 0.06.
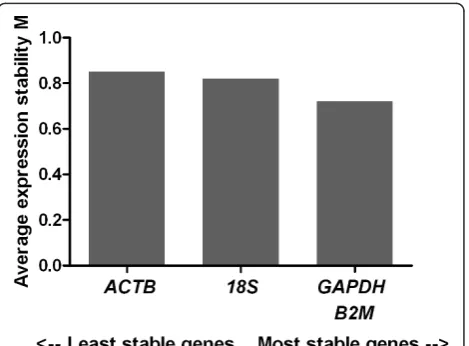
Upon analysis using geNorm, all four tested genes returned an average expression stability M value of less than 1.5, indicating stable expression across samples (Figure 3). geNorm determinedGAPDHandB2Mto be the most stably expressed pair of genes.
To validate the above listed analysis concerning the stable expression of18S, GAPDH, ACTBand B2M, Ct values for SLC36A2 were determined and normalized
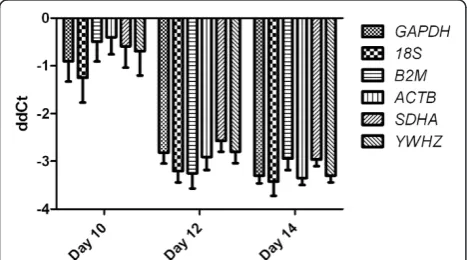
using each of the four putative reference genes. Normal-ization was carried out by determining ΔCt values for SLC36A2. Expression levels of SLC36A2 were then determined relative to levels observed at Day 8 of the estrous cycle by generating ΔΔCt values. Pearson’s cor-relation analysis of these ΔΔCt values revealed a high degree of correlation. Each of the six possible pair wise correlations showed an r-value of 0.99 and a p-value of less than 0.0001. Average ΔΔCt values for each of the four putative reference genes and seven types of endo-metrial tissue are shown in Figure 4.
Testis and associated structures
18Sshowed the highest level of mRNA abundance with a mean Ct value of 8.19 ± 0.39, while the remaining transcripts showed similar abundance with a mean Ct value of 20.22 ± 0.32 (GAPDH), 20.67 ± 0.4 (B2M), 19.55 ± 0.44 (ACTB), 27.13 ± 0.49 (GUSB), and 23.65 ± 0.42 (SDHA) respectively.
Mean Ct values for18Sdisplayed the greatest amount of deviation with a CV of 26.26%. Mean Ct values for GAPDHdisplayed the least amount of variation with a CV of 8.72%. The remaining transcripts showed a slightly higher CV thanGAPDH(Table 2). Upon subjec-tive evaluation of box and whiskers plots displaying the log transformed Ct values, 18S showed the greatest degree of variation (Figure 1). Figure 2 shows box and whisker plots visualizing the mean ratios of all Ct values for each gene combination. Upon subjective evaluation the gene comparison involving 18S rRNA showed the greatest extent of variability, which was reflected in an increased CV for mean Ct ratios including18S(15.75% versus 5.61% for Ct ratios not including18S).
[image:4.595.56.291.121.222.2]The stability values returned by NormFinder (Table 3) identified B2M as the most stably expressed gene (0.018). ACTBand GAPDH had higher, i.e. less stable
Table 2 Coefficient of variation of Ct values for transcripts tested in uterine, testicular, and conceptus tissue
Uterine tissue Testicular tissue Conceptus tissue
Transcript CV (%) Transcript CV (%) Transcript CV (%)
GAPDH 5.24 GAPDH 8.72 18S 0.86
ACTB 6.39 SDHA 9.76 GAPDH 1.75
B2M 7.04 GUSB 9.89 YWHZ 1.87
18S 17.07 B2M 10.67 SDHA 2.23
ACTB 12.37 ACTB 2.88
18S 26.26 B2M 3.38
[image:4.595.61.539.542.702.2]stability values thanB2M(0.033 and 0.039), followed by SDHAand GUSB with a stability value of 0.043 each. 18Swas ranked the least stable transcript with a stability value of 0.163.
Upon geNorm analysis, all six transcripts resulted in a M value of less than 1.5, equating stable expression (Fig-ure 5). geNorm furthermore determinedB2M and18S as the most stable gene combination.
To validate the above listed analyses concerning the stable expression of18S,GAPDH,ACTB,B2M,SDHA, andGUSB, Ct values forCyp19a1were determined and normalized using each of the six putative reference genes. Normalization was carried out by determining
ΔCt values forCyp19a1. Expression levels ofCyp19a1 were then determined relative to levels observed in testis by generatingΔΔCt values. Pearson’s correlation analy-sis of theseΔΔCt values revealed a high degree of corre-lation. Each of the fourteen possible pair wise correlations showed an r-value of 0.98 or higher and a p-value of less than 0.0001. Average ΔΔCt values for
each of the four putative reference genes and four types testicular tissue are shown in Figure 6.
Conceptus tissue
18Sshowed the highest level of mRNA abundance with a mean Ct value of 13.58 ± 0.03, while B2Mexhibited the lowest levels with a mean Ct value of 27.81 ± 0.24. The remaining transcripts showed average expression levels with 20.97 ± 0.09 (GAPDH), 20.34 ± 0.15 (ACTB), 22.90 ± 0.11 (YWHZ), and 23.06 ± 0.13 (SDHA).
[image:5.595.59.540.90.288.2]Mean Ct values for18S displayed the least amount of deviation with a CV of 0.86%. Mean Ct values for GAPDHdisplayed the greatest amount of variation with a CV of 3.38%. Mean Ct values for remaining transcripts
[image:5.595.306.541.515.688.2]Figure 2Ratios of mean cycle threshold values for each possible combination of transcripts evaluated in endometrial, testicular and conceptus tissue.
Table 3 Gene stability values returned by Normfinder
Uterine tissue Testicular tissue Conceptus tissue
Transcript Stability value
Transcript Stability value
Transcript Stability value
B2M 0.020 B2M 0.018 YWHZ 0.003
GAPDH 0.028 ACTB 0.033 GAPDH 0.007
ACTB 0.028 GAPDH 0.039 SDHA 0.010
18S 0.060 SDHA 0.043 18S 0.013
GUSB 0.043 ACTB 0.015
18S 0.163 B2M 0.029
The lower the stability value, the more stable the gene is expressed.
[image:5.595.56.292.611.721.2]showed as similar degree variation (Table 2). Figure 1 displays the log transformed mean Ct values for each of the four putative reference genes in the form of box and whiskers plots. Upon subjective evaluation18S showed the least, andB2Mthe greatest degree of variation.
To evaluate expression stability, ratios of Ct values for all possible gene combinations were formed and graphed in the form of box and whiskers plots (Figure 2). The gene comparisons involving B2M showed the greatest extent of variability. This observation was also reflected in an increased CV for the Ct ratios when B2M was compared with the other genes. Mean Ct ratios includ-ingB2M had an average CV of 13.29%, whereas those ratios not includingB2Mhad an average CV of 4.37%.
The stability values provided by NormFinder are listed in Table 3. YHWZhad the lowest stability value with 0.003, thereby being the most stable gene among the
tested transcripts.B2Mwas ranked the least stable gene with the highest stability value of 0.06.
[image:6.595.303.542.87.229.2]Upon analysis using geNorm, all six tested genes returned an average expression stability M value of less than 1.5, indicating stable expression across samples (Figure 7). geNorm determinedGAPDHand YHWZto be the most stably expressed pair of genes, while B2M was ranked least stable.
[image:6.595.57.294.88.226.2]As described for uterine and testicular tissue, Ct values for Cyp19a1were determined and normalized using each of the six putative reference genes. Normali-zation was carried out by determiningΔCt values for Cyp19a1. Expression levels ofCyp19a1were then deter-mined relative to levels observed in Day 8 conceptuses by generatingΔΔCt values. Pearson’s correlation analy-sis of theseΔΔCt values revealed a high degree of corre-lation. Pair wise correlations no including B2M showed an r-value of 0.98 or greater and a p-value of less than 0.0001. Pair wise correlations includingB2Mshowed an
Figure 4Relative quantification ofSLC36A2expression in uterine tissue. Displayed are averageΔΔCt values with SEM.ΔΔCt values generated usingGAPDHfor normalization showed the least amount of variability, with an average SEM of 1.06, whileΔΔCt values generated using18Sfor normalization showed the greatest degree of variability with an average SEM of 1.4.
[image:6.595.58.291.546.683.2]Figure 5 Expression stability values (M) of the putative reference genes tested in testicular, epididymal, and ductus deferens tissue. Transcripts are ranked from the least stable to the most stable (left to right).
Figure 6Relative quantification of Cyp19a1expression in testicular, epididymal, and ductus deferens tissue. Displayed are averageΔΔCt values with SEM.ΔΔCt values generated usingB2Mfor normalization showed the least amount of variability, with an average SEM of 1.2, whileΔΔCt values generated usingSDHAand ACTBfor normalization showed the greatest degree of variability with an average SEM of 1.52.
[image:6.595.304.540.574.692.2]average r-value of 0.83 and a p-value of 0.001. Average
ΔΔCt values for each of the six putative reference genes and three developmental stages of conceptus develop-ment are shown in Figure 8.
Discussion
Real time RT-PCR is one of the most sensitive and reproducible quantification methods for gene expression analysis. Selection of internal control genes is a crucial step in the experimental design process, as relative quantification procedures rely on the stable expression of such internal control or reference genes among sam-ples regardless of the biological conditions. The most suitable reference gene has to be determined for each tissue as a gene stably expressed in one type of tissue is not necessarily stably expressed in another type of tis-sue. However, control genes are commonly chosen on the basis of observations from research on other tissue types or on the same tissue type in a different species. The present study was performed to determine the suit-ability of selected putative internal control genes in three different types of tissues when performing real-time RT-PCR analysis in the equine species.
Uterine samples
18S rRNA, GAPDH, ACTB, and B2M are commonly
used as internal control genes when performing quanti-tative PCR analysis on uterine tissue samples derived from species such as human or mouse. As expected,18S rRNA showed the highest level of mRNA abundance while GAPDH,ACTB, andB2M showed lower expres-sion levels. The average cycle threshold value across all 35 analyzed samples showed the greatest degree of variability for 18S rRNA whereas the remaining three transcripts displayed a low degree of variation. Ct ratios for all possible pair wise combinations were formed. Assuming stable expression, one would expect a low
variability in the resulting ratios. However, a pattern emerged, whereby comparisons including18Sdisplayed increased deviation, and comparisons excluding 18S showed low deviation. This is in accordance with the greater degree of variability observed for18SCt values. NormFinder, a publicly available program that ranks transcripts according to their expression stability, returned18Sas the least stably expressed gene support-ing the results of the above mentioned descriptive ana-lyses. B2M was listed the most stable expressed gene, closely followed byGAPDH andACTB. geNorm identi-fiedGAPDHandB2Mas the most stably expressed pair of genes. Overall, all four genes were identified as stable amongst the samples analyzed with 18Sbeing slightly less stably expressed thanGAPDH,B2M, and ACTB.
To validate the suitability of the tested transcripts as reference genes, expression levels for SLC36A2 were determined.SLC36A2had previously been identified as highly up-regulated during early pregnancy and was chosen with the hypothesis that its expression levels would vary throughout the estrous cycle and early preg-nancy [8]. Cycle threshold values for SLC36A2 were normalized using each of the four putative reference genes through generatingΔCt values. Expression values relative to levels observed at Day 8 of the estrous cycle were determined through determiningΔΔCt values. Pair wise comparisons of resulting ΔΔCt values revealed that all six possible pair wise combinations were highly cor-related. High correlation of ΔΔCt values reflects the similar expression of all putative reference genes across the tested samples. AverageΔΔCt values for each of the seven biological conditions showed the greatest degree of variation when18Swas used for normalization, while GAPDH as normalization factor resulted in the least degree of variability. This finding supports the above stated conclusion that all four genes were identified as stably amongst the samples analyzed with 18S being slightly less stably expressed than GAPDH, B2M, and ACTB.
[image:7.595.57.291.551.681.2]Surprisingly few studies concerning the ideal selection of reference genes in endometrial tissue have been pub-lished. Murray and others [9] evaluated the appropriate-ness of several transcripts as reference genes on endometrial tissue specimens obtained from women throughout the menstrual cycle and then tested the suit-ability of these genes to detect the variation of estrogen and progesterone receptor levels during the course of the cycle. geNorm determined GAPDH to be amongst the most stably expressed genes, which is in agreement with the results of the current study in horse tissues. ACTB, which expression was ranked as stable according to geNorm, however failed to detect changes in endo-metrial estrogen and progesterone receptor levels and was therefore determined to be not suitable as a
reference gene. This underlines the importance to not only test the stability of a putative reference gene for a specific tissue type, but also the necessity to evaluate each species individually. Walker and co-workers evalu-ated a set of endogenous control genes for bovine endo-metrial tissue. The transcripts tested in that study however did not overlap with those tested in the present study so that a comparison of results is not possible [10]. The expression of18S, the transcript showing the greatest variation across the 35 samples analyzed in this study, has been identified as regulated by progesterone in the murine uterus [11]. This observation may provide some explanation for the observed variation of18S in equine endometrial tissue samples collected throughout the estrous cycle, as these samples have been exposed to endogenous progesterone of luteal origin for variable time periods.
Testis and associated structures samples
Gene expression levels of 18S, GAPDH, B2M, ACTB, GUSB, andSDHAwere measured in 30 tissue samples collected from testis, epididymis, and ductus deferens. As expected, 18S rRNA showed the highest level of mRNA abundance. The average cycle threshold value across all samples analyzed showed the greatest degree of variability for 18S rRNAwhereas the remaining four transcripts displayed a low, and GAPDH the lowest degree of variation. Ct ratios for all possible pair wise combinations were formed, whereby comparisons including 18S displayed increased deviation, and com-parisons excluding18Sshowed low deviation. This is in accordance with the greater degree of variability observed for 18SCt values. NormFinder identified18S as the least stably expressed gene supporting the results of the above mentioned descriptive analyses. Upon geN-orm analysis,18S,B2M andGAPDHwere listed as the most stably expressed genes. Surprisingly, geNorm iden-tifiedB2Mand18Sas the most stably expressed pair of genes. This finding disagrees with NormFinder, which ranked18S as the least stable transcript and in addition does not match the descriptive analysis of the dataset which identified18Sas the gene with the largest degree of variability. This is the only case throughout this data analysis in which results returned by NormFinder and geNorm do not match. The descriptive analysis however supports the results returned by NormFinder.
As performed for the analysis on uterine tissue, the suitability of the tested transcripts as reference genes was validated through determining the relative expres-sion levels for a non-reference transcript, in this case the relative expression ofCyp19a1to levels observed in testis.Cyp19a1, an enzyme involved in the biosynthesis of estrogens was chosen because of its known high level of expression in testicular tissue. Pair wise comparisons
of resulting ΔΔCt values revealed that all thirteen possi-ble pair wise combinations were highly correlated.
The authors were not able to find information regard-ing the evaluation of internal control genes in testicular, epididymal, or ductus deferens tissue, neither in the horse nor in any other species. Overall, the current ana-lysis revealed B2M and GAPDH as the most stable expressed transcripts in the set of tissue used and are therefore recommended to use as internal control genes.
Conceptuses
As seen for uterine and testicular tissue,18Sshowed the
highest mRNA abundance. B2M exhibited lowest
mRNA levels with the remaining transcripts at inter-mediate levels. Unlike the other types of tissues tested 18SmRNA showed the least amount of variation among the transcripts analyzed with a CV of mean Ct values of less than one percent.B2Mshowed the greatest degree of variability during the course of the descriptive analy-sis which became especially evident when forming ratios of Ct values for all possible gene combinations. Like-wise, B2M was identified as the least stable expressed
gene by NormFinder and geNorm, while YWHZ and
GAPDH were determined to be the most stable tran-scripts. Despite the descriptive analysis, which revealed 18Sas the transcript with the least amount of variation, i.e. the most stable gene, both NormFinder and geNorm did not rank 18S as the most stably expressed gene.
Cyp19a1 mRNA levels were employed to determine
relative expression levels for a non-reference transcript, as abundance for this transcript had previously been identified to change with conceptus development (Klein, unpublished observation). Formation of ΔΔCt values relative to Day 8 conceptuses for Cyp19a1 and their pair wise comparisons revealed high correlation for combinations not including B2M normalized ΔΔCt values, further corroborating the above listed findings.
could not be confirmed and is in line with the stable expression ofSDHAdescribed for bovine embryos [13].
In general the current analysis revealed18S, GAPDH, and YWHZ to be the most stable transcript in pre-implantation equine embryos and are recommended as reference genes for RT-qPCR experiments.
Author details
1University of Kentucky, Department of Veterinary Science, 108 Gluck Equine Research Center, Lexington, KY, 40546, USA.2College of Veterinary Medicine, Western University of Health Sciences, 309 East Second Street, Pomona, CA 91766, USA.
Authors’contributions
CK designed and conducted the study. JR participated in design of the study and drafting the manuscript. MHT conceived the study, participated in its coordination and helped to draft the manuscript. All authors read and approved the final manuscript.
Competing interests
None of the authors in this study has any financial personal relationship with any organization that could influence (bias) this work.
Received: 2 October 2010 Accepted: 12 April 2011 Published: 12 April 2011
References
1. Ferre F:Quantitative or semi-quantitative PCR: reality versus myth.PCR Methods Appl1992,2:1-9.
2. Bogaert L, Van Poucke M, De Baere C, Peelman L, Gasthuys F, Martens A: Selection of a set of reliable reference genes for quantitative real-time PCR in normal equine skin and in equine sarcoids.BMC Biotechnol2006, 6:24.
3. Cappelli K, Felicetti M, Capomaccio S, Spinsanti G, Silvestrelli M, Supplizi AV: Exercise induced stress in horses: selection of the most stable reference genes for quantitative RT-PCR normalization.BMC Mol Biol2008,9:49. 4. Bustin SA, Benes V, Garson JA, Hellemans J, Huggett J, Kubista M, Mueller R,
Nolan T, Pfaffl MW, Shipley GL,et al:The MIQE guidelines: minimum information for publication of quantitative real-time PCR experiments. Clin Chem2009,55:611-622.
5. Pfaffl MW, Tichopad A, Prgomet C, Neuvians TP:Determination of stable housekeeping genes, differentially regulated target genes and sample integrity: BestKeeper–Excel-based tool using pair-wise correlations. Biotechnol Lett2004,26:509-515.
6. Andersen CL, Jensen JL, Orntoft TF:Normalization of real-time quantitative reverse transcription-PCR data: a model-based variance estimation approach to identify genes suited for normalization, applied to bladder and colon cancer data sets.Cancer Res2004,64:5245-5250. 7. Vandesompele J, De Preter K, Pattyn F, Poppe B, Van Roy N, De Paepe A,
Speleman F:Accurate normalization of real-time quantitative RT-PCR data by geometric averaging of multiple internal control genes.Genome Biol2002,3:RESEARCH0034.
8. Klein C, Scoggin KE, Ealy AD, Troedsson MH:Transcriptional Profiling of Equine Endometrium During the Time of Maternal Recognition of Pregnancy.Biol Reprod2010.
9. Murray RS, Inman DA, Yuan L, Fritz MA, Young SL:Choice of a constitutive housekeeping gene (HKG) is critical in the analysis of real-time reverse transcriptase polymerase chain reaction (qRT-PCR) results.Fertil Steril 2010,86(3):S38-S39.
10. Walker CG, Meier S, Mitchell MD, Roche JR, Littlejohn M:Evaluation of real-time PCR endogenous control genes for analysis of gene expression in bovine endometrium.BMC Mol Biol2009,10:100.
11. Craythorn RG, Girling JE, Hedger MP, Rogers PA, Winnall WR:An RNA spiking method demonstrates that 18S rRNA is regulated by progesterone in the mouse uterus.Mol Hum Reprod2009,15:757-761. 12. Smits K, Goossens K, Van Soom A, Govaere J, Hoogewijs M,
Vanhaesebrouck E, Galli C, Colleoni S, Vandesompele J, Peelman L: Selection of reference genes for quantitative real-time PCR in equine in
vivo and fresh and frozen-thawed in vitro blastocysts.BMC Res Notes 2009,2:246.
13. Goossens K, Van Poucke M, Van Soom A, Vandesompele J, Van Zeveren A, Peelman LJ:Selection of reference genes for quantitative real-time PCR in bovine preimplantation embryos.BMC Dev Biol2005,5:27.
doi:10.1186/1756-0500-4-120
Cite this article as:Kleinet al.:Expression stability of putative reference genes in equine endometrial, testicular, and conceptus tissues.BMC Research Notes20114:120.
Submit your next manuscript to BioMed Central and take full advantage of:
• Convenient online submission
• Thorough peer review
• No space constraints or color figure charges
• Immediate publication on acceptance
• Inclusion in PubMed, CAS, Scopus and Google Scholar
• Research which is freely available for redistribution