RESEARCH NOTE
Iron tolerance in rice: an efficient method
for performing quick early genotype screening
Adriana Pires Soares Bresolin
1, Railson Schreinert dos Santos
2, Roberto Carlos Doring Wolter
3,
Rogério Oliveira de Sousa
3, Luciano Carlos da Maia
2and Antonio Costa de Oliveira
2*Abstract
Objectives: This study was conducted to establish a method for early, quick and cheap screening of iron excess tolerance in rice (Oryza sativa L.) cultivars.
Results: Based on the experiments, iron excess leads to reduction in shoot length (SL) and this can be a useful characteristic for adequate screening of tolerant genotypes. The sensitive genotypes Nipponbare and BR-IRGA 409 indicated higher accumulation of iron in their tissues while BRS-Agrisul and Epagri 108 also accumulated iron, but at lower concentrations. BR-IRGA 410 displayed an intermediate phenotype regarding iron accumulation. No changes in shoot Cu content can be observed when comparing treatments. On the other hand, an increase was seen for Zn and Mn when shoots are subjected to Fe2+ excess. Fe stress at a lower concentration than 7 mM increased Zn but
decreased Mn contents in shoots of BR-IRGA 409. Strong positive correlations were found here for Fe × Zn (0.93); Fe × Mn (0.97) and Zn × Mn (0.92), probably due to the Fe-induced activation of bivalent cation transporters. Results show that genotypes scored as sensitive present higher concentration of Fe in shoots and this is an efficient method to characterize rice cultivars regarding iron response.
Keywords: Lowland rice, Iron toxicity, Hydroponic culture, Efficient method
© The Author(s) 2019. This article is distributed under the terms of the Creative Commons Attribution 4.0 International License (http://creat iveco mmons .org/licen ses/by/4.0/), which permits unrestricted use, distribution, and reproduction in any medium, provided you give appropriate credit to the original author(s) and the source, provide a link to the Creative Commons license, and indicate if changes were made. The Creative Commons Public Domain Dedication waiver (http://creat iveco mmons .org/ publi cdoma in/zero/1.0/) applies to the data made available in this article, unless otherwise stated.
Introduction
Rice (Oryza sativa L.) is an important cereal used to feed
more than two-thirds of the worlds population, being the source of more than 20% of the calories consumed by
humankind [1]. In this scenario, Brazil, where rice
culti-vation represents an important economic activity, is the
largest rice producer in the Western hemisphere [2].
One of the major abiotic stresses that affect irrigated rice production and expansion is iron toxicity. Iron (Fe) is an essential nutrient for plant metabolic processes such as respiration and photosynthesis. However, when
in excess, it becomes a highly toxic element [3–5]. Even
though most world’s rice production comes from flood-irrigated farms, flooded soils constitute a hypoxic con-dition which favors the reduction of iron, increasing the
concentration of Fe2+ in solution [5, 6]. Iron excess can
cause rusty leaf spots, stained leaf edges, reduction of plant growth, tillering and spikelet fertility. Also, reduc-tions in root system development are observed, which can present dark brown color and stunted growth, with few thick roots. In severe cases, these symptoms
associ-ate with yield losses up to 100% [7, 8].
Rice genotypes greatly vary in their response to iron toxicity and the use of tolerant cultivars is one of the effective strategies for preventing yield loss, especially for
farmers with low income [8, 9].
Considering such background, in this report we aim to evaluate the efficiency of an early, quick and easy method for detection of iron excess tolerance using different rice cultivars.
Main text
Four Brazilian lowland rice (Oryza sativa L.) genotypes
were used in this study. These varieties are recom-mended by the Southern Brazilian Society of Irrigated
Open Access
*Correspondence: [email protected]
2 Plant Genomics and Breeding Center, Universidade Federal de Pelotas,
Pelotas, RS, Brazil
Rice and are known to be tolerant to iron toxicity by
field experiment results [10]: BRS-Agrisul (tolerant),
Epagri 108 (tolerant), IRGA 410 (sensitive) and BR-IRGA 409 (sensitive). Nipponbare, the Japanese variety used for the first rice genome sequencing project, is reported as sensitive to iron toxicity. Here Nipponbare was used due to its available molecular data and as a reference for comparisons between different studies
[11, 12].
Seeds were disinfected with 20% sodium hypochlorite for 10 min, rinsed for three times in ultrapure water and placed in germination paper for 72 h (25 °C; 16 h of pho-toperiod; relative humidity of 100%).
Iron stress was performed through the
modifica-tion of early reports [6]. Seedlings presenting
uni-form root length were placed in nylon nets fixed on top of plastic pots (2 L), containing modified nutrient
[13]: 40 mg L−1 of (NH
4)2.SO4; 10 mg L−1 of KH2PO4;
40 mg L−1 of KNO
3; 40 mg L−1 CaNO3; 40 mg L−1 of
MgSO4·7H2O; 0.5 mg L−1 of MnSO4·H2O; 0.05 mg L−1
of Na2MoO4·2H2O; 0.58 mg L−1 of NaCl; 0.2 mg L−1
of H3BO3; 0.01 mg L−1 of ZnSO4·7H2O, 0.01 mg L−1 of
CuSO4·5H2O and 2 mg L−1 of FeSO4·7H2O. Seedlings
were kept at 25 °C, 16 h of photoperiod for 28 days, with changing the solution every 7 days.
After this period, the seedlings were subjected to differ-ent treatmdiffer-ents: Control (T1) with standard nutridiffer-ent
solu-tion (2 mg L−1 of FeSO
4·7H2O with pH 4.0 ± 0.1); iron
excess (T2) with modified nutrient solution (2000 mg L−1
of FeSO4.7H2O with pH 4.0 ± 0.1). Seedlings were kept
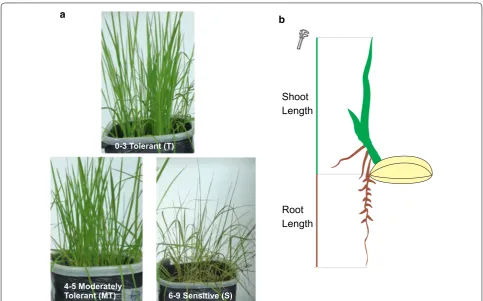
under these conditions for 3 days. The visual evaluations were performed following the standard evaluation sys-tem for rice.
The visual symptoms were based in leaf death and
symptom intensity, compared to control (Fig. 1a). The
grades ranged from 0 to 9. Tolerant (T) plants received grades 0–3, moderately tolerant (MT) 4–5 and the
sensi-tive (S) 6–9 [14]. After the treatment, root (RL) and shoot
(SL) lengths were measured (Fig. 1b). Copper (Cu), zinc
(Zn), manganese (Mn) and iron (Fe) contents
accumu-lated in shoots were also evaluated [15].
A completely randomized design in a double factorial
2 × 5 (treatment × genotype) scheme with three
replica-tions, where the observation unit consisted on 20 plants per genotype. The data was subjected to analysis of vari-ance (ANOVA) and then to Tukey HSD test and a
Pear-son’s correlation, both with p ≤ 0.05. Path analysis was
performed as described [16, 17]. Data from path
analy-sis are not completely shown here, but most important results are described.
Shoot Length
Root Length
0-3 Tolerant (T)
4-5 Moderately
Tolerant (MT) 6-9 Sensitive (S)
a b
[image:2.595.56.540.406.707.2]Visual symptoms observed on plants subjected to iron excess toxicity were yellowing, brown spots along the leaves and leaf tip necrosis. The scores based on genotype performance under excess iron are shown on
Table 1.
Epagri 108 (tolerant in field conditions) barely
pre-sented Fe2+ toxicity symptoms while the genotype
BR-IRGA 409 (sensitive in field conditions) presented easily
identifiable Fe2+ toxicity symptoms under iron excess
conditions (T2). These results agree with field assays
[10]. Nipponbare presented higher scores, being ranked
as sensitive to iron stress, classification in agreement with previous reports obtained in hydroponic systems
[12]. The use of bronzing scores, measured in the field
or in hydroponic systems, has shown to be efficient on the discrimination of tolerant genotypes, being
asso-ciated to grain yield [8, 9, 18]. However, since in early
developmental stages changes in SL, RL and nutrient accumulation in tissues have been reported to consti-tute an objective form of evaluation that can be used in conjunction with bronzing scores, these were also
evaluated during this study [19–21].
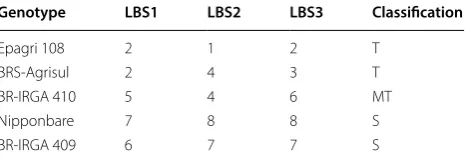
It is shown here that iron excess can lead to
reduc-tion in SL (Fig. 2a) and, as other previous studies
sug-gest, this can be a useful characteristic for helping the
screening of tolerant genotypes [19, 21].
The sensitive genotypes Nipponbare and BR-IRGA 409 indicated higher accumulation of iron in their
tis-sues (Fig. 2b), while BRS-Agrisul and Epagri 108 (both
previously characterized as tolerant) also accumulated iron, but at lower concentrations (i.e., ca. 50% less). It is shown that BR-IRGA 410 display an intermediate phe-notype regarding iron accumulation.
It is also shown that BRS-Agrisul (a medium cycle genotype; 121–130 days) accumulated lower amounts of iron than other medium cycle genotypes such as BR-IRGA 410 and BR-BR-IRGA 409, showing that the time
from germination to grain production is not the cause of differences in the amount of iron accumulated in tissues.
No changes in shoot Cu content can be observed when
comparing treatments (Fig. 2b). On the other hand, an
increase was seen for Zn and Mn (Fig. 2b) when shoots
are subjected to Fe2+ excess (T2). Fe stress at a lower
con-centration than 7 mM increased Zn but decreased Mn
contents in shoots of BR-IRGA 409 [22].
Strong positive correlations were found here for
Fe × Zn (0.93); Fe × Mn (0.97) and Zn × Mn (0.92)
(Table 2), probably due to the Fe-induced activation of
bivalent cation transporters [23].
Iron content is negatively correlated with SL (− 0.37)
and RL (− 0.42), highlighting the impact that excessive
accumulation of this metal has on rice growth and
devel-opment (Table 2). Although similar results are observed
for correlations between Mn and Zn with SL and RL,
these are only significant for RL (Table 2) and, according
to the path analysis (data not shown), it seems to be an indirect effect of iron accumulation.
This quick and easy modification of the protocol
described by [6] proved to be an efficient method to
select tolerant Brazilian lowland rice genotypes for iron
excess tolerance. Plants showing higher Fe2+
accumula-tion in shoots (BR-IRGA 409 and Nipponbare) were the
same identified as sensitive to Fe2+ by the bronzing score.
Besides, the genotype BR-IRGA 409, characterized as sensitive, is the one showing the highest reduction of SL due to iron toxicity. BR-IRGA 410, an intermediate
phe-notype for shoot Fe2+ accumulation, is characterized as
moderately tolerant in symptom score evaluation. BRS-Agrisul and Epagri 108 which are the genotypes
display-ing the lowest Fe2+ accumulation levels in shoots, are
characterized as tolerant in visual symptom evaluation. In Brazil the search for iron tolerant genotypes has been performed for many years. The methods used involve field tests during different years/growing
sea-sons [24]. Even today, this is the most acceptable method,
being necessary to have credibility when registering a cul-tivar. However, for a quick and inexpensive initial selec-tion in breeding programs, efficient protocols to predict
genotype performance have not yet been achieved [25].
Different methods have been tested, these include pot- or tank-based screening procedures that have been
pre-sented over time until very recently [26–28].
It is common for the methods tested to find an ade-quate correlation with the field experiments using soils
of the site of interest [29]. The method presented here is
[image:3.595.58.291.606.686.2]useful for an initial selection of genotypes, without con-sidering the soil, since the removal of this from its place of origin does not guarantee perfect reproducibility of Table 1 Leaf bronzing score (LBS) of five genotypes/
varieties at 3 days in hydroponic culture under iron toxicity condition
The LBS numbers follow a scale from 0 to 9, adapted from standard evaluation system for Rice used by IRRI
Classification regarding iron tolerance levels, T (tolerant 0–3), MT (moderately tolerant 4–5) and S (sensitive 6–9)
Genotype LBS1 LBS2 LBS3 Classification
Epagri 108 2 1 2 T
BRS-Agrisul 2 4 3 T
BR-IRGA 410 5 4 6 MT
Nipponbare 7 8 8 S
the results, either by the modification of the structure or by the lack of local climatic elements. Thus, a prior soil-independent evaluation can be useful to reduce the number of genotypes to be tested and the cost, taking only the most promising ones to field.
Limitations
The limitations of this work are the use of just five gen-otypes. Although they are contrasting for iron response and should be sufficient to explain the responses, it could be considered a limitation.
Control Fe
BRS-Agrisu l
Epagri 108 NipponbareBR-IRGA 41 0
BR-IRGA 40 9
25000.00
-1
Concentration Fe (mg kg
) Genotypes 20000.00 15000.00 10000.00 5000.00 0.00 Control Fe
BRS-Agrisul Epagri 10 8 Nipponbar e BR-I RGA 41 0 BR-IRGA 409 25.00 -1 ) gk g m( uC noi tartn ec no C Genotypes 0.00 20.00 15.00 10.00 5.00 Control Fe BRS-Agrisu l Epagri 10 8 Nipponbar e BR-IRGA 41 0 BR-IRGA 409 250.00 -1
Concentration Zn (mg kg
) Genotypes 0.00 Control Fe BRS-Agrisu l
Epagri 108 Nipponbar e
BR-IRGA 410BR-IRGA 40 9 250.00 -1 gk g m( n M noi tar tn ec no C ) Genotypes 0.00 200.00 150.00 100.00 50.00 50.00 100.00 150.00 200.00 Iron Control Fe BRS-Agrisu l Epagri 10 8 Nipponbar e
BR-IRGA 410 BR-IRGA 40 9 0.00 10.00 20.00 30.00 40.00
Shoot length (cm)
Genotypes
Copper
Zinc Manganese
a
b
Fig. 2 a Shoot length (SL) of each genotype, of the five lowland rice genotypes subjected to standard conditions (control) and to iron excess; b
[image:4.595.58.542.84.578.2]Additional files
Additional file 1: Figure S1. Relative performance obtained by the division of the values of plants under stress by the values of the control treatment. Columns followed by the same letters do not differ significantly (Tukey’s pairwise comparisons, p < 0.05).
Abbreviations
ANOVA: analysis of variance; MT: moderately tolerant; RL: root length; S: sensitive; SL: shoot length; T: tolerant; Tukey HSD: Tukey honest significant difference.
Acknowledgements
Not applicable.
Authors’ contributions
APSB: performed the experiments and wrote the MS; RSS: helped with analy-ses and to write the MS; RCDW: helped with nutrient analyanaly-ses; ROS: suggested modifications in the analysis protocols and corrected manuscript; LCM: sought information on field experiments and corrected manuscript; ACO: conceived the idea and corrected the manuscript. All authors read and approved the final manuscript.
Funding
The financial support was provided by Coordination for the Improvement of Higher Education Personnel (CAPES) (fellowships to graduate students), Research Support Foundation of Rio Grande do Sul (FAPERGS) (fellowships to undergraduates) and The Brazilian National Council for Scientific and Techno-logical Development (CNPq) (grants and fellowships).
Availability of data and materials
The datasets used and/or analysed during the current study are available from the corresponding author on reasonable request.
Ethics and consent to participate
Not applicable.
Consent for publication
Not applicable.
Competing interests
The authors declare that they have no competing interests.
Author details
1 Universidade Federal do Pampa (UNIPAMPA), Itaqui, RS, Brazil. 2 Plant
Genom-ics and Breeding Center, Universidade Federal de Pelotas, Pelotas, RS, Brazil.
3 Department of Soils, Universidade Federal de Pelotas, Pelotas, RS, Brazil.
Received: 25 June 2018 Accepted: 5 June 2019
References
1. Wogu MD, Omoruyi MI, Odeh HO, Guobadia JN. Microbial load in ready-to-eat rice sold in Benin City. J Microbiol Antimicrob. 2011;3:29–33. 2. Santos CE. Brazilian rice yearbook. Santa Cruz do Sul: Editora Gazeta Santa
Cruz; 2015.
3. Santos RS, Krüger MM, Pegoraro C, Madabula FP, et al. Transcriptional regulation of seven ERFs in rice under oxygen depletion and iron over-load stress. Trop Plant Biol. 2013;6:16–25.
4. Finatto T, de Oliveira AC, Chaparro C, da Maia LC, et al. Abiotic stress and genome dynamics: specific genes and transposable elements response to iron excess in rice. Rice. 2015;8:1–13.
5. Santos RS, Araujo Júnior AT, Pegoraro C, Oliveira AC. Dealing with iron metabolism in rice: from breeding for stress tolerance to biofortification. Genet Mol Biol. 2017;40:312–25.
6. Asch F, Becker M, Kpongor DS. A quick and efficient screen for resistance to iron toxicity in lowland rice. J Plant Nutr Soil Sci. 2005;168:764–73. 7. Sahrawat KL. Iron toxicity in wetland rice and the role of other nutrients. J
Plant Nutr. 2004;27:1471–504.
8. Elec V, Quimio CA, Mendoza R, Sajise AGC, et al. Maintaining elevated Fe2+ concentration in solution culture for the development of a rapid and repeatable screening technique for iron toxicity tolerance in rice
(Oryza sativa L.). Plant Soil. 2013;372:253–64.
9. Audebert A, Fofana M. Rice yield gap due to iron toxicity in West Africa. J Agron Crop Sci. 2009;195:66–76.
10. SOSBAI. Sociedade Sul-Brasileira de Arroz Irrigado. Arroz Irrigado: Reco-mendações técnicas da pesquisa para o sul do Brasil. Pelotas: SOSBAI; 2016. p. 197.
11. International Rice Genome Sequencing Project. The map-based sequence of the rice genome. Nature. 2005;436:793–800. 12. Engel K, Asch F, Becker M. Classification of rice genotypes based on
their mechanisms of adaptation to iron toxicity. J Plant Nutr Soil Sci. 2012;175:871–81.
13. Yoshida S. Laboratory manual for physiological studies of rice. 3rd ed. Manila: IRRI; 1976. p. 83.
14. IRRI, International Rice Research Institute. Standard evaluation system for rice. Los Banõs: IRRI; 1975.
15. Tedesco MJ. Análises de Solo, Planta e Outros Materiais. 2nd ed. Porto Alegre: Departamento de Solos, Faculdade de Agronomia; UFRGS; 1995. 16. Wright S. Correlation and causation. J Agric Res. 1921;20:557–85. 17. Li CC. Path analysis: a primer. Pacific Grove: Boxwood Press; 1975. p. 346. 18. Chérif M, Audebert A, Fofana M, Zouzou M. Evaluation of iron toxicity on
lowland irrigated rice in West Africa. Tropicultura. 2009;27:88–92. 19. Crestani M, da Silva JAG, Souza VQ, Hartwig I, et al. Irrigated rice genotype
performance under excess iron stress in hydroponic culture. Crop Breed Appl Biotechnol. 2009;9:85–93.
Table 2 Pearson’s correlation coefficient within and between traits (SL and RL) and micronutrients (iron, copper, zinc and manganese) for five genotypes/varieties under control and iron toxicity conditions in hydroponic culture
* Significant at p ≤ 0.05
Variables Fe Cu Zn Mn SL RL
Fe 1 − 0.19 0.93* 0.97* − 0.37* − 0.42*
Cu 1 − 0.02 − 0.19 0.24 0.26
Zn 1 0.92* − 0.27 − 0.38*
Mn 1 − 0.30 − 0.49*
SL 1 0.08
[image:5.595.59.540.111.206.2]•fast, convenient online submission
•
thorough peer review by experienced researchers in your field
• rapid publication on acceptance
• support for research data, including large and complex data types
•
gold Open Access which fosters wider collaboration and increased citations maximum visibility for your research: over 100M website views per year
•
At BMC, research is always in progress.
Learn more biomedcentral.com/submissions
Ready to submit your research? Choose BMC and benefit from:
20. Quinet M, Vromman D, Clippe A, Bertin P, et al. Combined transcriptomic and physiological approaches reveal strong differences between short- and long-term response of rice (Oryza sativa) to iron toxicity. Plant Cell Environ. 2012;35:1837–59.
21. Onaga G, Egdane J, Edema R, Abdelbagi I. Morphological and genetic diversity analysis of rice accessions (Oryza sativa L) differing in iron toxic-ity tolerance. J Crop Sci Biotechnol. 2013;16:53–62.
22. Müller C, Kuki KN, Pinheiro DT, de Souza LR, et al. Differential physiological responses in rice upon exposure to excess distinct iron forms. Plant Soil. 2015;391:123–38.
23. Palmer C, Guerinot ML. A question of balance: facing the challenges of Cu, Fe and Zn homeostasis. Nat Chem Biol. 2011;5:333–40.
24. EMBRAPA. Anais da I Reunião sobre ferros em solos inundados; 1988. 25. Sikirou M, Saito K, Achigan-Dako EG, Drame KN, Ahanchédé A,
Venu-prasad R. Genetic improvement of iron toxicity tolerance in rice-progress, challenges and prospects in West Africa. Plant Prod Sci. 2015;18:423–34. 26. Abifarin AO. Progress in breeding rice for tolerance to iron toxicity. In:
WARDA, editor. WARDA Annual report for 1990. Bouaké: West Africa Rice Development Association; 1989.
27. Onaga G, Edema R, Asea G. Tolerance of rice germplasm to iron toxicity stress and the relationship between tolerance, Fe2+, P and K content in the leaves and roots. Arch Agron Soil Sci. 2012;59:213–29.
28. Sikirou M. Agro-morphological characterization of lowland rice collection for tolerance to iron toxicity. Abomey-Calavi: Faculty of Agricultural Sci-ences (FSA); 2009.
29. Sikirou M, Saito K, Dramé KN, Saidou A, Dieng I, Ahanchédé A, Venu-prasad R. Soil-based screening for iron toxicity tolerance in rice using pots. Plant Prod Sci. 2016;19(4):489–96.
Publisher’s Note