Rochester Institute of Technology
RIT Scholar Works
Theses
Thesis/Dissertation Collections
9-1-2000
A Study of the effects of strain on NiTi shape
memory alloy
Bret Oltmans
Follow this and additional works at:
http://scholarworks.rit.edu/theses
This Thesis is brought to you for free and open access by the Thesis/Dissertation Collections at RIT Scholar Works. It has been accepted for inclusion
in Theses by an authorized administrator of RIT Scholar Works. For more information, please contact
.
Recommended Citation
A STUDY OF THE EFFECTS OF STRAIN
ON NiTi SHAPE MEMORY ALLOY
by
Bret Allen Oltmans
A Thesis Submitted in
Partial Fulfillment of the
Requirement for the
MASTER OF SCIENCE
IN
MECHANICAL ENGINEERING
Approved by:
Dr. Surendra K. Gupta
Department of Mechanical Engineering
Dr. Hany Ghoneim
Department of Mechanical Engineering
Dr. Andreas Langner
Department of Chemistry
Dr. Satish G. Kandlikar
Department Head of Mechanical Engineering
(Thesis advisor)
DEPARTMENT OF MECHANICAL ENGINEERING
ROCHESTER INSTITUTE OF TECHNOLOGY
Thesis Reproduction Permission Statement
A
Study of the Effects of Strain on NiTi Shape Memory Alloy
I, Bret Oltmans, hereby grant permission to the Wallace Library of the Rochester
Institute of Technology to reproduce my thesis
in whole or in part. Any reproduction
will
not be for commercial use or profit.
Date:
/
Dh
>/zt7l:Jb
Abstract
Shape
memory
alloys are materialsthatare capable ofreturning
toanoriginalshape after
large deformations
in
responsetoastimulus.Shape memory
alloys canbe
metals, ceramics,polymers and gels.
This
thesisstudiesthechanges of various propertiesof
NiTi
metal as samples are prestrained variousamounts.After conducting
variouscharacterization
techniques,
relationshipsweredeveloped for
thechangesin
transformation
temperatures,
Knoop
hardness
number, andcrystallattice
parameters.Through
theuse ofdifferential scanning calorimetry
anddynamic
mechanicalanalysisthe transformation temperatureswere
determined. It
wasobservedin
both
experimentsthatthe
initial
austenite starttemperature(As)
increased parabolically
whileaustenite
finish
temperature(Af)increased
linearly
withprestrain.Also,
DSC
showedthatMartensite
starttemperature(Ms)
increased
linearly
withprestrain,however,
DMA
did
not show
any
trendfor Ms.
Knoop
hardness
testsas well asdeformation
testswere performedtoinvestigate
changes
in
themechanical propertiesofNiTi
withincreased
prestrain.It
wasfound
thatthe
Knoop
hardness
numberincreased
linearly
withincreased
prestrain.Additionally,
from
tensiledata
collectedduring
thedeformation
testing,
it
wasfound
that themaximumflow
stressat each strain amountfollows
a parabolictrend.Also
from
thestress-straindata,
it
wasfound
thatNiTi
has
ahigher
strainhardening
coefficientthanmost materials.When
Knoop
hardness
numbers were comparedto the true stressvalues,it
wasfound
thatthe
hardness
numberincreased
following
a cubictrendwithincreasing
stress.Using X-Ray
diffracton,
thecrystalstructureoftheNiTi
wasfound
tobe
monoclinic with
lattice
parameters,a=2.884,
b
=4.637,
c =4.101,
y
=97.7.
It
wasalsoobservedthat the volumeoftheunitcellremainedconstant regardlessofprestrain.
Using
an opticalmicroscope,large
grainswithstripesperpendicularto theprestrain
direction
were observed.The
occurrenceand sizeofthesegrainsincreased
withtheamount of prestrain.
Surface
scansusing
atomicforce microscopy
showedthatthesestripes were all
approximately
thesamedepth
andregularly
spaced.These
grainsappearedto
be
self-accommodated martensite regionsbut
could notbe
fully
characterizedAcknowledgements
First I
wouldlike
tosay
ahuge
thankyoutomy
family
andfriends for
supportingmethrough theups and
downs
ofmy
research.I
also oweadebt
ofgratitudetoDr.
Gupta for serving
asmy
thesisadvisor.Without his
extensiveknowledge
and experiencein
thematerials sciencefield,
this thesiswouldnot
have
been
possible.I
would alsolike
to thankhim
for
encouraging
metoparticipate
in
theUndergraduate Materials Research Initiative
sponsoredby
theMaterials
Research
Society
in
whichI
wasawardedanhonorable
mentionfor
aninitial
proposalofmy
research.I
would alsolike
to thankDr. Langner for
letting
meusehis lab
equipment andfor
spending many hours
teaching
mehow
to useDSC
andDMA.
Also,
both Dr. Langner
andDr. Ghoneim
deserve
ahuge
thankyoufor
taking
Table
ofContents
Title Page i
Thesis Reproduction Permission Statement ii
Acknowledgements v
TableofContents vi
IndexofFigures vii
ListofTables viii
ListofTerms&Symbols ix
Introduction 1
Shape
Memory
Effect 2Crystallography
oftheShapeMemory
Effect 4Mechanical PropertiesofNiTi 9
OtherCharacteristicsofNiTi 15
Experimental Plan 17
Materials 17
Specimen Preparation 17
Differential
Scanning Calorimetry
20Dynamic MechanicalAnalysis 22
X-ray
Diffraction 26Hardness
Testing
29Optical
Microscopy
32Atomic Force
Microscopy
33Data/Processing
Method 34DeterminationofModulusof
Elasticity
34DeterminationofTransformation Temps 35
Differential
Scanning
Calorimetry
35Dynamic Mechanical Analysis 37
Hardness 39
Strain
Hardening
Exponent 39Results/Discussion 41
Differential
Scanning Calorimetry
41Dynamic MechanicalAnalysis 46
Hardness
Testing
50Mechanical
Testing
52X-Ray
Diffraction 58Optical
Microscopy
60AtomicForce
Microscopy
62VerificationofDeveloped Correlations 64
Conclusions 75
Appendicies 78
Appendix A 78
Appendix B 80
AppendixC 83
AppendixD 88
AppendixE 89
Index
ofFigures
Figure 1 Shape
Memory
Process 3Figure2 Diagramof phases asNiTiis heatedand cooled 4
Figure 3 Lattice Parametersof aCrystal System 5
Figure4 Crystal StrucureofB19'NiTi 6
Figure5 Exampleof aTwin
Boundary
8Figure6
Twinning during heating
andcooling 8Figure7 Exampleof self-accommodation 9
Figure8 SpecimeninTension 1 1
Figure9 Stress-Strain Curve for NiTi 13
Figure 10 Tension Apparatus
Setup
18Figure 1 1
Polishing
Disk Dimensions 19Figure 12 Typical DSC ScanofNiTi 20
Figure 13 Three DSC Cycles 21
Figure 14 Elastic Response
Analogy
23Figure 15 Dynamic Responseof aMaterial 24
Figure 16 Three-point
Bending
Apparatus 25Figure 17 DiffractionofX-Rays
by
a crystal 27Figure 18
Knoop
Indentor 30Figure 19
Knoop
Indentation in NiTiSurface 30Figure 20 DeterminationofTransformation Temperatures from DSC 37
Figure 21 DeterminationofTransformation TemperaturesfromDMA 38
Figure 22 ExampleofShiftof
As
andAf
42Figure 23 TrendofInitial
As
Temperatures 43Figure 24 Absenceof peaks wheninitial
As
andAf
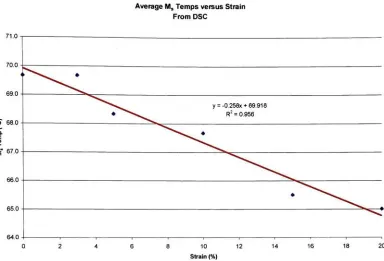
not surpassed 44Figure 25 Average
Ms
temperaturesas afunctionof prestrain 45Figure 26
Af
Temperatureas afunctionof prestrain 46Figure 27 Initial
As
as afunctionof prestrain(fromDMA)
47Figure 28 Average
Ms
temperatureas afunctionof prestrain(fromDMA)
48 Figure 29 InitialAf
temperaturesas afunctionof prestrain(fromDMA)
49Figure 30 KHNas afunctionofPrestrain 52
Figure 31 Max True StressvsTrue Strain 53
Figure32
Knoop
Hardness NumberVs True Stress 54Figure 33 Powercurvefittoplasticdeformationregionof15%sample 56 Figure 34 Powercurvefittoplastic region of20%sample 56 Figure35 Brightfield ImageofStriped Grain at500X 61
Figure 36 Brightfield ImageofStripedGrain at 1000X 61
Figure 37 2-Dimensional AFM Image 62
Figure 38 3-Dimensional AFM Image 63
Figure39 Section ViewofAFM Image 63
Figure 40 Initial
As
as afunctionof prestrainfrom DSC 65Figure41 DMA
Heating
Curves for 17% Sample 66Figure 42 Initial
As
from DMA 67Figure 43 Average Ms from DSC 68
Figure44 Average
Ms
temperaturesfromDMA 68Figure 45 Initial
Af
TemperaturefromDSC 69Figure46 Initial
Af
TemperaturefromDMA 70Figure47 Powercurvefor 17%sample 72
Figure 48 Maximumtruestress values 73
Figure 49 KHNasafunctionof prestrain 74
Figure 50 KHNasafunctionoftruestress 75
List
ofTables
Table 1. Specimen Lengths 18
Table2 Transformation Temperatures fromDSCin C 41
Table3 Initial Austenitic Transformation Temperatures 42
Table4 Final KHNValues 51
Table5 Modulusof
Elasticity
ValuesFound From TensileTesting
54Table 6 Strain
Hardening
Exponents forvarious materials 57Table7 Springbackvalues uponunloading 58
Table8 Monoclinic Lattice Parameters 58
Table9 Transformationtemperaturesfor17%samplefromDSC 70
Table 10 Transformationtemperatures for17%samplefromDMA 70 Table1 1 Modulusof
Elasticity
determined fromtensiledata for 17%sample 71Table12 Strain
hardening
exponent 71List
ofTerms
&
Symbols
A
Instantaneous
Area
oftheSpecimen
Ao
Original Area
oftheSpecimen
Af
Austenite Finish Temperature
AFM
Atomic Force
Microscopy
As
Austenite
Start Temperature
Av
Area
oftheSpecimen
atYield Point
D
Interplanar
Spacing
5
Change in Specimen Length
DMA
Dynamic Mechanical Analysis
DSC
Differential
Scanning Calorimetry
E*
Complex Modulus
E,E'
Modulus
ofElasticity
(Young's
Modulus)
E"Imaginary
Loss Modulus
Save
Average Strain
et
True
Strain
KHN
Knoop
Hardness Number
L
Instantaneous Length
oftheSpecimen
Lo
Original Length
oftheSpecimen
Lf
Final Length
oftheSpecimen
Lv
Length
oftheSpecimen
atYield Point
Mf
Martensite Finish Temperature
Ms
Martensite
Start Temperature
v
Poisson's Ratio
SE
Superelasticity
SMA
Shape
Memory
Alloy
SME
Shape
Memory
Effect
^eng
Engineering
Tensile Stress
0"trae
True Tensile
Stress
t
Instantaneous Thickness
oftheSpecimen
to
Original Thickness
oftheSpecimen
e
Bragg
Angle
w
Instantaneous
width oftheSpecimen
w0
Original
width oftheSpecimen
XRD
X-ray
Diffraction
Introduction
Shape
Memory
Alloys
(SMA)
arevery
interesting
alloysthathave become
apartof
everyday
life
for
many
peoplewithoutthemevenknowing
it. Shape memory
alloysgettheirname
because
oftheiruniqueability
to"remember"theiroriginal shape even afterthealloy is apparently plastically deformed. The
shapethataSMA
remembersis
determined
by
the user, andit
canbe easily
changedwith properheat
treatment.Depending
onthecertain characteristicsofthe alloy,it
can recoverthedeformation
onceit is heated
above acertaintemperature or,it
willautomatically
returntoits
originalshape oncethestress
is
removed.In
thecaseof
thematerialusedinthis study, thealloy
remembers
its
original shape afterit isheated
above a certain temperature.The
first
recorded
incident
of amaterialexhibiting
shapememory
characteristicswasin
1951,
andthematerialwasan
Au-Cd
alloy.Later
in 1963
attheNaval
Ordinance
Laboratory
(NOL),
theshapememory
phenomenon was observedin
anequiatomicNiTi
alloy, andthe
alloy
wasgiventheacronymNiTi-NOL
orNitinol1.
Since its
discovery
in
1963,
NiTi
has beeen
usedin many different
applicationssuch aspipecouplings, antennas, actuators,and
they
arealsobeing
usedextensively in
themedical anddental fields.
The
shapememory
phenomenon occursbecause
of acrystallographically
reversible martensitic phasetransformation.
The
transformationis
difiusionless,
wheretheatoms shift small
distances from
an orderedhigh
temperaturephase(austenite)
to alower energy
phase(martensite). Another
interesting
characteristic ofNiTi
is
superelasticity
(SE). In
SE,
large
stressinduced
deformations
are recovered whentheThe
shapememory
phenomenon andsuperelasticity
willbe
discussed
atagreaterlength
in
thesubsequentpages.The
goal ofthisresearchis
tostudy
thechangesofvarious properties of shapememory NiTi
when specimens are prestraineddifferent
amounts.The
propertiesthatwillbe investigated
arehardness,
transformationtemperatures,
modulus ofelasticity, andmicrostructure.
Different
characterizationtechniqueswillbe
usedtorecordthechangesin
theseproperties asthepre-strain amountis
varied.Shape
Memory
Effect
The
mechanismbehind SME is
ashear-likedeformation
where adifiusionless
phasetransformationoccurs.
This
transformationis
acrystallographically
reversiblemartensitictransformation.
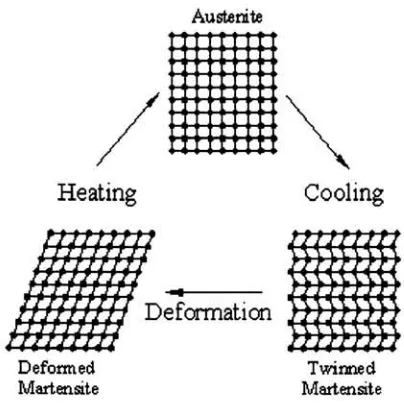
Figure 1
is
asimple schematicshowing
the shapememory
process
from
amicroscopic point of view.Depending
onthetemperature,
theSMA
caneither
be
austenite ormartensite, thelatter
being
thelow energy
(temperature)
phase.Assuming
theSMA is
atatemperaturebelow
themartensitetransformationfinish
temperature
(Mf)
temperatureandundeformed,theSMA
willbe in
the twinnedAustenite
i
?
Heating
Cooling
Deformed Martensite
[image:13.514.158.360.46.250.2]Twinned Martensite
Figure 1 Shape
Memory
Process1In
twinned martensite, theremay
be
many
regions of martensitethathave
thesame structure
but
areorienteddifferently,
andtheseare calledcorrespondencevariants.When
astressis
appliedto the twinned martensite,it deforms
by
themovement oftwinboundaries. As
thestressis
increased,
the variantsbegin
toorientthemselvesinto
apreferredorientationthatpermitsthe
largest
deformation.3In
thecase ofa single crystalas
in Figure 1
, onesingle variantcanbe
produced as shownby
thedeformed
martensitestage.
If
theSMA
is
thenheated,
reversetransformationwilltakeplace andthemartensitewilltransform
into
theparentaustenite.1"3
Ifthe
SMA
is
thencooledagain,self-accommodatingmartensite will
be
formed,
andtheSMA
willbe in
thesame state asthe
beginning
ofthedescription
ofthe shapememory
process.If
theunstrainedself-accommodatedmartensite
is
heated,
it
will still revertto theparent austenite eventhoughno deformationtakesplace.
It
is
thereversetransformationfrom
thedeformed
martensiteSomething
not mentionedin
theprevious exampleis
that thesetransformationsstart and end at certaintemperatures.
The
transformationfrom
parent austenitetomartensite
begins
attheMs
temperatureandis
completed attheMf
temperature.The
transformationfrom
martensitetoaustenitebegins
atAs
andfinishes
atAf. Figure 2
graphically
portraysthephasethatNiTi
is in
asit is
heated
andcooled.It
is
important
tonoticethatwhenthe temperatureof
NiTi
falls between
eitherMs
andMf
orAs
andAf,
both
phases arepresent.B19'
-i
BlS'frP3
Completely
AusteaitePhases
During Cooling
B2
B19' B19'
Completely Martensite
BI9'
B19'&B2
12
Mf
M,
Phases
During Heating
Af
Figure 2 Diagramof phases asNiTiis heatedand cooled
Another important
thing
tonoticeis
thatthereis
ahysteresis
associatedwiththephasetransformations.
This
meansthattheforward
andreversetransformation temperaturesaredifferent.
Typically
NiTi
has
a20
-40C
hysteresis,
but
it
is extremely
alloy dependent.
Crystallography
ofthe
Shape
Memory
Effect
The
shapememory
effect occursbecause
aSMA
undergoes acrystallographically
different
phasesthatit
canbe in.
In
its
high-temperature
form,
NiTi
is in
its
parentaustinitic state which
has
aCsCl
body
centered cubic(BCC)
crystal structure whichis
denoted
by
B2.
The B2 CsCl
crystalhas
sidelengths
where a=b
=c=
0.301
-0.302nm
anda=
(5
=y
=90.3See Figure 3 for
thesideand angledesignations.
Figure 3 Lattice Parametersof aCrystalSystem4
In
its low
temperaturestate,NiTi
is
in
alow energy
martensiticphase whichhas
amonoclinic structure which
is denoted
by
B19'
with
lattice
parameters a*b
*c,anda=
y
= 90*
p. For
amonoclinic crystal, thelattice
parametersreportedby
Sinclair
et alwere,a=
0.2885
nm,
b
=0.4622
nm,c =0.4120
nm, and
y
=96.80.5As
mentionedpreviously, theshapememory
effect andsuperelasticity
depend
heavily
onamartensitictransformation(MT). In
MT,
theatomsmovecooperatively,often
by
ashear-like mechanism.The
martensitictransformationbegins from
theorderedparent austenite phase andendswiththe
lower symmetry
monoclinic phase.Previously
it
wasmentionedthat
low
temperaturemartensitemay
consist ofmany
regions withtheparent phase.
It
has
alsobeen
proventhatMT
is
alinear
transformation.To
seethis,
onecan gothroughallthe
linear
algebrabehind
MT2,
orone cantakeasingle crystalSMA
and scratch a straight
line in
thesurface andallowit
to cool.Upon
cooling, theline
willchange
direction
andremainstraight.Since
aline
anda surfacebecome
adifferent
line
andsurface,
it
demonstrates
thatashape changeassociated withMT
is
linear.
In
termsofcrystallography, each(110)
planeoftheparentphasedeforms nearly
to a
hexagonal
network and shiftsin
the[1 1
0]
direction
by
ashearresultingin
astacking
arrangement as shown
in Figure 4.
IstUyer
\0
\0Nl
[100]
O
L
o
\
O
0th Layer \?68'
[001]
Figure 4 CrystalStrucureofB19*NiTi6
It
waspreviously
mentionedthatduring
thephasetransformationfrom
theparentaustenite phasetothemartensite phasethatself-accommodation occurs.
Self-accommodation
is
theability
ofthemicrostructuretochange phases withoutchanging
shape.
In
aself-accommodatingmicrostructure, thereis
a coherent arrangement ofmartensite variantsoccupyingaregion whose
boundary
suffersnodisplacement
with [image:16.514.174.348.261.466.2]materials
because
it
aidsin
making
thetransformationtomartensite reversible orthermoelastic.
Since
most shapememory
materialsin
usearepolycrystalline,self-accommodation
greatly
facilitates
thereversibility
ofphasetransformations.In
apolycrystalline
SMA
thereare alarge
number ofrandomly
oriented grains.Since
thesegrains areall
randomly
oriented,any
changein
shape woulddevelop
internal
stressesorpossibly
cracksbecause
ofthemismatchofthegrainboundaries. Since internal
stresseswouldoppose the
reversibility
ofthephasetransformation,
thematerial accommodatesthese
differences
whichis
known
as"self-accommodation". Because
oftheaccommodationphenomenon,
it
wouldbe
possibletoput aself-accommodating
microstructurewithinaustenitewithout
introducing
macroscopicstresses.Similarly,
for
thesamereason, martensite cannucleate withinaustenite
during
cooling in
a stress-freemanner,whicheasesthe transition
from
austenitetomartensite.A
key
part of self-accommodationthatallowsthematerialtochangeshapeis
"twinning."
Generally,
thereareonly
twomechanismsby
which amaterialdeforms: slip
andtwinning.
Slip
is
a permanent processandis
commonin many
martensites.Obviously
sinceslip is
apermanent phenomenonwhereastheshapememory
effectis
reversible,
it
is
clearthatNiTi
undergoestwinning
toaccommodatethenew structureupontransformation.
Twin
boundaries
are planesacross whichthereis
a mirrorimage
misorientation ofthe
lattice
structure4.A
schematic of atwinboundary
canbe
seenin
Figure 5. Atoms
thatarealong
the twinboundary
seethesamenumber andtypesofTwin
Boundary
Figure 5 Exampleof aTwin
Boundary
Twin Boundaries
are capable ofinterfering
withtheslip
process andincrease
thestrengthofthematerial.
Another
key
property
oftwinboundary
is
thatthey
areof avery low
activation
energy
and arequitemobile.The energy is low because
theatomsthatarealong
theboundary
arebonded very similarly
to those that arenotalong
theboundary.
This
bonding
causestheboundaries
tobe very
mobile.In
mostmaterials,themovementoftwin
boundaries
can causethematerialtodeform,
but in
SMA,
twinning
allowsthematerialtochange phases without
changing
thevolume orcausing any internal
stresses.One
ofthereasonsthatNiTi
does
not undergoslip
to accommodatemartensiteis because
slip
requires atomicbonds
tobe
broken,
andtwinning
allowsall atomicbonds
to remainintact.
Above
Af
%&
m
ParentPhase
Un-de formed
Below
Mf
Deformation
Above
Af
iXXXM)
Parent
Phase
Figure6
Twinning during heating
andFigure
6
shows a microscopic explanationoftwinning
throughaheating-cooling-heating
cycle.
From
theleft,
thematerial startsin
theordered parentstatethenis
cooledandself-accommodatedmartensite
is formed.
Upon
deformation,
thetwinboundaries easily
move and converttoa
different
orientationthatbetter
accommodatesthestress.When
thematerial
is
thenheated
aboveAf,
it
returnsto theorderedparent austenite phase.Figure 7
demonstrates
thisphenomenonin Cu-Al-Ni. As
onecan seefrom
thisfigure,
thetwin
boundaries
move and converttoadifferent
preferred orientationaccording
to theapplied stress.
This
processofcondensing many
twinvariantsinto
a singlefavored
variant
is
calleddetwinning.
'Figure 7 Exampleof
self-accommodation2
The
occurrence ofself-accommodatingmartensite anddeformation
twinning
in SMA
leads
tointeresting
mechanical properties.Mechanical Properties
ofNiTi
strain andtruestrain.
Engineering
strainis defined
astheratio ofthechangein length
totheoriginal
length.
"
ave
j j
x '
A)
A)
True
strain, whichis
theinstantaneous
changein linear dimension divided
by
theinstantaneous
value ofthedimension,
is
extremely
usefitl whendealing
with plasticdeformation8.
L'rdL
,Lf
<=)T=t
(2)
Another
conceptthatis
key
tostudying
mechanicsis
stress.Again
there aretwotypes,
engineering
stress andtrue stress.Engineering
stressis
theload divided
by
thecross-sectionalarea oftheunloaded material.
True
stressis
theload divided
by
theinstantaneous
cross-sectional area.P
<7=T
(3)
p
otrue =(
4)
A
Given
thepreviousdefinitions,
thetensileproperties ofa materialcanbe
studied.When
an axialtensileload is
appliedto ametal, themetalgoesthroughseveral stagesofdeformation.
During
thefirst
stageofdeformation,
thespecimen exhibits elasticbehavior. This
meansthatthespecimen willrecoverits
originaldimensions
whentheload is
removed.This recovery
should notbe
confusedwiththeshaperecovery
processor superelasticityof
NiTi.
Elastic recovery in
most metals occursatfractions
of a percentstrain, whilesuperelastic
NiTi
is
capable ofrecovering up
toapproximately 8%
strainuponunloading. '
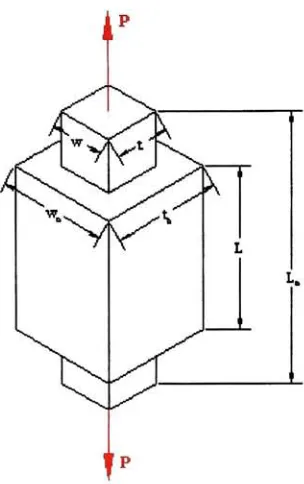
Figure 8 Specimen in Tension
When
mostmaterialsaredeformed
elastically, theresulting
stressis
proportionaltothestrain and
is
governedby
Hooke's Law.
(j=
Es
(5)
Also in
theelasticregion, thecontractionin
they
and z-directions(Figure
8)
is
directly
proportionalto theelongation
in
thex-directions.sx
-vsy
=-ve,(
6)
Using
thepreviousequation, expressionsfor
theinstantaneous
length,
width,andthicknesscan
be developed.
L
=L0(\+sx)
(7)
w=
w0(l-vsx)
(8)
t=
tQ(l-Vx)
(9)
Since
anengineeringstress-straincurvedoes
notcompletely
depict
thetrue stress
from
equations(2)
and(4). For
truestresstheinstantaneous
areais
needed,and
it is found
by
multiplying
theinstantaneous
widthandthickness.A
=w0t0{\-vexf
(10)
Using
this equation, thefinal
equationfor
truestressis,
^=7~y
(11)
This
elasticbehavior
continuesuntiltheload
reachestheelasticlimit. When
theelastic
limit is
exceeded, thesecond stageis
encountered whereyielding
occurs,whichmeansthematerialwill notreturnto
its
originaldimensions
whentheload
is
completelyremoved.
This is
called plasticdeformation. In
thisstage ofdeformation,
thematerialdeforms
uniformly.Although
thedeformation
is
uniform, the strainis
nolonger
directly
proportionalto the stress, so equation
10
nolonger correctly describes
theinstantaneous
area.
A better
representation oftheareacomesfrom
the assumptionthat thevolumeofthespecimenremainsconstantafteryieldingoccurs.
This
assumptionallowsanexpression
for instantaneous
areatobe
written,Vv
=V
=Constant
LyAy=LA
where
Vy, Ly,
andAy
arethe volume,length
and areaattheelasticlimit.
Solving
for
instantaneous
area(A),
A
=Ay-f
(12)
With
anewexpressionfor
area, thenew equationfor
true stressin
the uniform plasticregion
is,
Gtrae
=PL
Ay
Ly
(13)
Once
thematerial reachesits
ultimatestrength, thedeformation becomes
unstableand
necking
occurs, andthisis
the third stage ofdeformation.
Necking
is
alocalized
deformation
wheretheincrease
in
stressis
due
to adecrease
in
thecross-sectionalarea,andthe
deformation
is
nolonger
uniform.In
this study, thespecimensnever enteredthenecking
regionsothisstage will notbe discussed
atlength.
In
NiTi,
thestress-straindiagram looks
quite abit different
thanastandardstress-straincurvethatone would see
for
atypicalductile
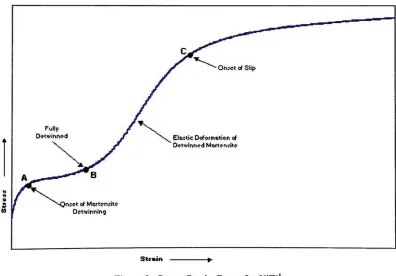
material.Martensitic NiTi
exhibitsthestress-strain characteristicsthatare shown
in Figure 9. As
one cansee, thematerialappearsto
initially
deform
like
a standardductile
material,untilpointA.
According
toLiu
etal, thisdeformation
is
due
to theelasticaccommodationoftwinbands.11Elastic Deformation cf
Detwinned Martensite
JnselofMartensite Detwinning
Strain
[image:23.514.66.462.353.629.2]1112
At
pointA,
the twinnedmartensiteundergoes martensite variantreorientation 'untilthemartensite
is
fully
detwinned (point B). After
themartensitehas become
fully
detwinned,
it
exhibits asecondary
elasticdeformation.
During
this stage,it
is
thedetwinned
martensitethatdeforms
elastically1.At
pointC,
slip begins
andthedeformation is
nolonger completely
reversible uponunloading
orwhenheated
aboveAf.
Point C falls
atabouteight percentfor
thematerial usedin
thisstudy
whichis
consistentwiththe
generally
acceptedvaluefor
maximumrecoverable strainin NiTi.
Other Characteristics
ofNiTi
NiTi
alsohas
severalotherimportant
characteristicsthatarenot exploredin
thisresearch.
One
ofthesecharacteristicsis
calledsuperelasticity(SE).
Superelasticity
occurs when a material recovers
from
large
deformations
upontheremoval ofthestress.Essentially
SE is
thesameas shapememory
effect,but
noheating
is
requiredto recoverthe originalshape.
In NiTi SE
occurswhenthematerialis in its
parentaustenitic state.The
parent state canbe
achievedby heating
abovetheAf,
orit
can occur attemperaturesbelow
roomtemperaturedepending
onthe atomiccomposition.SE
occursbecause
ofstress
induced
martensitewhich revertsback into
theparent austenite phase whenthestress
is
removed.Essentially,
thestress actsthesameastemperaturedoes for
SME,
where a
decrease in
temperatureis
equivalenttoanincrease
in
stress.'As
withSME,
onepreferred martensite variant will
form
asthematerialis deformed.
Another
interesting
characteristic ofSMA is
whatis known
astwo-way
memory
effect.
As
one might guessfrom
thename, atwo-way
SMA
is
capable ofremembering
two
different
shapes.The
shapesthatareremembered aretheparentausteniteshape, asin
standardone-way
memory, andtheotheris
thedeformed
martensite shape.When
thealloy
is
aboveAf,
it
takes theshapeoftheparentaustenite,thenwhenit is
cooledbelow
Mf,
it
takestheshapeofthedeformed
martensite.Special
thermomechanical treatmentsarerequiredto producethiseffect.
This
training
introduces
microstressesthattendtobias
thenucleationandgrowth ofmartensite,andthesemicrostresses causethematerialtotransform
from
parent austenitedirectly
into deformed
martensite.1
The last
characteristicthatwillbe
mentionedin
thissectionis
theintermediate
lengths because
thisphasedid
not occurin
thealloy
studied.This intermediate
phaseis
calledthe
R-phase because it has
arhombohedral crystal structure.To determine
if
theR-phase
occursduring
thecooling
ofNiTi,
aDSC cooling
scancouldbe
takenwherethealloy is
cooledfrom
aboveAf
tobelow Mf. If
two exothermicpeaks appearonthe scan,there
is
evidencethat theR-phase
has
occurred.The R-phase
producesamuch smallerpeakthanthemartensitic
transformation,
andit
occurs at ahigher
temperature.The
typical
hysteresis
oftheR-phase is only
a couple ofdegrees Celsius. As
notedbefore,
thematerial used
in
thisresearchdoes
not transitionthroughtheR-Phase because
thereis
noadditionalpeakevidentonthe
DSC cooling
curve.Also,
theR-Phase
is
usuallynotevident
in Titanium
richNiTi
alloys.Experimental
Plan
Materials
The
materialusedfor
thisresearchwasalloy BH from
Memry
Corporation in
theform
of0.432mm
x1 1.379mm
ribbon.According
toMemry,
thecomposition ofthealloy
was54.5
wt% Ni
andit
was coldrolled.From
theweight percentage, theatomicpercentage of nickelwas
determined
tobe 49.4
at% Ni.
Specimen Preparation
Six
sampleswerecutfrom
theas receivedribbonusingasmallshear.The
sampleswere
approximately 125mm
long by
1 1mm
wide.Since
theribbon receivedfrom
Memry
Corporation
wasin
acold-workedstate,it
wasnecessary
to anneal allsamples at
850C
for 30
minutes.Before
thespecimenswere placedin
thefurnace,
allgreaseand
dirt
was removedby
wiping
themwith methanol.To
minimizeoxidation, thesamples were placed
between
aluminaplates and a steel weightwas placedontop
oftheplates.
Following
theannealing
treatment,
thespecimens werequenchedin
water atroomtemperature.
A
secondheat
treating
process was neededto "teach"thespecimens ashape andto givethemtheshape
memory
ability.At
thisstep
thesampleswerecleanedagainwith methanolandplaced
between
thealumina plates.They
werethenplacedin
the
furnace
at350C for 30
minutes and allowedto aircool.Once
thespecimenshad
air-cooled,they
were prestrainedusing
aInstron
Universal
testing
machine whilethestrain was measured withanMTS
extensometer.Figure 10
showstheconfiguration ofthesample and extensometerin
thetesting
machine.specimenswere strained with a crosshead speed of
1.25
mm/min, andthestrainwas also
released at
1.25
mm/min.Load
and extensiondata
wererecordedusing Testworks
in
English
units and convertedtoSI
units afterthedata
was exportedinto
anExcel
spreadsheet.
After
each specimen receivedtheproper strainamount,they
wereseparatedand
labeled
withMEM850XX,
wheretheXX
standsfor
theamount ofprestrainthespecimen received.
After
thespecimenshad been
prestrained,they
werecutinto
sectionsfor
eachexperiment.
Table 1 lists
therequiredlengths
for
each experiment.NiTi
Specimen
Instron
Crips
MTS
Extensometer
Figure 10 Tension Apparatus
Setup
Table 1. SpecimenLengths
Experiment
Length
ofSpecimen
Dynamic Mechanical Analysis
50
mmX-Ray
Diffraction
15
mmMicrohardness
13
mmOptical
Microscopy
13
mmDifferential
Scanning
Calorimetry
5
mmSamples
for
X-Ray
Diffraction,
hardness
testing
andopticalmicroscopyhad
tobe
mechanically
polishedbefore
analysis.To
polishthe samples,sampleholders had
tobe
fabricated.
The
holders
consistedofa32mm Bakelite
disk
with a0.650mm
deep
groovemilled
in
one oftheflat
surfaces(Figure 11). The
othersurface wasusefor
sampleidentification.
10.0
|M
0.64
Figure 11
Polishing
Disk DimensionsEach
specimen was gluedinto
thegroovewith adrop
of superglue.The
mechanicalpolishing
wasdone using
aRotopol-1
1,
RotoForcel
andMultidoser
all purchasedfrom
Struers. For
microhardnesstesting
and opticalmicroscopy, the sampleswereleft
attachedto the
Bakelite
disk,
whilethe x-raysample was removedwith adrop
ofacetoneandthenmounted on aglass slideusing
double-sided
cleartape.The DMA
samplewaswet sanded on
#220
grit sandpapertoremoveany
oxidethatresultedfrom
theheat
treatmentprocess.
An
8-10 mg
sample wascutfrom
eachDSC 5mm
pieceusing
a shearDifferential
Scanning
Calorimetry
Differential scanning calorimetry
(DSC)
is
usedtofind
thermochemicalandthermophysical
characteristicsof a substance.The DSC
measuresheat flow into
(endothermic)
or out(exothermic)
of a material asit
is
heated
at adefined
rate.If
thematerial undergoes a phase
transformation,
therewillbe
a changein
theheat
flow
depending
onthe typeoftransformation.
Since it
is
wellknown
thatSMA
experience aphase
change, DSC
is
an excellent choicefor monitoring
theheat flow
of a specimen asit
transforms
into
either austenite or martensiteoreven adifferent
phase.Another
reasonthat
DSC is
excellentfor characterizing
the transformation temperaturesis
that thesample remains unstressedthroughout theentireexperiment, and
it has been
shownthatstress
has
alarge
effectonthe transformation temperatures. 913A
typicalchart ofheat
flow
versustemperaturecanbe
found
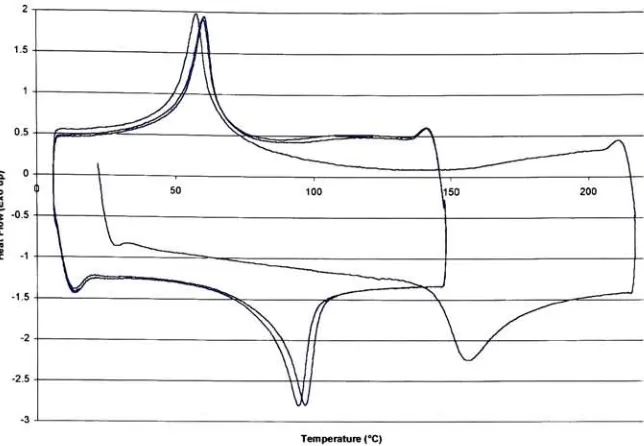
in Figure 12
Temperature(C)
Figure12 Typical DSCScanofNiTi
[image:30.514.96.430.382.615.2]From
thisscanit is
important
tonoticethat thereis
only
oneexothermic peakandoneendothermicpeakevident
in
theheating/cooling
cycles.This
provesthatthisalloy
does
nottransformfrom
austeniteto theintermediate
R-phase before
transforming
into
martensite.
In
this study,samples of8-10
mg
were cutfrom
theprestrainedspecimensandanalyzed
in
aTA
Instruments DSC 2010
differential scanning
calorimeter.After
thespecimens were cut,
they
were cleaned withmethanoland sealedin
aluminum specimenpans.
Prior
tostarting
theheating
andcooling
cycles,a specimen wasplacedinside
thecalorimeter aswellas an
empty
specimenpan,whichserved asthereferencematerial.For
thefirst
cycle, theinitial
transformation temperatureswere estimated andtheDSC
was setto
heat
30-50C beyond
thoseestimates andcoolto10C
atarateof10C
perminute.
For
thesecond andthird cycles, the specimenwasheated
to 150 and cooledto10C
at a rateof10C
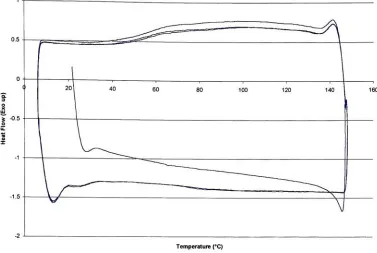
per minute.An
exampleofthe threeheating/cooling
cycles canbe
seen
in Figure 13. All
heating
andcooling
wasdone
undera constantflow
of nitrogenat50ml/min.
Temperature (C)
Dynamic Mechanical
Analysis
Dynamic
mechanical analysis(DMA)
is
avery
usefultoolfor characterizing
various materials.
DMA is
identified
by
various names suchas,forced
oscillatory
measurements,
dynamic
mechanicalthermalanalysis(DMTA),
dynamic
thermomechanical analysis,and
dynamic
rheology.Lately,
DMA has been
usedextensively
on polymerstodetermine different
propertiessuchas glasstransitiontemperatures,
elasticity
and resistanceto creep.Glass
transition temperaturescould alsobe
measuredusing
differential
scanning calorimetry
(DSC),
but in
some materialsthetransition temperaturesaretoo
faint
tobe
detected
by
DSC. DMA
is
muchmoresensitive so
it is
abletodetect
the slightest changesin
material response.The
basic
principlebehind DMA
is
analyzing
a material's responseto anoscillating
force.
Based
on a material'sresponsetoa sinusoidalstress, thestiffness(modulus)
canbe
calculatedfrom
thesamplerecovery, andthetendency
toflow
(viscosity)
is
calculatedfrom
thephaselag. Transition
temperaturescanbe
found
through
drastic
changesin
thematerial'smodulus.The
stiffnessdescribes
theability
ofthematerialto recover
from
adeformation,
andtheviscosity
describes
theability
ofthematerialto
lose
energyin
theform
ofheat (damping). DMA
outputs amoduluswhichdiffers from
theYoung's
modulus of elasticity.Young's
Modulus,
from Hooke's
law,
is
defined
astheratio of stressto strainasshownin
equation14.14
E
=-(14)
E
canbe
determined
by
plottingseveral pointsin
thelinear
region of stress-strain curveand
finding
theslope oftheline
throughthepoints.As previously
stated,DMA does
notmeasure
Young's Modulus
directly,
it
outputs a complex modulusdenoted
by
E*.
E*is
defined
as,E*=E'+iE"
(15)
whereE'
is
theelastic storagemoduluswhichis
ameasure ofthematerialsability
tostore or returnenergy, andE"
is
theimaginary
loss
moduluswhichis
thematerial'sability
tolose
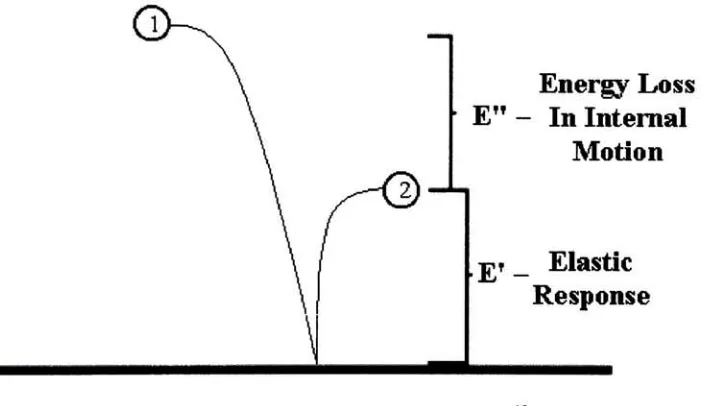
energy.A
goodanalogy
of whatE' andE"is best
thoughtof as aball
bouncing
as shownin
Figure
1415. The
height
thatis
recovered after abounce is
E',
theEnergy
Loss
In Internal
Motion
Elastic
Response
Figure 14 Elastic ResponseAnalogy15
elasticresponse,andthe
difference between
theoriginalheight
andthe secondheight
represents
E",
theenergy lost due
tointernal
motion.An
expressionfor
E'is,
E'=
^
v*,
cos
5
= JoKbkj
cosS
(16)
where
fo
is
theforce
applied,b
is
thesamplegeometry
term,
k
is
thesampledisplacement
atthepeak and
5 is
thephasedifference between
thematerial andtheapplied stress. [image:33.514.81.432.277.480.2]result
if
adifferent
sampleis
used andtheforces
are not adjustedtobe
thesame.The
imaginary
(viscous)
loss
modulusis described
by
equation17.
E"=
^
Ke J
sin = Jo
ybkj
sin5
(17)
where
b,
k,
and5
are thesame asthoseusedto calculateE'. Figure 15
gives agraphicalrepresentation of
how
k
and8
arefound from
theresponse.Another
important
property
that
DMA
measuresis
the tangentofthephasedifference.
This quantity
is
calleddamping
andit
representshow
efficiently
thematerialloses energy
tointernal friction
and molecular rearrangements.
Tan
8 is defined
as,+
_
E" 77* e"
tanS~ = = (18
)
E' rj" s1
where n'
is
theenergy
loss
portion ofviscosity
and n"is
thestorageportion, s'is
thein
phase strain and s"
is
theoutof phase strain.Force
Force(Djnamic)
JT\
Force(Static)
t
Time
Phase
MaterialResponse J ,
r*x
ft
Angle=6
J\
\
/
/
Amplitude= kStress
\\tCS
Time
Figure 15 Dynamic Responseof aMaterial
Since
tan8 is
theratio oftheloss
to thestoragemodulus,it is
independent
ofgeometry
and can also
be
used as a checkfor
possible measurement errorsin
atest.9To
testa specimendynamically,
aSeiko Instruments
DMS1 10
three-pointbending
machine was used.
Displacement
Clamp
NiTi
^End
Clamp
Specimen
Figure 16 Three-point
Bending
ApparatusFigure 16
gives aclose-up
view ofthe three-pointbending
fixture
oftheDMS1 10. The
specimens wereheated
in 2 C
steps wherethe temperaturewasheld
constant
for
threeminutesbetween
steps.The
temperatureranges usedfor
heating
variedbetween
specimensbecause
ofthehigher
initial
As
andAf
temperatures.The
heating
ratewas
kept
constant at2
C
perstep
regardlessofthe temperaturerangeused.The
temperatureranges
for
theheating
andcooling
runswere estimatedfrom
the transitiontemperatures
found from DSC
curves.For
thesecond andthirdtrials,
a generalheating
range
from 70C
to150C
wasused sincethe transformation temperatures stabilized afterthe
initial
heating
aboveAf. After
aheating
runhad
completed, thespecimen wasthensteps.
There
was no shiftin
theMs
andMf
temperaturesduring
cooling
sothisrangewasused across allspecimens.
A
constantflow
of300ml/min
ofNitrogen
wasusedduring
all
heating
andcooling
cycles.X-ray
Diffraction
X-ray
diffraction is
animportant
characterization methodfor
determining
thestructures of crystalline
materials,
andit is
appropriately
namedbecause
it
usesdiffracted
x-raysto makethese
determinations.
A
diffracted
x-ray is
similartoreflectedlight,
but
thereare some significant
differences,
for
example,light
reflects atany
angle ofincidence,
whilediffraction
ofx-raystakesplace at certainanglesonly.Another
difference is
that theintensity
of reflectedlight is
almostthesameastheincident
light,
but
theintensity
ofdiffracted
x-raysis
muchless
thantheincident
x-rays.The
reasonthat thereare
only diffracted
x-rays at certain anglesis
because
thereis
constructive anddestructive interference between diffracted
x-rays.When
ax-ray hits
anatom,it is
scattered
in
alldirections,
andwhenthere are atoms arrangedperiodically,such asin
acrystallinematerial,
many
ofthescatteredx-raysdestructively
interfere
with eachother,whileothersconstructively
interfere
withone another.The
constructiveinterference
occurs
because
thereare parallelbeams
thatareinteger
multiples ofx-ray
wavelength outof phase witheach other
(essentially
they
arein
phase),andthephasedifference
comesfrom
thedifferent distances
thebeams
travel.It
is
theconstructiveinterference
thatmakex-ray diffraction
possible.To
understandhow
x-raydiffraction
works,consider a set of parallel planesspaced a
distance
d'
apart, suchas
in
acrystallinematerial(Figure
17). In
thefigure,
abeam
withknown
wavelength(X)
is incident
onthecrystal at an angle0. This
angleis
known
asBragg's angle andit is
measuredbetween
thecrystal planes andthebeam.
Considering
beams
1
and2, they
strike atomsK
andL
and are scatteredin
alldirections,
S L
Figure 17 DiffractionofX-Rays
by
acrystal16
but only in
the1
'and2'
directions
willthescatteredbeams be in
phase.The
phasedifference
is
relatedto thepathdifference,
andit
canbe described
by,
ML
+LN
=d'sin0
+d'sm 9
This
is
also thepathdifference for
theraysscatteredby
S
andP because
thereis
nopath
difference between S
andL
orP
andK. Since
therays1
'
and2' will
be
in
phase,equation
(19),
which wasfirst
writtenby
W.L.
Bragg
canbe
used.nAX=
2d'sw.O
(19)
This
relationis known
asBragg'
s
law. This
expressionis
generally
found in
theform
ofEquation20,
wherethesubstitutionofd
=d'/n
is done for
convenience.
X
=2d
sin6
From
thisexpressionwe can seethat the angle6
is
afunction
ofthespacing
between
planes as well asthewavelength ofthex-rays.In
thecaseofx-ray
diffraction,
the
interplanar
spacing
d,
is
found
by
exposing
acrystalto x-raysofknown
wavelengthand
measuring
theangles at whichdiffraction
occurs.To
measuretheangles at whichdiffraction
takes place,adiffractometer
is
used.A
diffractometer
consists ofanx-ray
source, astage, and a counter.The x-ray
sourceis
acathode
ray
tubewhich provides characteristicradiation,thestageis
theareawherethespecimen
is
mounted,andthecounter measurestheintensity
ofthediffracted beams.
The x-ray
tuberemainsstationary
at alltimeswhile thestageis
rotatedin
placeandthecounter
is
rotated aroundthestage.Typically
theanglebetween
theincident beam
andthe
diffracted
beam is
measured ratherthan0. It
is
known
that theanglebetween
theincident
anddiffracted
beam
is
29.
16The
counterthenmeasurestheintensity
ofthediffracted
beam. The final
outputofthediffractometer
is
a plot ofdiffracted beam
intensity
versus20.
For
this study, the crystallographic structure oftheNiTi
ribbonwasdetermined
through
x-ray diffraction using
aRigaku
DMAX-IIB diffractometer
withCu
K<x
radiationat
40kV
and35mA.
13mm
specimens were cutfrom
eachstrained sample andmechanically polished, andthenmountedto a glassslide with
double-sided
tape.Scans
began
at10 degrees
and ended at80 degrees
withascanning
rate of1
.2deg/min.
The
slitconfiguration
defining
the x-rayoptics was set withadivergent
slit of1,
ascattering
slitof
1
,
areceivingslit of0. 1
5mm,
andanickelfilter.
From
theXRD
scans, peakswereidentified
andthecorresponding
d-spacings
werecalculated.
From
thesepeaks, thelattice
parametersfor
aB19' monoclinic unit cellwere calculated
using
linear
regressionas well asExcel'ssolver.To
solvefor
theseparameters, theequation
for
theplane spacingsofamonoclinic cellhad
tobe
used.161
1
ft-2d2
sin2/?
h1
k2sm2/3
I22hlcos/3
a ac
(21)
In
orderto useEquation
21
withtheknown
parametersfrom
pdf35-1281,
it
had
to
be
rearrangedreplacing
theanglep
withy,andtheresulting formula
was,J_
d2
1
(h2 k2 ,2^2 n .,,- Asin
y
a2 b2I
sinfi
2hkcosy
c2
ab
(22)
Hardness
Testing
The
Knoop
hardness
testwasdeveloped in
1939,
andit
usesapreciselyshapeddiamond indenter
andvariousloads
todetermine
hardness
characteristics of materialsthatcannot
be
testedby
conventionaltechniques.The
indenter,
as shownin Figure 1
8,
produces arhombic-shaped
indentation
(Figure
19)
wheretheratiobetween
long
andshort
diagonals is
approximately7
to1
whilethedepth
oftheindentation
is
approximately
1/30
ofthelength
ofthelong
diagonal.
A
Knoop
indenter
was chosenFigure18
Knoop
IndentorI
Figure19
Knoop
Indentationin NiTiSurfaceThe
Knoop
hardness
number(KHN)
is
theratio of theload
appliedto theunrecoveredprojected area.
KHN
er
(23)
In
thepreviousequation,P
is
theload
appliedin
kg,
1is
thelength
ofthelong
diagonal in
mm andC is
theindenter
constantrelating
theprojected area oftheindentation
to thesquareofthelength
ofthelong
diagonal. Since
thelong
diagonal
is
typically
measuredin
urnandtheload
appliedis
in
grams, a moreconvenientequationfor
calculating
theKHN
canbe
written.14229P
KHN= '
(24)
where
Pi
is
theload in
gf anddi
is
thelength
ofthelong
diagonal
in
urn.Hardness
testing
is
avery
valuabletoolbecause
it
relatesthehardness
numbertoother properties ofamaterial.
It
is
a measure oftheresistance ofthematerialtoplasticdeformation.
In
thehardness
test,
theindenter is
pressedinto
thesurface andthematerialdeforms
plastically
leaving
anindentation,
whichis
thenmeasured.As
aresultoftheplastic
deformation
thematerialwork-hardens.17Since
thereis
work-hardeningaswellasplastic
deformation
occurring
during
ahardness
testit is
evidentthat thehardness
numberis
relatedto theyield stressofthematerial aswell asthestrainhardening
coefficient.Also,
thehardness
numberis
relatedto themodulus ofelasticity
ofthematerialbecause
there
is
some elasticspring back
ofthematerialwhentheindenter
is
withdrawn.This
elastic
spring
back
makesdetermining
hardness
valuesfor
someSMA very difficult.
Depending
onthetemperature at whichthe testis
conductedat, theSMA
could recoversome ofthe
indentation if
not all ofit,
whichwould give erroneous values.For
thisresearch, the
NiTi
wasknown
tobe in
themartensitic phaseduring
testing
based
onDSC
scans.
The hardness
testing
for
thisresearchwasdone in
accordance withASTM
standard
E384.18
All hardness
testing
was performed onaMitutoyo MVK-H1
hardness
testing
machineatroomtemperature.A
Knoop
Indenter
witha100
gramload
was usedfor
allindentations. The duration
oftheindentation
was12
seconds.After
theindentation
wasmade,theindent
wasbrought
into
focus
at40X
magnification.Prior
to measuring thelength
ofthelong
diagonal,
theindentation
was checkedfor
symmetry.An indent
was consideredsymmetricif
therewasless
thana20%
thespecimen was adjustedtomake surethat thesurface wasperpendicularto the
indenter
and another
indent
was made and checked.The
long
diagonal
wasmeasuredby
placing
the
inside
edge oftheocularlines just into
contact withtheedges ofthelong
diagonal.
The
hardness
testerconvertedthelength
oftheindent into
theKnoop
hardness
numberusing
equation23. Three
separatehardness
valuesweretakenfor
eachindentation.
Indentations
were made untiltheKHN
were within10,
and atleast 5 indentations
weremadepersample.
Optical
Microscopy
Optical microscopy is
a valuabletool thatmetallurgistsusetoidentify
surfacecharacteristics of a material.
In
this research,brightfield
images
oftheNiTi
surfaceweretaken.
Brightfield
images
usenormallighting
wheretheimage is
reflectedvertically
from
thesurfacethrough thelenses. Images
werethenextractedusing
avideocapturesystemwitha
gray
scalecamera.Prior
toviewing
thespecimensunderthe microscope,the
NiTi
samples weremechanically
polishedto a0.04
urnfinish. No etching
wasperformed.
Atomic Force
Microscopy
Atomic Force
Microscopy
is
animaging
techniquedeveloped
in
1986. AFM
usesan
extremely
smallsharp
tip
thatis
affixed orintegrated into
acantilever.The
radiusofthe
tip
greatly
effectstheresolution ofthescanned surface sofor
thebest
resolution,ideally
a single atomtip
shouldbe
used.The
tip
usedin
thisresearchhad
aradiusofless
than
lOnm.
Depending
onthemodethat theAFM
setto,
eitherthetip
is
dragged
acrossthesurface ofthe test piece, orthe
tip
taps thesurface.The
method usedfor
thisresearchwas
tapping
mode wherethetip
lightly
taps thesurface.The
tapping
modeis
advantageous
because
thetip
does
notremainin
contactwiththesurface sothereis less
damage
to thesample andthe tip.In
tapping
mode, thecantileveris
oscillated atits
naturalfrequency by
apiezoelectric crystaland
it is
movedtowards the surfaceuntilit begins
totap
thesurface.When
thetip
contactsthe surface, theenergy
oftheoscillating
cantileveris dissipated
andtheamplitude ofthecantilever
is
reduced.To
keep
aconstantoscillation, thesurfaceto
tip
distance is
adjusted.The
changein
oscillation amplitudeis
whatis
usedtoidentify
and measure surface
features. The
amplitudeis
measuredby
laser beam
deflection.
A
laser
is
focused
onthebackside
ofthecantilever andthebeam
reflects and strikes aphotodetector.
This
methodofmeasurement allows sub-angstrommeasurements.19'20
AFM
was performedusingaDigital
Instruments Dimension 3000
atomicforce
microscope
in
tapping
mode.A
scansizeof15um
wastakenat arate of0.6 Hz in
ambientconditions.
Prior
toscanning
theNiTi strip
wasmechanically
polishedtoa0.04
urn
finish
andcleaned with alcohol.The
areasofinterest
ontheNiTi
surface wereData/Processing
Method
Determination
ofModulus
ofElasticity
According
toHooke's law
(5),
themodulus ofelasticity
is
theproportionality
constant
between
stress and strainin
theelasticregion ofdeformation,
therefore,
aneasy
way
to calculatethemodulusis
tofind
theslopeofthelinear
elastic region.To
do
thisone can perform atensile teston a specimen and calculatethestresses andstrains within
the
linear
elastic range andfit
a straightline
to this region, wheretheslopeoftheline is
themodulusofelasticity.
Also,
it has been found
thatif
a materialis loaded into
theplastic region andthen unloaded, the stress
decreases in
alinear fashion
andit is
parallelto the
linear
elasticregion.14Since both
regions arelinear
andthemodulus ofelasticity is
the
first derivative
ofthefitted
line,
an alternativefor
finding
themodulusis
tousenumericalmethods to
find
thefirst
derivative
ofthedata
points.One
drawback
tonumerically
differentiating
experimentaldata is
that thedata
contains noisethat
is
characteristicofthe equipment usedduring
theexperiment.Because
ofthis noise,it is difficult
todirectly
apply
thestandardformulas
for
forward,
central, and
backward difference.
Alternatively,
therehave been
severalmethodsgeneratedto numerically
differentiate
experimentaldata using FORTRAN
programs.21'22.These
methodsalsoapply
smoothingtechniquesto tninimize errors.The FORTRAN
program used
for
thisresearchcanbe
found
in Appendix C.
The
numericaldifferentiationmethod chosenis known
astheAnderssen-Bloomfield-Cullummethod21.
To implement
this method, the observeddata
mustfirst be
arranged
into
afunction,
(xi? ),
i
=1
...N.Next
thefunction
is
transformedso thatit is
zeroatxi andxN.
After
thetransformation,
theFourier
coefficients are calculatedusing
Goertzel's
methodcombinedwithReinsch's
modifications21.Then
thevalue of athatminimizesthe
function
L(a)
is
calculated.The
function
L(a)
is:
ft-r A
L{a)
=(N-l)ln
Jjft-Wj)
-j>(l-Mr)ft=i
)
N-\
where
Yj
denotes
thefinite Fourier
coefficients,
andWj
thevalueofwy
with^
=7r/(N-1).
Finally
thederivative
values arefound from
thefollowing
equation:fif)
=fJYJwJfJsm{(j>Jt+T^-where,
m 2k
'P i=0
To
find
thefirst
derivative
oftheelasticregionstress and strainvaluesfor 0
to0.1%
strainwere considered.For
theunloading
region, the strainsfrom
themaximumstrainto
0.2% below
that strain were considered.Also,
thefirst
threepoints oftheunloading
curvewere neglectedto removeany Hertzian
effects.Theoretically
theresulting derivative
shouldbe
constant acrossall strains sincetheregionis
linear,
but
due
tonoisethevalue
fluctuates
sotheaverage ofrangewillbe
reportedalong
withthemaximum,minimum, and standard
deviation
ofthederivatives.
Determination
ofTransformation
Temps
Differential
Scanning Calorimetry
Previously
it
was mentionedthat therearedefinite
temperaturesat whichtheforward
andreversetransformationsoccur.To
characterizethesetemperatures,
oneslightly between
every experiment,
andboth
DSC
andDMA,
which were usedin
thisstudy
are noexception.To
characterizethetransformation
temperaturesusing
DSC,
a methodsimilartothe
ASTM standard,
ASTM
El
356-91,
was usedfor
determining
theglasstransitiontemperatures
ofpolymers.23The first
step
takenwasto take therawdata
from DSC
andseparate
heating
cycles andthecooling
cycles and plottheheat
flow
asafunction
oftemperature.
The
austenitetransformation temperaturesarethendetermined
from
theheating
cycle andthemartensitictransformation temperaturesaredetermined from
thecooling
cycles.The
transformation temperaturesarethenfound
based
onthelocation
oftheexothermic or endothermic peaks.
To