6-1-1951
Development of a process for the production of a
high hafnium concentrate
A. Jacobs Ames Laboratory R. D. Mateller Ames Laboratory G. H. Beyer Ames Laboratory
Follow this and additional works at:http://lib.dr.iastate.edu/ameslab_iscreports Part of theCeramic Materials Commons, and theMetallurgy Commons
This Report is brought to you for free and open access by the Ames Laboratory at Iowa State University Digital Repository. It has been accepted for inclusion in Ames Laboratory ISC Technical Reports by an authorized administrator of Iowa State University Digital Repository. For more information, please [email protected].
Recommended Citation
Jacobs, A.; Mateller, R. D.; and Beyer, G. H., "Development of a process for the production of a high hafnium concentrate" (1951). Ames Laboratory ISC Technical Reports. 16.
Abstract
An investigation was made to determine a method for producing a high hafnium concentrate. The final product was to be a by-product from a recently developed adsorption process for the production of pure zirconium.
Four experimental runs are reported. Each run consisted of the adsorption of hafnium and zirconium tetrachlorides from methanol solution on activated silica gel~ and the subsequent stripping of the gel using a methanol-hydrogen chloride strip solution and~ finally~ a sulfuric acid strip solution.
Disciplines
Ceramic Materials | Engineering | Materials Science and Engineering | Metallurgy
l
ISC-140
DEVELOPMENT OF A PROCESS FOR THE PRODUCTION OF A HIGH HAFNIUM CONCENTRATE
By
A. Jacobs
R. D. Masteller G. H. Beyer
June 1, 1951
as submitted to this office.
Work performed under Contract No. W-7405-6ng-82.
PRINTED IN USA PRICE 15 CENTS
TABLE OF CONTENTS
Page
I . SUMMARY 4
II. INTRODUCTION 5
III. EXPERIMENTAL 6
Materials 6
Apparatus 6
Procedure 9
Data and results 11
IV. DISCUSSION· 12
Analysis of data and results 12
Recommendations 29
v.
CONCLUSIONS 30VI. BIBLIOGRAPHY 30
DEVELOPMENT OF A PROCESS FOR THE PRODUCTION
OF A HIGH HAFNIUM CONCENTRATE
by
A. Jacobs~ R. D. Masteller~ and G. H. Beyer
I. SUMMARY
An investigation was made to determine a method for pro-ducing a high hafnium concentrate.. The final product was to be a by-product from a recently developed adsorption process for the production of pure zirconium.
Four experimental runs are reported. Each run consisted of the adsorption of hafnium and zirconium tetrachlorides from methanol solution on activated silica gel~ and the sub-sequent stripping of the gel using a methanol-hydrogen
chloride strip solution and~ finally~ a sulfuric acid strip solution.
Six-inch diameter by 5-foot length glass columns were used when the starting material contained a low weight per cent of hafnium. When the activity of gel was completely dissipated~ progression of hafnium concentration was from a 2 weight per cent hafnium oxide (based on hafnium and zirconium oxide content) in the feed to 25 weight per cent as adsorbed oxide~ and finally~ to 50 weight per cent hafnium oxide in the sulfuric acid strip solution.
A two-inch diameter by 3-foot length glass column was used when the starting material contained a high weight per cent of hafnium. This feed was prepared from selected incre-ments of the sulfuric acid strip solution of a six-inch
diameter column run. The progression of hafnium concentration in one ru1J. was from a 42 weight per cent hafnium oxide in the feed to 51 weight per cent on the gel~ and finally, to 67.5 weight per cent in the sulfuric acid strip solution; a
second run gave corresponding values of 23~ 75.5, and 90. The large improvement in the second run was effected by doubling the concentration of the feed material (based on the total zirconium and hafnium oxides in solution) .
process cycles, each cycle involving an adsorption on silica gel followed by differential stripping of the adsorbate. It is estimated that 70% of the initial hafnium adsorbed can be recovered as 90 weight per cent hafnium oxide.
II. INTRODUCTION
Hafnium is a :rare metal which was discovered in 1923 by Coster and Hevesy.4 It is estimated that its proportion of the earth's crust is greater than 2 x l0-3 per cent. In nature, hafnium always occurs in combination with zirconium. The commonest source of hafnium is various zirconia sands where it exists in concentrations ranging from 1 to 3 per
cent. These sands are found in the United States, New Zealand, Italy, and certain Scandinavian countries.
There have been only two significant industrial uses of hafnium.l It is used in the preparation of certain lamp fila-ments and photo-electric cells. In each case, the amount of hafnium used is very small. Experimentally, it has been used in the making of x-ray photographs, for special glasses, and in television. Its limited industrial use reflects its high cost. Hafnium and zirconium are not easily separated; in fact, no large scale process for producing pure hafnium-has ever been reported. At the present time there is no pure hafnium available on the commercial market.
The principal methods used in the past for separating hafnium and zirconium have been fractional crystalliz a-tion,3,11,12,1.5,19 precipitationl0,17,18,20,22 and sublima-tion.2,7,16 Some of these methods are, indeed, quite tedious and laborious. Several of the fractional crystallization and precipitation methods required as many as one to two hundred operational cycles. Recent literature reports liqyid-liquid extraction,5,6,13 ion exchangel4,21 and adBorption~,9
methods for separating the metals. These latter methods are promising because they are reasonably economical and
generally adaptable to large scale operation.
III. EXPERIMENTAL
Materials
Most of the chemicals and materials used were obtained from commercial manufacturers and were without special specifi-cations. Deserving of attention, however, are the following:
Zirconium and Hafnium Tetrachlorides (mixed). · Composi-tion by
weight:----ZrCl4 & HfCl4 FeC12
TiCl4 SiCl4
99.7
%
0.2
0.05
0.17
The average HfCl4 content was 2.5 per cent. The tetra-chloride used as feed. material was purchased from Titanium Alloy Manufacturing Co., Niagara Falls, N. Y.
Silica Gel. The silica gel used as a selective adsorbent for separating hafnium and zirconium was purchased from
Davison Chemical Co., Baltimore, Maryland: mesh 28-200, received commercially activated (approximately 5 per cent water). The gel was further activated by heating at 3000C for a period of about two hours.
Apparatus
Adsorption Columns. Two sizes of glass adsorption
columns were used f'or holding the bed. of silica gel; the
.· __ J~s.ur..ements of these columns were: 2-inch outside diameter
.. . , . . f.oot length, and 6-inch inside diameter by 5-foot ·
_ .<---' ~~._., -: .tb, Short secti.ons of ten millimeter glass tubing were
__ -;-::.:;4 · :ed into one-hole rubber stoppers at each end of the
2-~ .. ,:.:-::;;-z.; · - ~j.am~.:t.er;"'" co lum.r:. Fluid head was used to force liquids thr·ough the columns and tygon tubing was used for all supply and product lines. The 6-inch diameter column was closed at each end by flanges, as shown in Figure 1.
Pipe to tube
SECTION a- a
t---tt----+---1 A
SCHEMATIC DRAWING
6"
1---t----< D
0~---~
Fig. I ADSORPTION COLUMN AND ACCESSORIES
A.- Pyrex Column
B- Feed Carboy
C- Product Carboy
0-TyQon TubinQ
E- Air Bubble Collector
1 --j f---2' I _j
I
@ Jd
~I N
Q ~
i I
!
/
-
~p
3. ( I
@
® '-'
-E
II
0
-=:...._f2
~ ~
i
pI c
I
=I
"-"
<G> h
Fi9. 2 SECTION THROUGH CHLORINATOR
A- Glass Slnt~r td PI o te J-CoolinQ Wo ttr In Itt
8-Carbon TttrothloricU supply J-Cold FinQtr
c -Sio ht G Ia ss K- Coolin 9 Water 0 utlt•
D- Carbon Tttrochlcridt RtStr>Joir L-Vent
E- Furnace, Electric M-Oxidt
F1, 2, 3 - Thtrmo eouplts N- '~, Py r t x Joint
Procedure
The procedure for the several steps in the process can
only be described in general, for although the steps for
each run were identical and in the same order, the quantities of materials involved changed. Such would be the case, for example, when using different size columns. The quantities
of materials used for any particular run are given in Tables
3 and
4.
Step 1, adsorption. This step was begun by preparing
the f"8'e"Clfrom a weighed amount of mixed hafnium and zirconium
tetrachlorides dissolved in the desired volume of methanol.
The adsorption column was loaded with silica gel,
acti-vated by heating approximately 2 hours at 300°C. The column
was partially filled with methanol and the gel then poured
into the column. It was necessary to maintain an excess of
methanol in the column to remove the large amount of heat
generated when the gel and methanol were mixed.
Feed was next charged to the bottom of the column, the
volume of feed used being somewhat arbitrary. The rate of
flow was controlled by a screw-type clamp on the column
dis-charge line. The feed rate varied with column size, but was
calculated so that each increment of feed would be in
con-tact with gel for approximately 11 hours. Research by
others had shown this time to be sufficient for a reasonable
approach to equilibrium conditions between the metallic
com-plex on the gel and that in solution. When the desired
amount of effluent had been collected, the feeding was
stopped and the column drained. Then the column was fed
methanol in order to remove all occluded feed and this methanol
wash continued until the addition of ammonium hydroxide to the
column effluent gave negligible precipitate. The column was
again drained.
The following samples were taken during the adsorption •
step and later analyzed spectrographically for hafnium and
zirconium ratio:
1. Feed
2. Column effluent at regular intervals
3. Composite of all effluent collected
4.
Feed drainage.5. Methanol wash solution
Data recorded included:
1. Volume of feed
4.
Volume of feed drainage from colum.n5.
Volume of methanol wash6.
Feed flow rateStep 2, methanol-hydrogen chloride stripping of the gel. This 8-Erip-solution was prepared by bubbling hydrogen-cfilorid.e into methanol since water was found to be extremely detrimental in differential stripping. The normality of the solution used depended on the estimated hafnium-zirconium ratio on the gel. As the acidity increased, it was found. that the solution wouil.d. strip more material from the gel, but its preference for
zirconium would. diminish.
The strip solution was charged to the column in the same manner as feed. The rate of flow was arbitrarily selected to be twice that of the adsorption operation and the effluent
collected. in increments. This strip was continued until it was noted that the oxide content of the effluent had decreased markedly, indicating that the strip solution was no longer removing material from the gel. At this point the column was drained.
The following samples were taken and. spectrographically
analyzed:
1. One of each effluent increment
2. Column drainage
Data recorded included:
1. Normality of strip solution
2. Flow rate of strip solution
3.
Volume of each strip increment4
.
Volume of column drainageStep 3, sulfuric acid stripping of the gel. A 7 normal
sulfurrc-acid solution was used in al~cases:-since this had
previously been found best for total stripping. The flow
rate was the same as for the methanol-hydrogen chloride strip. The solution was fed t o the column until addition of ammonium hydroxide to the column effluent gave no precipitate. At this
point the silica gel was assumed. to be completely stripped.
The effluent was collected. in increments. The column was
drained and. flushed with water to remove as much occluded
acid. as possible. The gel was then removed. from the column.
The following samples were taken and. spectrographically
analyzed. for hafnium and. zirconium ratio:
Data recorded included:
1. Normality of strip solution 2. Flow rate of strip solution 3. Volume of each strip increment
Step
4·,
chlorination of the high hafnium oxideprecipi-tated-rrorn-the sulfuric strTp-.-Those lncrements of the
su1rurTCStrip which contained the higher weight percentages of hafnium were combined and precipitated by addition of
ammonium hydroxide, and then ignited to the oxide in a labor-atory furnace. This oxide was ground until it would pass a
38 mesh screen and then converted to the tetrachloride in the
chlorinator. The oxide.was charged to the converter, where
it was supported by glass sintered plate A (this and all
subsequent letters refer to Figure 2). Furnace E ·was brought
to a temperature of about 4500C as indicated by thermocouple Fl. Although zirconium and hafnium tetrachlorides sublime at
slightly over 360°C under atmospheric pressure, the higher temperature of the furnace was necessary because of poor
conductance of heat through the oxide bed. Current was
supplied to resistance windings Gl to bring the upper part of
the converter to a temperature of about 400°C as measured by
thermocouple F2. Carbon tetrachloride from supply vessel B was added to reservoir D until it was nearly full, as
indi-cated by sight glass C. Next, helium was allowed to flow through line H into the carbon tetrachloride in reservoir D
while current was supplied to resistance windings G2 until
thermocouple F3 indicated a temperature of 50°C. The helium flow was controlled so that the oxide bed was slightly
fluidized. Cooling water entered the cold finger J through line
I and left through exit line K. Zirconium and hafnium
tetra-chloride vapors were carr'ied up the column and condensed on
cold finger J. The helium and unused carbon tetrachloride passed out through exit L. Periodically, the cold finger J
was removed and the condensed tetrachlorides collected.
Data and Results
Basis. All concentrations and much other data andre-sults are reported on the oxide basis, eliminating speculation as to what compounds might be formed in various parts of the process.
Hafnium content. The hafnium content is generally re-ported as a weight per cent of the oxide, or in terms of the
expression Hf/Zr X 100, referring to grams of hafnium per gram of zirconium times. 100. This is a convenient expression,
especially f·or the spectrographic laboratory, because it gives
the weight ratio of hafnium to zirconium and is completely in-dependent of any other elements which might be present in the
graphic results reported are within ~ 5.0% base~ on the weight
per cent of the element present.
Tables and graphs. Data and results for two 6-inch
diameter and~o 2-inch diameter column runs are .summarized.
in Tables l-4 and plotted. in Figures 3-12.
IV. DISCUSSION
Analysis of Data and. Results
Six-inch diameter column runs . Figure 3 shows the Hf/Zr x
100 ratio of the column effluenr-fo be a linear function of the
throughput above 0.25 # oxide/# gel for the six-inch diameter
column. The slope of the curve for Run 2 would. indicate that
the silica gel used in this run was more active than the gel
used for Run l. It was necessary to use several types of
furnaces to activate the gel, and difficulty was experienced, in
obtaining reproducibly activated gel. In Figure 3, the final
-point of each curve has an abnormally high Hf/Zr x 100 value.
Actually, these points represent the column drainage at the
end. of the adsorption step, and. hence, do not represent normal
column throughput. Since a good portion of this drained feed.
had not been in contact with silica gel long enough to
approach equilibrium, its hafnium eontent was understandably
high.
Figure
4
compares the methanol-hydrogen chloridestrip-ping of silica gel for Runs l and 2. Although the general
form or the curves is the same, the corresponding curves
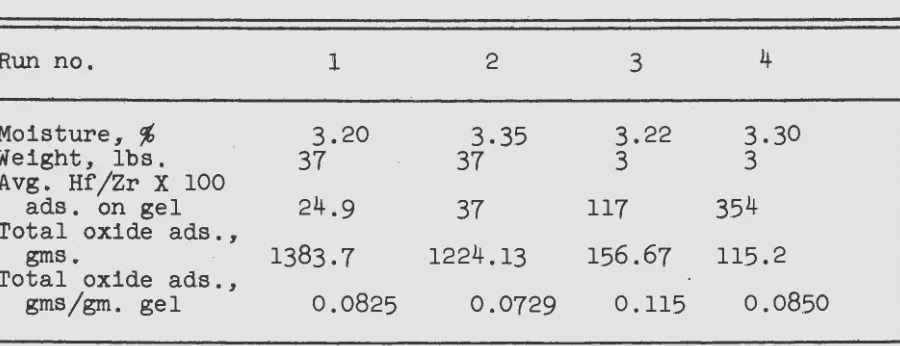
from each run are not nearly coincident. Table 3 shows that
the grams of oxide per gram of' gel adsorbed. for Runs l and 2
were, respectively, 0.0825 and 0.0729; and, the average
Hf/Z.r X 100 value of the adsorbed oxide for each run was,
respectively, 24.9 and
37.
Because of these differences agiven volume of strip solution would not be expected to
strip the same amount of oxide i.n the same hafnium to
zirconium ratio for the two runs.
There is some debate concerning the effect of the methanol
washing of gel after adsorption. One source reports that this
wash is capable of removing one-half of the total adsorbed
oxide. Another source reports the stripping action of pure
methanol to be of the order of magnitude of 10 to 1.5 per cent
of the adsorbed oxides. The exact figure is hard to determine
since one cannot be sure whether the oxide content of the wash
solution is due mainly to possible stripping action on the
gel or to the removal of occluded feed. The answer may well
TABLE l
ADSORPTION ON SILICA GEL OF HAFNIUM AND ZIRCONIUM .
TETRACHLORIDES IN METHANOL
Run no. Lbs. total oxide Cone. of efflu- Hf/Zr X 100
throughput per ent, gms/5cc of effluent
lb. of gel
l 0.245 0.657 0.05
( 6" column) 0.305 0.659 0.18
0.422 0.636 0.45
0.532 0.615 0.58
0.666 0.602 0.77
0.740 0.386 1.20
0.760 0.156 1.45
0.789 0.103 1.55
0.795 0.040 2.20
2 0.359 0.664 0.23
(6" column) 0.630 0.692 0.80
0.975 0.690 1.30
1.290 0.670 1.90
1.435 0.453 2.20
1.470 0.081 2.50
3 0.004 0.049 26.0
(2" column) 0.022 0.118 8.2
0.036 0.083 10.0
0.064 0.088 12.3
0.090 0.098 12.2
0.116 0.087 14.0
0.130 0.090 14.0
4 0.032 0.479 2.0
(2" column) 0.078 0.638 1.5
0.126 0.649 2.1
0.201 0.509 11.0
0.276 0.508 19.0
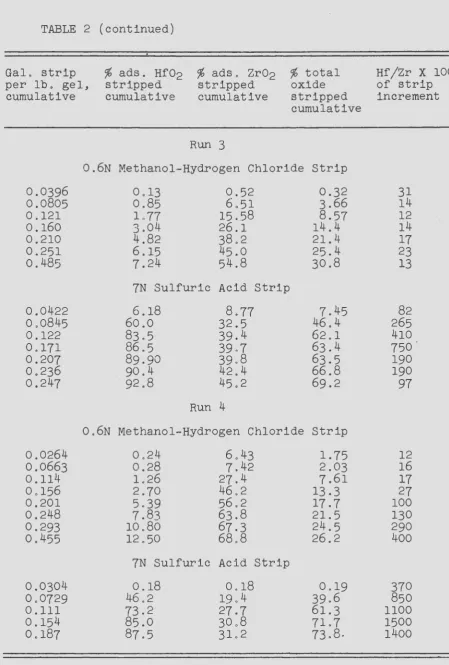
TABLE 2
STRIPPING OF ADSORBED HAFNIUM ANP ZIRCONIUM FROM SILICA GEL
Gal. strip %ads. Hfo2 %ads. Zro2
%
total Hf/Zr X 100per lb. ge1, stripped, stripped, oxide of strip
cumulative cumulative cumulative stripped, increment cumulative
Run l
l .8N Methanol-Hydrogen Chloride Strip
0.027 0.11 l. 70 1.42 1.65
0.054 0.52 8.31 6.91 1.53
0.081 1.52 18.4 15.4 2.45
0.108 3.32 33.0 27.7 3.1
0.135 5.47 43.5 36.6 5.1
0.162 7.82 51.8 43.8 7.1
0.189 10.7 58.2 49.6 11.3
0.216 13.7 63.3 54.3 14.7
0.297 20.9 71.4 63.3 21.0
7N Sulfuric Acid Strip
0.027 1.97 4.94 4.31 10
0.054 18.0 17.0 17.19 33
0.081 56.0 24.1 30.5 120
0.108 7~.2 27.9 36.2 155
0.135 79.1 28.6 36.7 180
Run 2
l.7N Methanol-Hydrogen Chloride Strip
0.027 0.07 0.58 0.46 4.3
0.054 1.87 26.5 20.5 2.7
0.081 4.52 43.1 33.7 5.9
0.108 7.31 53.7 42.3 9.8
0.135 10.30 61.2 48.7 15.
0.162 13.29 66.7 53.6 20
0.189 16.00 70.1 56.9 29
0.216 17.25 73.0 59.4 16
7N Sulfuric Acid Strip
0.027 2.34 4.33 3.84 20
0.054 19.70 15.0 16.2 60
0.081 58.4 24.0 3.2.4 160
0.108 75.7 26.3 38.3 280
[image:16.564.9.553.25.724.2]TABLE 2 (continued)
Gal. strip per lb. gel, cumulative
%ads. Hf02 stripped cumulative
%ads . Zr02 stripped cumulative
Run 3
% total oxide stripped cumulative
0.6N Methanol-Hydrogen Chloride Strip
0.0396 0.0805 0.121 0.160. 0.210 0.251 0.485 0.0422 0.0845 0.122 0.171 0.207 0.236 0.247
0.0264 0.0663 0.114 0.156 0.201 0.248 0.293 0.455
0.0304 0.0729 0.111 0.154 0.187
0.13 0.85 l. 77 3.04 4.82 6.15 7.24
0.52 6.51 15.58 26.1 38.2 45.0 54.8
7N Sulfuric Acid Strip
6.18 60.0 83.5 86.5 89.90 90.4 92.8
8.77 32.5 39.4 39.7 39.8
42.4
45.2
Run
4
0.32 3.66 8.57 14.4 21.4 2.5
.4
30.8 7.45 46.4 62.1 63.4 63.5 66.8 69.2
0.6N Methanol-Hydrogen Chloride Strip
0.24 0.28 1.26 2.70 5.39 7.83 10.80 12.50
6 0 43
7.42 27.4 46.2 56.2 63.8 67.3 68.8
7N Sulfuric Acid Strip
0.18 46.2
73.2
85.0 87.5
0,18 19.4 27.7 30.8 31.2
l . 75 2.03 7.61 13.3 17.
·r
21.5 24.5 26.2 0.19 39.6 61.3 71.7 73.8 [image:17.562.61.511.45.711.2]TABLE 3
CHARACTERISTICS OF SILICA GEL AND ADSORBED OXIDES
Run no. 1 2 3 4
Moisture,.
%
3.20 3.35 3.22 3.30Weight, lbs. 37 37 3 3
Avg. Hf/Zr X 100
24.9 3.54
ads. on gel 37 117
Total oxide ads.,.
gms. 1383.7 1224.13 1.56.67 115.2 Total oxide ads.,
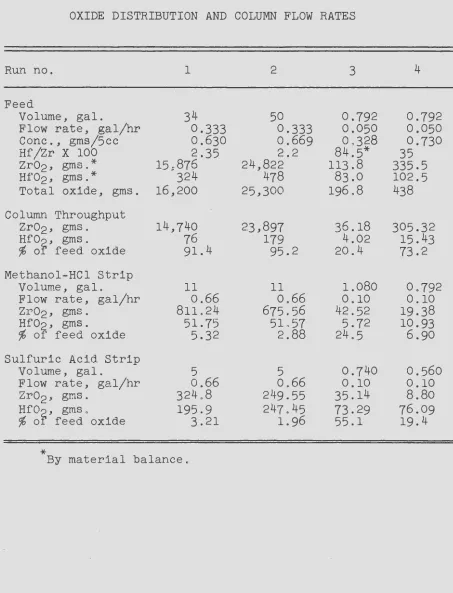
[image:18.564.43.493.123.296.2]TABLE 4
OXIDE DISTRIBUTION AND COLUMN FLOW RATES
Run no.
Feed
Volume, gal.
Flow rate, gal/hr Cone., gms/5cc Hf/Zr X 100 ZrOI'), gms.*
c.
*
Hf'02, gms.
Total oxide, gms.
Column Throughput Zr02 , gms.
Hf02 , gms.
%
of feed oxideMethanol-HCl Strip Volume, gal.
Flow rate, gal/hr Zr02, gms.
Hf02, gms.
%
of
feed oxideSulfuric Acid Strip Volume, gal.
Flow rate, gal/hr Zr02 , gr.1s.
Hf02 , gms.
%
of feed oxide*
l 3~-0.333 0.630 2.351.5 s 876
324 16,200 14,740 76 91.4 ll 0.66 811.24 51.75 5.32
5 0.66 324.8 195.9
3.21
By material balance.
2 50 0.333 0.669 2.2 24,822 478 25,300 23,897 179 95.2 l l 0.66 675.56 5L57
2.88
5 0.66 249.55 247.45 1.96
3
0.792 0.050 0.328 84.5* 113.8
83.0 196.8
[image:19.564.65.518.84.677.2]2.ar---~
0
• RUN
•
o RUN 2
0 ~-~-Z-~--~--~---L--~--~-~
0 0.2 0.4 0.6 0.8 1.0 1.2 1.4 1.5
Pounds of Toto I Oxide Throuohout Per Pound of S i lico Gel
FIG. 3- The Absorption Separation of Hafnium And Zirconium
Q)
C)
100~---~
E o RUN I 0
tt • RUN 2
-(/)
QJ
.,
) ( 0-
0-
c Q)0
~
QJ (l.
0 0
Gallons of Strip per Pound of Silica Gel
Q.
~
-(/)
-
00 Q
X
30r---~90
o RUN
• RUN 2
I e I
I
/
..
/
/
/
~"'
~(---
--6-
0-15 ~
(.)
_100
Gl
"
E ~ 80 u."0
Gl
a. a.
...
-(/)
Gl
"0
II(
0
~
0
-
cGl
u
...
Gla..
o RUN I
• RUN 2
~
-(/)
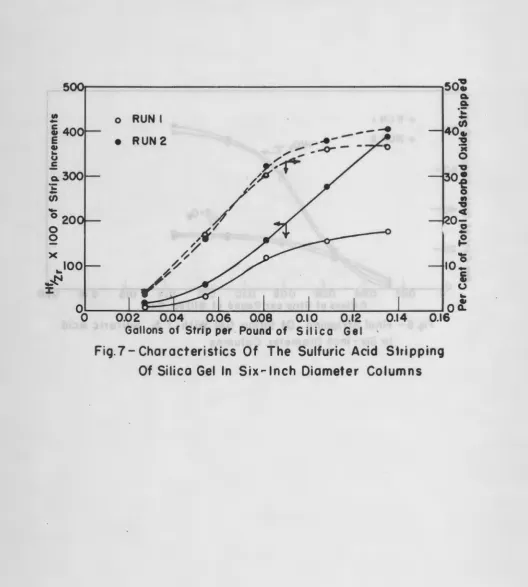
500.---,50~
o RUN I
• RUN 2
Pound of S iIi c a G e I
Fig.
7-
Characteristics Of The Sulfuric Acid Shipping Of Silica Gel In Six-Inch Diameter Columns~
~
·;:
-
(/)40.,
,
;c 0,
o,e
0
.,
,
4
0-;
...
[image:24.560.17.546.72.660.2]-30~---~
c
•
~--
w~
0
(,)
-o RUN 3
e RUN 4
0 10
0 0
0 )(
...
~N 0~----~~--~~----~~----~~--~~----~~--~~~--~
%
0 0.04 0.08 0.12 0.16 0.32Grams of Total Oxide ThrouQhput per Silica Gel
Fig.8- The Adsorption Separation Of Hafnium And Zirconium
-;!00 ~
E
0
~80 o RUN 3
• RUN 4
0
ol_~~~~o:.I~O~
·
==Oi.Js~==o~.2to~==o~
.
2~5~~o=
.
3Lo====~====~==:J===:oJ.5o
[image:26.564.12.552.31.685.2]Gallons of Strip per Pound of
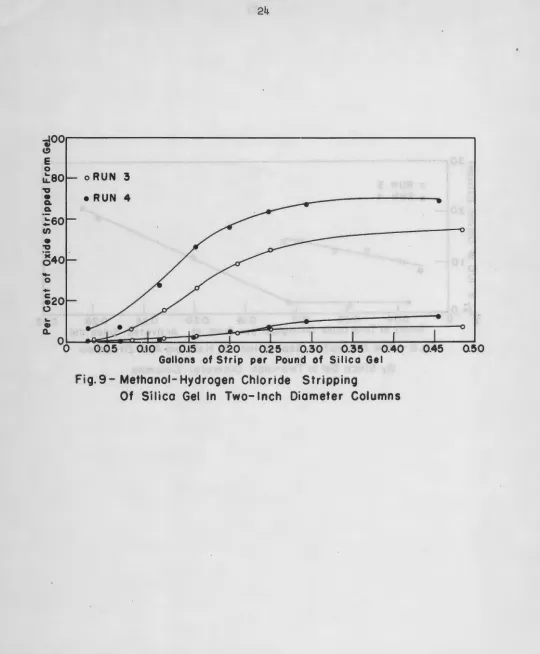
Fig. 9- Methanol- Hydrogen Chloride Stripping
8
500~---~50
o RUN 3 eRUN 4
IC
0
-
010
c
u (.)
...
uo
0
~.i5;~!=~~~~=:::;t;~:::;:~=;t;::::::::::;:!;:;::=~;=::;::!:;::~ o (l. 0.05 0.10 0.15 0.20 0.25 0.30 0.35 040 0.45 0.50Gallons of Strip per Pound of Gel
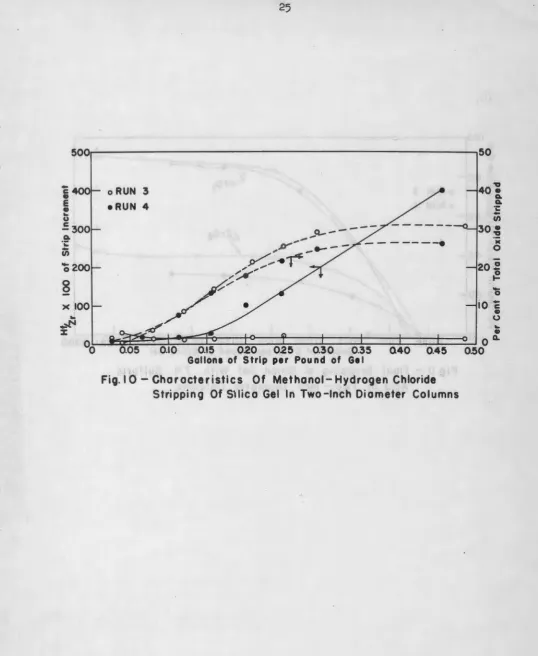
Fig. I 0 - Characteristics Of Methanol- Hydrogen Chloride
[image:27.562.10.549.34.691.2]...
Gla..
1001~---~
oRUN 3
[image:28.560.13.550.25.685.2]• RUN 4
,n---~100
-
.,
c E.,
...
u c 120 -80 a. ·;: -(/)-
0 0 2400 Xo RUN 3
• RUN 4
---·
~~--~~- -0-,.JJ
Al'~p:_-
---
----o---Q"---" ....
"' "'
,/,-r:-/ ,, t
/~.,
/~
/ /"'
"t 1~1//
t/ I~~ 0
/o
I
I
75
.,
G a. a. -.:::
-(/) G 50~ >(0 ·
0~----~~~;---~~---~~---~~~---~ 0 0.05 0.10 0.1 0.20 0.25
[image:29.564.13.555.22.694.2]Gallons of Strip per Pound of Silica Gel
Fig. 12- Characteristics of The Sulfuric Acid Stripping
does have some stripping action, and that the per cent of adsorbed oxide removed depends on the ratio of hafnium to zirconium on the gel. This latter follows since stronger
acid solutions are needed to strip adsorbed oxides containing
higher hafnium percentages.
Co:ncerning Run 2, the Hf/Zr X 100 value for its adsorbed
oxide was approximately 50 per cent greater than for Run 1. Run 2 was designed to determine the effect of completely
dissipating the activity of the silica gel. The values of Hf/Zr X 100 of the column effluent near the end of the run as shown in Table 1 indicate that the gel was no longer capable of removing hafnium from the feed. Such saturation
of the gel increased the Hf/Zr X 100 value of the adsorbed
oxide about 50 per cent.
'l'he curves of Figure 5 show the characteristics of the methanol-hydrogen chloride stripping of the gel. Although the strip solution removed approximately the same percentage of the total adsorbed oxide from each of the gels, the
Hf/Zr X 100 values of the adsorbed oxide for Runs l and 2 were, respectively,
24.9
and37.
These figures indicate thatthere was much more hafni.u.m availa.bl·3 to be stripped in Run 22 and so the higher Hf/Zr X 100 values of the strip
incre-ments would be expected. Gra.phically, it would appear that the oxide was more easily removed in Run 2, This is only apparent. Since theY'~; was less oxide to be removed in Run
2s a given volume of strip removed a larger percentage of it ao compared to Run l o
Figure 6 shows that the rate of removal of oxide by seven normal sulfuric acid was quite similar for the two runs. The initial similarity of rates of stripping of zir-coniu:n and hafnium oxides was due to some holdback in the column of methanol-hydrogen chloride Elolution which diluted. the firRt sulfuric acid strip with a high weight per cent zir-conium increment.
Figure
7
relates the characteristics of the sulfuricacid stripping of the silica gel. One notes that there is wide divergence between the i~urves representing Hf/Zr X 100
values for cor:eespondi.ng Btrip :l..ncrernents of the two runs. Recalling that the Hf/Zr X 100 value of the oxide on the gel was 50 per cent higher in Run 2, ::t t would seem probable that
the strlp increments for this run would have consistently
higher Hf/Zr X 100 values than in Run 1.
'l'wo-1nch diameter column runs. Figur·e 8 shows that the adsorption separation of' hafnium and zirconium in two-inch
diameter column to be a linear function of the amount of
curve for Run
4
may be due to a change in type of adsorptionji.e., from selective adsorption when gel surface is
avail-able, to exchange adsorption when hafnium replaces adsorbed
zirconium.
Run 4 was made to determine the effect on adsorption of
doubling the concentration of the feed. The feed for Run 3
contained approximately
12.4
weight per cent of mixed hafniumand zirconium tetrachloride in methanol, whereas Run 4 was
made with an approximately
23.4
per cent solution. Table3
shows that the oxide adsorbed in terms of grams of oxide per
gram of gel for- Runs 3 and 4 were 0.1150 and 0.0850,
respectively. The corresponding Hf/Zr X 100 values on the
gel were
117
and35J+
.
'rhese results indicate that doublingthe concentration of the feed solution had the effect of
in-creasing the weight per cent of hafnium oxide on the gel
markedly. This result is even more pronounced when one
re-calls that the Hf/Zr X 100 value of the feed to Run 3 was
approximately two and one-half times that of the feed for
Run 4.
Figure
9
compares the methanol-hydrogen chloridestrip-ping of the gel used in Runs 3 and
i+.
'I'he strip solutionremoved 15 per cent more zi!•conium oxide in Run 4, but only
5 per cent more hafnium oxide. These figures show that as
the Hf'/Zr X 100 value of the adsorbed oxide increases, the
strip solution becomes more selective for zirconium.
Tb.e one outstanding point concerning Figure 10 is the
position of the curve for Run
4
representing th~ Hf/Zr X 100values of the successive strip increments. It is completely
out of proportion compared. to the corresponding curve for
Run
3.
This deviation was possibly due to the higher weightpercentage of hafnium on the gel in Run
4.
Figure ll shows the final stripping of the two-inch
columns. Comparing this graph with Figure 6 shows that more
of the hafnium is stripped out by the sulfuric strip in the
two-inch columns. 'I'his is due to the higher per cent of
hafnium on the gel after adsorption. In Run 3 the per cent
of zirconiu1:1 stripped by the sulfm."'ic acld is higher than in
Run
4
because of the l ower per cent of hafnium on the gelafter adzorption.
In Figure
12,
the form of the curves are similar. Ofinterest is the hump near the end of each of the curves
rep-resenting Hf/Zr X 100 values versus quantity of strip for
each of the runs. Sinee the same type curve was obtained for
Runs 3 and 4J one might conclude that this hump is a definite
characteristic of the sulfur•ic acid stripping of gels which
have been used in high v.reight per cent hafnium feed
Chlorinator. The purpose of the chlorinator was to
con-vert mixed zirconium and hafnium oxides, obtained by
precipi-tating and igniting certain sulfuric acid strip increments,
to the tetrachlorides to be used as feed material for
sub-sequent adsorption runs.
Originally, helium was used to carry carbon tetrachloride
through the hot oxide bed where the conversion took place. It was later found that by heatlng the carbon tetrachloride,
enough vapor pressure could be created to eliminate the need
of helium as a ca.rrying agent. However, one of the principal advantages of using some helium was the ease with which bed density could be controlled. The oxide bed was maintained in a slightly fluidlzed condition to effect faster conversion.
The carbon tetrachloride was also heated in order to increase its mol fraction in the vapors entering the oxide bed and
thus keep the amount of helium used at n minimum.
Because of breakdowns and modifications made during the
various rw1s in the converter, no close control test was
made. However, estimated efficiencies of conversion ran
around
80
per cent.Recommendations
Based on an analysis of the data and results obtained in
this investigation the following recommendations are made:
1. A study should be made to determine the extent to
which pure methanol will strip s i l ica gel loaded
with adsorbate of va.:i."ious weight ratios of hafnium
to zirconium.
2. A study should be made to determine the gel loading
possible using more concentrated feed solutions, in terms of total oxide in solution.
3. The activation of silica gel should be carefully
standardized to obtain re;;.n·oducibili ty of results.
4.
After concentration to 90 wt%
hafnium oxide, i t ispossible that a zirconium-selective absorbent may
be found, that will allow production of pure hafnium.
5. An integrated proceos for the-production of both
pure hafnium and zirconium would lower the cost of
production of pure zirconium, by minimizing material
losses and affording by-product production of
V. CONCLUSIONS
Four experimental runs were made with a view to
develop-ing a method of producing high hafnium concentrates. Each of
these runs consisted of the adsorption of hafnium and
zir-conium tetrachlorides (or complexes) by silica gel from
methanol solution, and the subsequent differential stripping
of the gel using a methanol-hydrogen chloride strip solution
and a final sulfuric acid strip solution.
Based on the data obtained, the following conclusions
are made:
l. One principal step in which hafnium enrichment can
be obtained is by selective adsorption of hafnium
on silica gel from a methanol solution of
tetra-chloride. ~
2. Further hafnlum enrichment can be achieved in a
second principal step involving differential
strip-ping of the silica gel with methanol-hydrogen
chloride solution, followed by a sulfuric acid
solution.
3
.
Using the product from one enrichment cycle as thefeed material for a second cycle permits
enrich-ments in excess of 90 wt
%
hafnium oxide from thenaturally occurring 2 wt
%
hafnium oxide in twoprocess cycles.
4.
Contacting silica gel with feed solution until itsactivity is completely dissipated loads the gel
with 7 - 8
%
oxides by weight, with a high weightratio of hafnium to zirconium.
5.
The importance of using concentrated feed to obtainhigh hafnium loadings on the gel was demonstrated.
VI. BIBLIOGRAPHY
l. Arend, A. G., Chern. Products 11, 30-2 (1948).
2. Arkel, A. E. van, und. J. H. DeBoer, Z. anorg. allgem.
Chern. 141, 289-96 (1924).
3. Bardet,
J.
and C. Toussaint, Compt. rend. 180, 1936-8( 1925) .
255, 79-100 (1947).
6.
Fischer, Werner, Walter Chalybaeus und Maria Zumbusch,Z. anorg. Chern. 255, 277-86 (1949).
7. Gruen, D. M. and J. J. Katz, J. Am. Chern. Soc. 71,
3843-4 (1949).
8.
Hansen,.Robert S. and Keith Gunnar, J. Am. Chern. Soc.71, 4158 (1949).
9.
Hansen, RobertS., Keith Gunnar, Alfred Jacobs, andC. Robert Simmons, J. Am. Chern. Soc. 72, 5043-5
( 1950).
-10. Hevesy, Georg von, Chern. Reviews 2, 1-41 ( 1925) .
11. Hevesy, Georg von and V. T. Jantzen, Chern. News 127,
353-5 ( 1923) .
12. Hevesy, Georg von und.,E. Madsen,
z.
apgew. Chern. 38,228-30 (1925).
13. Huffman, E. H. and L. J. BeaufaitJ J. Am. Chern. Soc.
71, 3179-82 ( 1949) .
14. Huffman, E. H. and R.
c.
Lilly, J . Am. Chern. Soc. 71,4147 (1949) .
15. Larsen, E. M., W. C. Fernelius and L. L. Quill, Ind..
Eng. Chern., Anal. Ed. 15, 512-15 (1943).
16. Naamlooze Ven,nootschap Philips' Gloeilampenfabrieken,
British Patent 221,802~ Sept. 15, 1923.
17. Prandtl, Wilhelm, Z. anorg. allgem. Chern. 208, 420-6
( 1932) .
18. Prandtl, Wilhelm, U. S. Patent 1,976,293, Oct. 9, 1934.
19. Rich, Malcom N., U. S. Patent 1,856,264, May 3, 1932.
20. Schumb, Walter C. and. Frank E. Pittman, Ind. Eng. Chern.
Anal. Ed. 14, 512·-15 (1942).
21. Street, Kenneth, Jr. and G. T. Seaborg, J. Am. Chern.
Soc. 70, 4268-9 (1948) .
22. Willard, Hobart H. and Harry Freund, Ind.. Eng. Chern.,
VII. ACKNOWLEDGEMENTS
The authors wish to express gratitude to Mr. Olaf A. Runquist and Mr. Wendell Van Horn of the spectrographic