Abstract:.Retinal exudates considered as a symptom of Diabetic retinopathy(DR) is one of most significant reason for visual deficiency. This paper focusses on early detection of hard exudates and to diagnose DR. Binary operations based exudate detection and SVM based hard exudate classification is discussed in this study. The RGB channel of fundus image is converted to HSI colour space for improved noise suppression and optic disc is eliminated preservinsg the blood vessels. In the final stage, hard exudates are classified using SVM classification. In order to evaluate the proposed approach, experiment tests are carried out on different set of images and the results are verified. The results are promising and suggest that the proposed method could be a diagnostic aid for ophthalmologists in the screening of DR.
Index Terms: Retinal exudate detection, CLAHE, Morphological processing, Optic disc elimination, SVM classification.
I. INTRODUCTION
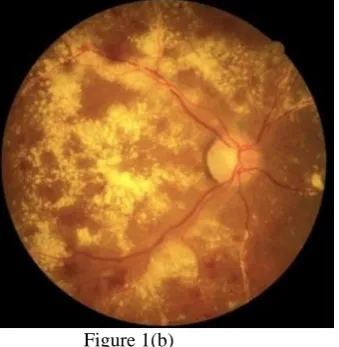
The occurrence of Diabetic Retinopathy(DR) caused by Diabetic Mellitus(DM) which forms the main reason of visual impairment, can be decelerated by early detection. Automatic screening systems help in identifying the early indications of DR such as exudates, drusens, hemorrhages, occlusions etc. Detection of exudates, which occur due to spillage of lipids from blood vessels in the retina that looks like yellow shades forms the area of study in this paper. Figure 1 shows the fundus image of a normal retina and retina with exudates.
An initial good pre-processing of the retinal images is essential for subsequent detection of exudates. The method proposed in [1] uses the same contrast enhancement algorithm, CLAHE that we used for pre-processing. A four step strategy was proposed by Elbalaoui et. al[2].The algorithm includes shifting the colour correction, Optic disc (OD) elimination, exudates segmentation and finally separation of exudates from the background. An irregular segmentation technique making use of a high level entity called splat is proposed in [3]. In this algorithm, pixels having similar spatial and structural features are grouped into splats and their features are extracted to detect the retinal hemorrhage.Computer assisted recognition using Migrating Bird Optimisation and Support Vector Machine (MB-SVM) classifiers has been proposed in [4]. The algorithm used in [5]
Revised Manuscript Received on July 05, 2019
Arun Pradeep, Department of Electronics and Communication Engineering, Noorul Islam University, Kanyakumari, Tamil Nadu, India.
X Felix Joseph, Department of Electrical and Electronics Engineering, NICHE &Bulehora University,Ethiopia.
separates the fundus region from background using adaptive thresholding and morphological operation.
Figure 1(a)
Figure 1a. Normal Retinal Fundus Image
Figure 1(b)
Figure 1b. Fundus image of Retina affected with exudates
A remote examination of exudates by detection of macular oedema is proposed in [6]. Hard exudate detection that involves SVM classification, one which is utilized in our work is studied in [7].A method for segmentation of optic disc using Hough transform and masking the same is studied in this algorithm. The method proposed by Zhou et.al[8] segments the entire image into a series of super pixels considered as candidates. Multi-channel intensity features and contextual feature, is used for characterizing each candidate. Vessel detection and segmentation by in-painting exudates using a neighbourhood estimator was presented in [9]. A voxel classification based
approach using a
layer-dependent stratified sampling strategyon OCT
Retinal Exudates Detection Using Binary
Operation and Hard Exudates Classification
Using Support Vector Machine
[image:1.595.355.531.213.399.2] [image:1.595.362.532.425.599.2]image was introduced in [10]. Automatic segmentation of exudates by candidate extraction using grayscale morphology is presented in [11]. Here the proper shape of candidate pixels is determined by a Markovian segmentation model. A partial least squares (PLS) based classification to perform exudate detection is presented in [12]. Fuzzy logic based classification of Hard and soft exudates is presented in[13]. The proposed algorithm has two steps- one to detect exudates using mathematical morphology and second to classify as hard and soft exudates using fuzzy logic. Curvelet transform based automatic detection of exudates and optic disc is presented in [14]. Bright lesions enhancement in the green plane of retinal image to normalize the illumination around optic disc is the algorithm used in this method. A set of optimally adjusted morphological operators for exudate recognition on diabetic retinopathy patients’ was proposed by Sopharak et.al.[15].
II. METHODOLOGY
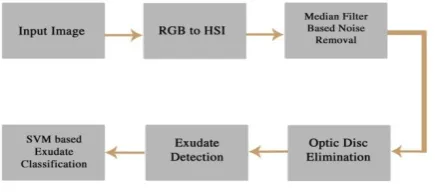
The paper explains an algorithm which associates both the principle of binary operation and classification for detection and extraction of hard exudates from the given retinal image. The mathematical binary operation is performed to identify the exudates after initial pre-processing and optic disc elimination. The algorithm is depicted in Figure 2.
The pre-processing step involves colour space transition of the original RGB fundus image to HSI image. The intensity band contains noise which is removed by applying median filter over the intensity band of the entire image. In order to enhance the contrast of the noise removed image, Contrast limited Adaptive Histogram equalization (CLAHE) is performed[16]. This method is different from other histogram equalization methods or Gaussian function based methods, as CLAHE prevents saturation in similar areas of the image. Figure 3 depicts the pre-processing steps involved in our work. Since the optic disc and exudates share similar intensity characteristics, the RGB colour image is converted to HSI image space before further processing. This conversion is a direct technique and does involve a conversion of RGB to grayscale. Certain imperfections are present in binary images. Using threshold values, binary regions are produced but are biased to texture and noise in the image. So binary operation performed in the HSI image can reduce the effect of these imperfections[17]
[image:2.595.321.539.58.193.2]In the next step, the optic disc is removed by assuming that the optic disc exists as the largest component with circular shape in the fundus image. In the second and final process, the exudates are classified as soft exudates and hard exudates using an SVM classifier. The data set is validated using clinical images and images from publically available database.
[image:2.595.65.283.657.753.2]Figure 2- Proposed Algorithm
Figure 3: Pre-processing steps involved
A. Optic Disc Elimination
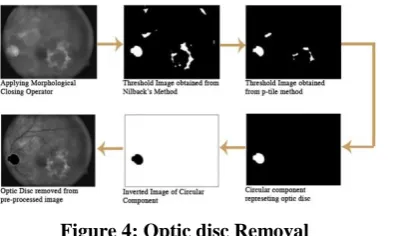
The morphological operations such as closing, opening and erosion that helps to detect the optic discare usedin thiswork. At first, closing operation is applied in order to get the structure of the disc from the input Image I. The closing operation is followed by a threshold method to get the binary image. The output of the threshold is an image that comprises of various connected regions such as and it can be represented as:
(1)
Where, changes from is the total number of components connected in the image.
When compared with the background, the components have more pixels and has a circular shape structure which belongs to in which the optic disc is also included. Thus the components that includes the optic disc are separated effectively from other structures of . Here, forms the biggest region based component which is included in . The compactness of can be measured using the formula as:
(2)
Where, represents the number of pixels in the region and is the pixels out of the region . The threshold method to get the binary image is deduced from the proven method such as P-tile method [18] and Nilback’s method[19][20] . The largest connected component is assumed to be the optic disc. Using Nilback’s method and p-tile method, the highest value of compactness is delivered for the optic disc.
Figure 4: Optic disc Removal
B. Detection of Exudates
Optic disc elimination is followed by identification of exudate pixels and extraction of hard exudates from it. The direct detection of exudates is accomplished by binary closing operation having a structuring element that has a flat disc shape having 16-pixel radius, where 16 is chosen arbitrarily. Following the threshold operation, a closing operation is applied. This contrast component for this operation is same as for the blood vessels. So, the standard deviation of the image has to be computed. The standard deviation is computed using the equation.
(3)
Where, W(x) represents the pixels available in the sub-window, represents the total number of pixels in W(x) and represents the mean value of the image and represents the local contrast image.
The components can be differentiated using a triangle thresholding method [21]and the very bright regions are detected. After detection of these bright pixels, unwanted regions are removed by dilation operation applied on the image obtained after threshold operation.
[image:3.595.298.544.56.322.2]Subsequently, a flood filling operation is performed on the holes in order to reconstruct the image from the binary operation. The last step in detection of exudates is to take the difference image between the output image and threshold image, i.e. intensity based image. The result of the difference between the images is superimposed in the real RGB image for extracting the exudate features. Finally, the difference image is taken between the output image and the intensity based original image (which is obtained from thresholding). The result of this threshold image is super-imposed on the real RGB image for extracting the exudates. The exudate detection performed is depicted in Figure 5.
Figure 5: Detection of Exudates
Table I
Feature Number
Feature Name
Description
f1
f2 f3, f4, f5
f6 f7
f8
Mean Channel Green Intensity Gray Intensity Mean hue, mean saturation and mean intensity in HSI colour model. Energy Standard Deviation Mean Gradient Magnitude
Mean filter of size 3 x 3 was applied to the green channel image to indicate gray scale intensity for every pixel. Gray scale value for each pixel. Mean filter of size 3 x 3 respectively, applied to the three channel image
. Exudates occur as bright
lesions on the surface of retina hence the information about saturation and brightness (f4 and f5) is important. Summation of pixel value intensity squares.
Morphological opening operation was applied to the image to preserve foreground regions that shares similar characteristics to the structuring element.
Magnitude of directional change in intensity of edge pixels.
C. Hard Exudate Classification Using SVM
Classification.
(4)
Another entity forms the category flag and is denoted as
(5)
where , represents the sample vector set dimension. A and B represents hard exudate and non-hard exudate regions respectively.
The training sample set ( , was fed as input to train the SVM classifier. In this work = 6800 i.e. 6800 pixels from the 51 training images were selected by an expert operator.
III. EVALUATIONONDIARETDB1DATABASE
In this research work, a hybrid cross-validation method is used. The database exudate subset and the ground truth exudate subset we can write as follows.
A pixel is considered true positive(TP) if
(6)
The value of ranges from 0 to 1 and it is being arbitrarily chosen as 0.2 in this work.
Likewise, a pixel is considered as a false positive (FP) if
[image:4.595.86.525.294.757.2]
(7)
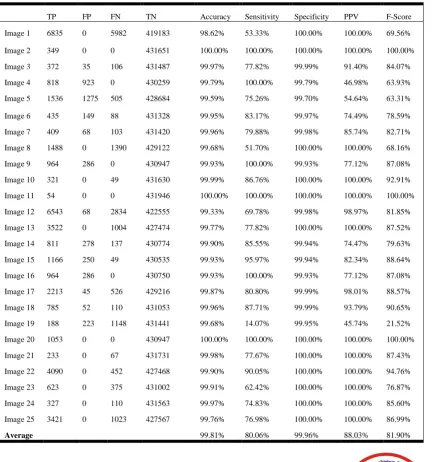
Table II: Performance Validation of Algorithm on Images
TP FP FN TN Accuracy Sensitivity Specificity PPV F-Score Image 1 6835 0 5982 419183 98.62% 53.33% 100.00% 100.00% 69.56% Image 2 349 0 0 431651 100.00% 100.00% 100.00% 100.00% 100.00% Image 3 372 35 106 431487 99.97% 77.82% 99.99% 91.40% 84.07% Image 4 818 923 0 430259 99.79% 100.00% 99.79% 46.98% 63.93% Image 5 1536 1275 505 428684 99.59% 75.26% 99.70% 54.64% 63.31% Image 6 435 149 88 431328 99.95% 83.17% 99.97% 74.49% 78.59% Image 7 409 68 103 431420 99.96% 79.88% 99.98% 85.74% 82.71% Image 8 1488 0 1390 429122 99.68% 51.70% 100.00% 100.00% 68.16% Image 9 964 286 0 430947 99.93% 100.00% 99.93% 77.12% 87.08% Image 10 321 0 49 431630 99.99% 86.76% 100.00% 100.00% 92.91% Image 11 54 0 0 431946 100.00% 100.00% 100.00% 100.00% 100.00% Image 12 6543 68 2834 422555 99.33% 69.78% 99.98% 98.97% 81.85% Image 13 3522 0 1004 427474 99.77% 77.82% 100.00% 100.00% 87.52% Image 14 811 278 137 430774 99.90% 85.55% 99.94% 74.47% 79.63% Image 15 1166 250 49 430535 99.93% 95.97% 99.94% 82.34% 88.64% Image 16 964 286 0 430750 99.93% 100.00% 99.93% 77.12% 87.08% Image 17 2213 45 526 429216 99.87% 80.80% 99.99% 98.01% 88.57% Image 18 785 52 110 431053 99.96% 87.71% 99.99% 93.79% 90.65% Image 19 188 223 1148 431441 99.68% 14.07% 99.95% 45.74% 21.52% Image 20 1053 0 0 430947 100.00% 100.00% 100.00% 100.00% 100.00% Image 21 233 0 67 431731 99.98% 77.67% 100.00% 100.00% 87.43% Image 22 4090 0 452 427468 99.90% 90.05% 100.00% 100.00% 94.76% Image 23 623 0 375 431002 99.91% 62.42% 100.00% 100.00% 76.87% Image 24 327 0 110 431563 99.97% 74.83% 100.00% 100.00% 85.60% Image 25 3421 0 1023 427567 99.76% 76.98% 100.00% 100.00% 86.99%
and the pixel is a false negative (FN) if :
(8)
Now the pixels that remains are considered as true negatives (TN).
IV. RESULTSANDDISCUSSIONS
The fundus images were acquired from two sources. Clinical images were obtained from Dr.Bhejan Singh’s eye hospital. The clinical image was captured using a “Remidio Non-Mydriatic Fundus On Phone (FOP-NM10)” [25]Camera with FOV 40, working distance of 33mm and an ISO range from ISO 100 to 400. The images used for validation was acquired from the publically available database DIARETDB1(http://www.it.lut.fi/project/imageret/diaretdb1
/index.html).
Since there is an asymmetry between the classes of TP, FN and FP when compared with TN, by computing just the Receiver operator characteristic AUC (Area under curve) is not sufficient. So 5 different evaluation parameters are taken into consideration. They are:
(9)
[image:5.595.326.526.63.259.2]The precision or PPV combined with TP and FP denotes the ratio of detected exudate pixels with the number of pixels labelled by the expert.
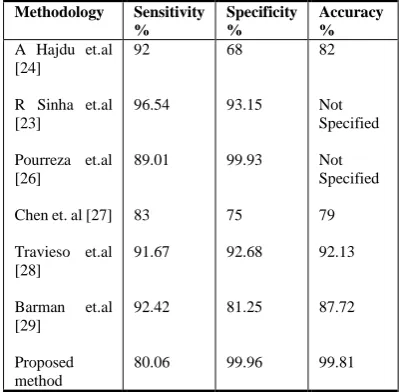
Table II shows the results for a minority of the image that was validated using the algorithm. In 25 images that were validated an average sensitivity, specificity and accuracy of 80%,99% and 99% respectively were obtained. Also the precision and f-score was comparatively higher than other algorithms in literature[26][27] which is 88.03% and 81.90 % respectively. Table III gives a comparison with other published algorithms and it indicates that the specificity and accuracy of our method is truly higher than others.
V. CONCLUSION
[image:5.595.65.266.343.510.2]This work proposes an efficient technique to detect exudates by employing binary operations and categorize the exudates as hard exudates by using SVM Classification. The strength of the classifier is the ability to determine whether the exudate pixel is hard or not, individually.
Table III: Comparison with existing Algorithms
Methodology Sensitivity %
Specificity %
Accuracy %
A Hajdu et.al [24]
R Sinha et.al [23]
Pourreza et.al [26]
Chen et. al [27] Travieso et.al [28]
Barman et.al [29] Proposed method 92 96.54 89.01 83 91.67 92.42 80.06 68 93.15 99.93 75 92.68 81.25 99.96 82 Not Specified Not Specified 79 92.13 87.72 99.81
Since the sensitivity is comparatively low with other methods in the literature, there needs improvisation of the algorithm for low intensity value pixels.
REFERENCES
1. K. Wisaeng and W. Sa-Ngiamvibool, “Exudates Detection Using Morphology Mean Shift Algorithm in Retinal Images,” IEEE Access, vol. 7, no. c, pp. 11946–11958, 2019.
2. A. Elbalaoui and M. Fakir, “Exudates detection in fundus images using mean-shift segmentation and adaptive thresholding,” Comput. Methods Biomech. Biomed. Eng. Imaging Vis., vol. 7, no. 2, pp. 145–153, Mar. 2019.
3. K. A. Sreeja and S. S. Kumar, “Comparison of Classifier Strength for Detection of Retinal Hemorrhages,” Int. J. Innov. Technol. Explor. Eng., vol. 8, no. 6S3, pp. 688–693, 2019.
4. R. Badgujar and P. Deore, “MBO-SVM-based exudate classification in fundus retinal images of diabetic patients,” Comput. Methods Biomech. Biomed. Eng. Imaging Vis., vol. 7, no. 2, pp. 195–206, Mar. 2019.
5. A. M. Syed, M. U. Akram, T. Akram, M. Muzammal, S. Khalid, and M. A. Khan, “Fundus images-based detection and grading of macular edema using robust macula localization,” IEEE Access, 2018. 6. U. Punniyamoorthy and I. Pushpam, “Remote examination of
exudates-impact of macular oedema,” Healthc. Technol. Lett., vol. 5, no. 4, pp. 118–123, Aug. 2018.
7. S. Long, X. Huang, Z. Chen, S. Pardhan, and D. Zheng, “Automatic Detection of Hard Exudates in Color Retinal Images Using Dynamic Threshold and SVM Classification: Algorithm Development and Evaluation,” Biomed Res. Int., vol. 2019, pp. 1–13, Jan. 2019. 8. W. Zhou, C. Wu, Y. Yi, and W. Du, “Automatic Detection of Exudates
in Digital Color Fundus Images Using Superpixel Multi-Feature Classification,” IEEE Access, vol. 5, pp. 17077–17088, 2017. 9. R. Annunziata, A. Garzelli, L. Ballerini, A. Mecocci, and E. Trucco,
“Leveraging Multiscale Hessian-Based Enhancement With a Novel Exudate Inpainting Technique for Retinal Vessel Segmentation,” IEEE J. Biomed. Heal. Informatics, vol. 20, no. 4, pp. 1129–1138, Jul. 2016. 10.X. Xu, K. Lee, L. Zhang, M. Sonka, and M. D. Abramoff, “Stratified Sampling Voxel Classification for Segmentation of Intraretinal and Subretinal Fluid in Longitudinal Clinical OCT Data,” IEEE Trans. Med. Imaging, vol. 34, no. 7, pp. 1616–1623, Jul. 2015.
11.B. Harangi and A. Hajdu, “Detection of exudates in fundus images using a Markovian segmentation model,” in 2014 36th Annual International Conference of the IEEE Engineering in Medicine and Biology Society, 2014, vol. 2014, pp. 130–133.
12.C. Agurto et al., “A Multiscale Optimization Approach to Detect Exudates in the Macula,” IEEE J. Biomed. Heal. Informatics, vol. 18, no. 4, pp. 1328–1336, Jul. 2014.
14.M. Esmaeili, H. Rabbani, A. M. Dehnavi, and A. Dehghani, “Automatic detection of exudates and optic disk in retinal images using curvelet transform,” IET Image Process., vol. 6, no. 7, p. 1005, 2012. 15.A. Sopharak, B. Uyyanonvara, S. Barman, and T. H. Williamson,
“Automatic detection of diabetic retinopathy exudates from non-dilated retinal images using mathematical morphology methods,” Comput. Med. Imaging Graph., vol. 32, no. 8, pp. 720–727, Dec. 2008. 16.Z. Wei, W. Jun, H. Lidong, and S. Zebin, “Combination of contrast limited adaptive histogram equalisation and discrete wavelet transform for image enhancement,” IET Image Process., vol. 9, no. 10, pp. 908–915, Oct. 2015.
17.S. Arpit and M. Singh, “Speckle Noise Removal and Edge Detection Using Mathematical Morphology,” 2011.
18.M. Taghizadeh and M. R. Mahzoun, “Bidirectional Image Thresholding Algorithm Using Combined Edge Detection And P-tile Algorithms,” J. Math. Comput. Sci., vol. 02, no. 02, pp. 255–261, Feb. 2011.
19.M. S. H. Naveed Bin Rais, “Adaptive thresholding technique for document image analysis,” in 8th International Multitopic Conference, 2004. Proceedings of INMIC 2004., pp. 61–66.
20.G. Leedham, Chen Yan, K. Takru, Joie Hadi Nata Tan, and Li Mian, “Comparison of some thresholding algorithms for text/background segmentation in difficult document images,” in Seventh International Conference on Document Analysis and Recognition, 2003. Proceedings., vol. 1, pp. 859–864.
21.M. Baisantry, D. S. Negi, and O. P. Manocha, “Change vector analysis using enhanced PCA and inverse triangular function-based thresholding,” Def. Sci. J., 2012.
22.M. U. Akram, A. Tariq, S. A. Khan, and M. Y. Javed, “Automated detection of exudates and macula for grading of diabetic macular edema,” Comput. Methods Programs Biomed., vol. 114, no. 2, pp. 141–152, Apr. 2014.
23.M. Haloi, S. Dandapat, and R. Sinha, “A Gaussian Scale Space Approach For Exudates Detection, Classification And Severity Prediction,” May 2015.
24.B. Harangi and A. Hajdu, “Automatic exudate detection by fusing multiple active contours and regionwise classification,” Comput. Biol. Med., vol. 54, pp. 156–171, Nov. 2014.
25.“Remidio Non-Mydriatic Fundus On Phone (FOP-NM10).” 26.sE. Imani and H.-R. Pourreza, “A novel method for retinal exudate
segmentation using signal separation algorithm,” Comput. Methods Programs Biomed., vol. 133, pp. 195–205, Sep. 2016.
27.Q. Liu, J. Chen, W. Ke, K. Yue, Z. Chen, and G. Zhao, “A location-to-segmentation strategy for automatic exudate segmentation in colour retinal fundus images,” Comput. Med. Imaging Graph., vol. 55, pp. 78–86, Jan. 2017.
28.R. S. Rekhi, A. Issac, M. K. Dutta, and C. M. Travieso, “Automated classification of exudates from digital fundus images,” in 2017 International Conference and Workshop on Bioinspired Intelligence (IWOBI), 2017, pp. 1–6.