Abstract: Oil spills are carrying out by the marine echo system and these are originated from scientific and political concern since they are seriously affecting the coastal echo system and fragile marine. Oil spills can be detected from the satellite images with more potential by covering the larger areas. While getting satellite images they cover very limited area and require large aperture antennas. But with small aperture and large captured areas Synthetic Aperture Radar (SAR) descriptions are extensively worn in favor of oil spill discovery. In SAR image the oil spill regions can be detected with oil film backscattering. In this process dark patches are formed which are affecting the detection correctness of oil spills. In this occupation oil drop regions are detecting using dual threshold segmentation. In dual threshold segmentation image is partitioned based on histogram analysis. The proposed method illustrates the helpfulness of technique in noticing plus classifying the oil spills.
Index Terms: Synthetic-Aperture-Radar(S/A/R), oil spills, thresholding, segmentation
I. INTRODUCTION
Marine oil spills are basically reasons by the misfortunes such as drilling platform accidents, ship collisions, oil pipe line cracking and deliberate discharges [1]. It has one of the significant concerns of environmental things [2]. Now there are quite a lot of techniques on behalf of monitoring oil spills which comprise air surveillance, ship pathway as well as satellite distant sensing [3]. Among all these satellites remote intelligence has large reporting variety, which is most appropriate in support of large size maritime ministering[4]. At present SAR is the popular one and it has all weather observation capability [5][6].
To capture the reflecting signals from the targets, an active sensor SAR is used. By wind and short gravity, the oil spills suppressing the back scattering of sea with damping the capillary waves stimulation, by this observation of the dark regions on the image can possible. However mostly the SAR images suffers from speckle sound which disgrace theexcellent particulars along with edges description and restrictions the difference declaration. A lot of work that would be done on segmentation of dark regions that represents the oil spills from sea background. A lot of threshold
algorithms [7] [8] are used for this segmentation. Solberg et al. [9] introduce that the threshold is to be n and it is beneath the mean charge of the affecting window. Li et al. has used the space density approach for separate the dim spots also
Revised Manuscript Received on June 05, 2019
B. Malakonda Reddy, Department of Electronics and Communication Engineering, Koneru Lakshmaiah Education Foundation, Vaddeswaram, Guntur-522502, Andhra Pradesh, India.
Md Zia Ur Rahman, Department of Electronics and Communication Engineering, Koneru Lakshmaiah Education Foundation, Vaddeswaram, Guntur-522502, Andhra Pradesh, India.
background [10]. Migliaccio et al. implements the spill detection process over SAR image supported on physical model [11]. Huang et al. carried out the level set methods for oil spill detection. However, these level set methods are performing well for detection of oil spills these are time consuming process [12]. Li et al. made up a representation based on hydrodynamic reproduction to observe the oil spill from a moving point. Tang et.al. [13] investigated the consequence of oil spills on ecological scheme. So automatic and semi- automatic techniques are needed to detect the oil spills [14] [15]. Del Frate et al. introduced the semi-routine methods intended for oil spill discovery [16]. A neural network is the robust tool for oil spill discovery. Topouzelis et al. also stated regarding dark arrangement detection as well as oil spill organization using neural network. [17]. The three algorithms in favor of classification of oil spills including neural network, post supervised classification and co-occurrence textures proposed by the Hashim et.al. [18] even the neural networks having the advantages in oil spill monitoring these are time consuming. Chakraborty et al. [19] introduces the semi supervised SVM for rectifying the problem of classification of pixels in remote sensing images. The main goal of segmentation is extract out all the area of oil spill. Dark spot detection and segmentation generally done by threshold methods [20]. K-means algorithm [21] is a process of cluster investigation which performs divider with n explanations hooked on k clusters in which every observation feels right to the group which is having the adjoining mean.
Fuzzy C-Means algorithm [22] [23] (FCM algorithm) is used to perform the segmentation in SAR image. This method is simple and standard deviation and mean valuesare obtained from DN value (Digital Number or Data Number or Brightness Value) of image. Threshold value is also obtained from histogram of DN values.
In this paper another oil slick perceived calculation has proposed. In the discovery of dim spots, in general limit is normally utilized because of its comfort and high proficiency. Be that as it may, in SAR pictures, at whatever point the grayscale scope of oil slick and ocean foundation dependably has a convergence, with one in general limit in the division, it is beyond the realm of imagination to expect to stifle the impedance of spot commotion from ocean foundation and there is an opportunity to misfortune a few subtleties of dull district. Double limit calculation is utilized to bring down the bogus caution rate while dealing with the limit of oil slick to substantial degree.
II. PROGRESS OF THE PROPOSED METHOD
Analysis of SAR Images using New Image
Classification Methods
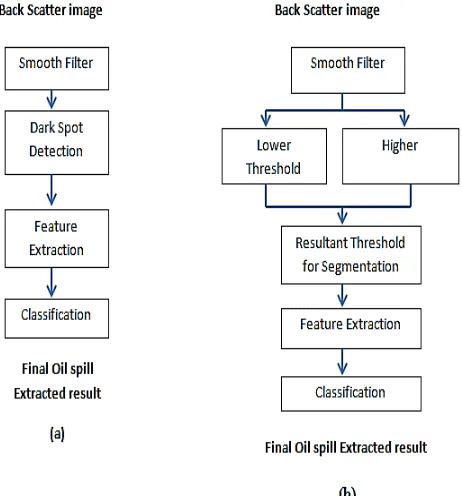
The processing steps for existing and proposed dual threshold algorithms are shown in Fig.1. The images are initially processed with low pass filter to decrease the meddling of the speckle sound and the segmentation of oil spills is performed by final threshold which is determined from two thresholds. The two thresholds which are the lower and higher achieved with the help of semi-automated and fuzzy logics respectively. With dual threshold the false alarm rate will be reduced effectively and the oil spills regions extracting fine details.
Figure 1: Flow diagram for (a). Traditional method and (b). Proposed method
Here the segmentation is comprising in three steps. Initially segmented using global thresholding is utilized. The next step is segmenting its gradient image by global threshold method. Third division is uniting the primary as well as subsequent step for last segmentation of image.
In the new proposed process of segmentation, the initial step is computing the threshold value from original image. A new threshold technique is projected in this manuscript to make better segmentation based on previous study [25]. Original image histogram is calculated and transforms it to Fourier space. The main term of Fourier change contains DC esteem (The zero-recurrence coefficient, F (0, 0), is regularly called the "DC component") and second termcontains sketchiest worldwide estimations of histogram dispersion. On the off chance that the picture contains the articles and the dark sizes of their back ground are Gaussian disseminated then the second term of Fourier change is scrappy overlay of two Gaussian dispersions. The pinnacle of worldwide variety is existed between these two Gaussian conveyances. The pinnacle of this worldwide variety is distinguished naturally and it is utilized as a kind of perspective limit to make the division of unique picture. The edge estimation technique contains the accompanying advances.
is the frequency of gray scale i plus is the greatest frequency which occurs at j with in the interval [0, 255] Step 2:
Using the DFT the transform of H(n) is given by
, k= 0, 1, 2…255 (2) Step 3:
After completing the second step eliminate the all the other components other than first and second low frequency parts using following equation
(3)
Step 4:
Smooth the histogram based on,
(4)
Step 5:
Each point on has II grades. One is on gone moreover another individual is on right. These are computed by fitting a line representation through several adjacent positions on every surface. Here we choose 15 main efficient points in support of histogram choice since 0 to 255. This is mathematically can be written as,
(5)
(6)
Where
(7)
Y= (8)
The two slopes at a point n, are computed beginning Eq.(6)
Step 6:
Calculate the slope dissimilarity sd(n) at a point n
,n=15,16….240
In the slope distinction allocation, the positions can be found using the condition,
Here we get the valleys and peaks with greatest local variations. Let it would be 1 and 2. We select the lower threshold in between 1 and 2 valleys.
Step 7:
The higher value of threshold is founded from the Fuzzy entropy based multilevel thresholding optimized with differential evolution approach [33]. Finally, the resultant threshold value is emerged from
The smoothed original image I is binarized as
(a) (b) (c) (d)
(e) (f) (g) (h)
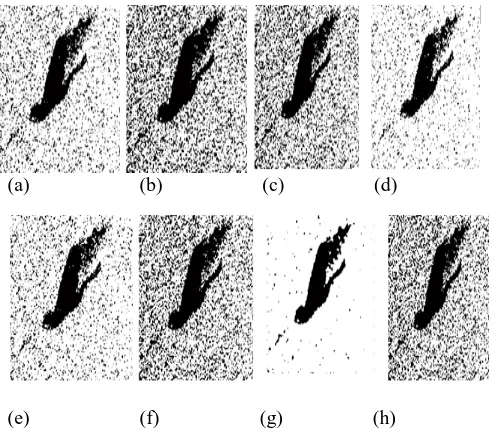
Figure 2: (a) Expectation Maximization Segmentation method(b)K means method(c) iterative selection method [22] (d) Maximum entropy method [18] (e) cross entropy method [24] (f) fuzzy c-means technique [20] (g)new fuzzy thresholding system [23] (h)Otsu technique[21]based AEP
III. RESULTSANDDISCUSSION
For these experiments, we have taken several real time images were taken from ERS-I IM (Image Mode) VV polarized image in east of Indian coastal near Krishna-Godavari Delta is to be analyzed to detect the oil spills. We initially evaluated the several residential existed methods among popular Otsu process moreover fuzzy entropy methods. Fig 2(a) represents segmented image using maximum expectation method, Fig 2(b) represents K-meansalgorithm output, in this output noise is not eliminated effectively. Fig(c) shows output of iterative selection method [26], Fig(d) shows maximum entropymethod results, Fig(e) represents cross entropy method [28] output and Fig(f) represents fuzzy c-means method [27] output in segmentation of SAR image for detecting and extraction of the dark spots of oil spill images. Disadvantage of FCM is that for noisy images, it will not consider the spatial information which makes it sensitive to noise & other image artifacts. Fig 2(g) is the new fuzzy thresholding method which makes better extraction of dark region boundary than Standard Otsu method shown in Fig 2(h). Among these new fuzzy threshold methods perform the good extraction of the oil spill dark regions from blurred images due to speckle noise.
(a) (b) (c)
Figure 3: (a) DRLS method (b) Active contours without edges (c)Localizing region based active contours.
Here the performance of extraction of regions by active contour methods [29]-[30] has shown in Fig 3. Fig. 3(a) demonstrates the DRLS-based bend development process. Since the evoked Oil spill locales are discretionary shapes which are not giving accurate shape. The Fig.3 (b) demonstrates the yield which has the shapes both with and without angle, for example protests with smooth limits or even with intermittent limits. Fig.3(c) gives the examination of neighborhood areas enables the division strategy to precisely isolate required locale from whatever is left of the district notwithstanding its slim structure and the nearness of adjacent structures of comparable intensity. As it can be seen that dynamic form techniques are stops unfortunately without spreading at the edges of dull locales and these neglects to recognize the oil slick locales in SAR picture. The pictures are should be combine before applying to dynamic form techniques as a result of expansive number of dim spots makes complex to remove the areas.
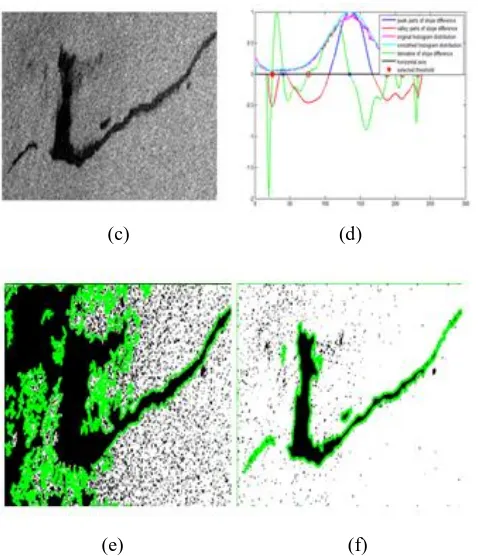
For the calculation of semi- automated limit determination process the carmine line speaks to the first histogram conveyance and green line for likelihood of smoothed histogram appropriation. Nearby pinnacles of slant distinction conveyance are spoken to with blue line which regularly more noteworthy than zero and red line demonstrates the neighborhood pinnacles of the slant contrast circulationwhich is under zeros typically invert to the more prominent. The blue cross relates to blue pinnacles and signifies thepinnacles of histogram conveyance. Valleys of histogram spoke to with red circles relates to red pinnacles. The blue bullet in Fig. 4(b)represents the lower threshold ( value which makes the segmentation as in case 3 is 25. The segmentation performed by this threshold values is shown in Fig.4(c) which is under segmentation. Majority of the oil spill dark region is not covered by this threshold value. Another threshold ( value is to be taken from mean of optimized differential evolved fuzzy parameters which is peak value of distribution function is 215.5 shown in Fig.4(d). The segmentation performed by this threshold gives the over segmentation results shown in Fig.4(e). Finally mean of these two thresholds considered as reference threshold for make segmentation which has extracted the major part of the oil spill efficiently shown in Fig.4(f).
[image:3.595.43.290.58.272.2] [image:3.595.140.533.599.836.2] [image:3.595.47.289.662.808.2](c) (d)
(e) (f)
Figure 4: (a) original image (b) low thresholdselection (c) under segmented using low threshold (d) high threshold selection (e)over segmented image (f) proposed segmented image The blue bullet in Fig. 4(b)represents the lower threshold ( value which makes the segmentation as in case 3 is 25. The segmentation performed by this threshold values is shown in Fig.4(c) which is under segmentation. Majority of the oil spill dark region is not covered by this threshold value. Another threshold ( value is to be taken from mean of optimized differential evolved fuzzy parameters which is peak value of distribution function is 215.5 shown in Fig.4(d). The segmentation performed by this threshold gives the over segmentation results shown in Fig.4(e). Finally mean of these two thresholds considered as reference threshold for make segmentation which has extracted the major part of the oil spill efficiently shown in Fig.4(f).
IV. CONCLUSION
In this document a new advance is anticipated for automatic discovery of oil spills starting SAR images. A robust double threshold segmentation is proposed for SAR backscatter descriptions to take out the regions from gray scale images. The final detection of the regions is obtained by processi
ng
of lower and higher threshold values. The efficiency of extraction has been compared with many states of art segmentation methods that give the less false alarm rate.REFERENCES
1. Yu, W.Y., Li, J., Shao, Y., Qi, X.P.,&Liu, Y.,“Remote Sensing
Techniques for Oil Spill Monitoring in Offshore Oil and Gas Exploration and Exploitation Activities: Case Study in Bohai Bay (in Chinese).(2007).” Pet. Explor. Dev. 34 (3), 378–383.
2. Kin, D.J., Moon, W.M., & Kin, Y.S.,“Application of Terra- SAR-X
4. Topouzelis, K.N.,“Oil Spill Detection by SAR Images: Dark Formation
Detection, Feature Extraction and Classification Algorithms. (2008).” Sensors. 8 (10), 6442–6659.
5. Fan, K., Zhang, Y.,&Lin, H.,“Satellite SAR Analysis and Interpretation
of Oil Spill in the Offshore Water of Hong Kong. Ann. (2010).” GIS. 16 (4), 269–275.
6. Li, S.H.,“Application of Remote Sensing for Oil Slicks Detecting and It’s Progress (in Chinese). (2004).” Remote Sensing Information. 19 (2), 53–57.
7. Amit D. Purohit, &Prof. S. T. Khandare, “A survey on different color
Image Segmentation techniques using Multilevel Thresholding. (2017). IJCSMC.6(4), 267 – 273.
8. K. Bhargavi, &S.Jyothi, “A Survey on Threshold Based Segmentation
Technique in Image Processing. (2014).” IJIRD.3(12).
9. Solberg, A., Storvik, G., Solberg, R.,&Volden, E. Automatic Detection
of Oil Spills in ERS SAR Images. (1999).” IEEE Trans. Geosci. Remote Sens. 37 (4), 1916–1924.
10. Shu, Y., Li, J., Yousif, “H. Dark-Spot Detection from SAR Intensity Imagery with Spatial Density Thresholding for Oil-Spill Monitoring. Remote Sens. (2010). Environ. 114 (9), 2026–2035.
11. Migliaccio, M., Tranfaglia, M.,&Ermakov, S.A.,“A Physical Approach
for the Observation of Oil Spills in SAR Images. (2005).” IEEE J. Oceanic Eng., 30 (3), 496–507.
12. Huang, B., Li, H., & Huang, X.,“A Level Set Method for Oil Slick Segmentation in SAR Images. (2005),” Int. J. Remote Sens. 26 (6), 1145–1156.
13. Pan, G., Tang, D.,&Zhang, Y.,“Satellite Monitoring of Phytoplankton in the East Mediterranean Sea after the Lebanon Oil Spill. (2012).” Int. J. Remote Sens. 33 (23), 7482–7490.
14. Solberg, A.H.S., Storvik, G., Solberg, R., &Volden, E. “Automatic Detection of Oil Spills in ERS SAR Images. (2009).” IEEE Trans. Geosci. Remote Sens. 37 (4), 1916–1924.
15. Solberg, A.H.S., Brekke, C.,&Ove Husoy, P.,“Oil Spill
Detection in Radarsat and Envisat SAR Images. (2007).” IEEE Trans. Geosci. Remote Sens. 45 (3), 746–755.
16. Del Frate, F., Petrocchi, A., Lichtenegger, J.,&Calabresi, G.,“Neural Networks for Oil Spill Detection Using ERSSAR. (2000).” IEEE Trans. Geosci. Remote Sens. 38 (5), 2282–2287.
17. Topouzelis, K.N., Karathanassi, V., Pavlakis, P., &Rokos,
D.,“Detection and Discrimination between Oil Spills and Look-Alike
Phenomena through Neural Networks. (2007).” ISPRS J.
Photogrammetry Remote Sens., 62 (4), 264–270.
18. MagedMarghany& Mazlan Hashim,“Comparative algorithms for Oil
spill automatic detection using Multimode Radarsat-1 SAR data. (2011).” Geoscience and Remote Sensing Symposium (IGARSS), IEEE International.
19. Maulik, U., & Chakraborty, D.,“A Self-Trained Ensemble with
Semisupervised SVM: An Application to Pixel Classification of Remote Sensing Imagery. (2011).” Pattern Recognit. 44 (3), 615–623.
20. AlaaSheta, MouhammdAlkasassbeh, &Malik Braik, “Detection of Oil
Spills in SAR Images using Threshold Segmentation Algorithms. (2012).” International Journal of Computer Applications, 57(7), 0975 – 8887.
21. M.Sezgin, &B.Sankur, “Survey over image thresholding techniques
and quantitative performance evaluation. (2004).” J.Electron.Imaging, 13(1), 146–165.
22. S. Aja-Fernandez, A.H.Curiale, &G.Vegas-Sanchez-Ferrero, “A local
fuzzy thresholding methodology formulti-region image segmentation. (2015). Knowl. Based Syst., 83,1–12.
23. K.S.Tan,&N.A.M.Isa, “Color image segmentation using histogram
thresholding-fuzzy C-means hybrid approach. (2011).”
PatternRecognit.44,1–15.
24. N. Otsu, “A threshold selection method from gray level histogram.
(1979).” IEEE Trans. Syst. Man.Cybern.62–66, SMC-9.
25. Y.J.Kim, T.Brox, W.Feiden, &J.Weickert., “Fully automated
segmentation and morphometrical analysis of muscle fiber images. (2007).” Cytometry Part A71A., 8–15
26. T.W.Ridler, &S.Calvard, Picture thresholding using an iterative
selection method. (1978).” IEEE Trans.Syst. Man Cybern.8,630–632.
27. H.D. Cheng, Y.H.Chen, &Y.Sun, “A novel fuzzy entropy approach to
image enhancement and thresholding. (1999).” Signal Process.75,277– 301.
28. C.H.Li,&C.K.Lee, “Minimum cross-entropy thresholding. (1993).”
PatternRecogn., 26,617–625.
29. Z.Z. Wang, “Removal of noise and radiallens distortion during
[image:4.595.51.290.49.329.2]or-2 Photo
30. Shawn Lankton, &Allen Tannenbaum, “Localizing Region-Based
Active Contours. (2008).” IEEE Transactions on Image Processing, 17(11).
31. ZhenzhouWang, “A semi-automatic method for robust and efficient
identification of neighboring muscle cells. (2016).” Pattern Recognition, 53(2016), 300–312
32. S.Sarkar, S.Saul, R.Burman, S.Dass, &SS.Chaudhuri, “A Fuzzy
Entropy Based multilevel Image Thresholding using Differential Evolution. (2015). 8947 of science letters in computer science, 386-395.
AUTHORSPROFILE
B.Malakonda Reddy obtained his B.Tech and M.Tech in Electronics and Communication Engineering. Currently he is pursuing his doctoral studies in KoneruLakshmaiah Education Foundation. His research interests are synthetic aperture radars,radar signal processing, antenna design and Imaging techniques
MD ZIA UR RAHMAN(M’09) (SM’16) received M.Tech. and Ph.D. degrees from Andhra University, Visakhapatnam, India. Currently, he is a Professor with the
Department of Electronics and Communication