C
2011. The American Astronomical Society. All rights reserved. Printed in the U.S.A.
MULTI-EPOCH OBSERVATIONS OF HD 69830: HIGH-RESOLUTION
SPECTROSCOPY AND LIMITS TO VARIABILITY
C. A. Beichman1, C. M. Lisse2, A. M. Tanner1,3, G. Bryden1,4, R. L. Akeson1, D. R. Ciardi1, A. F. Boden5, S. E. Dodson-Robinson6, C. Salyk6, and M. C. Wyatt7
1NASA Exoplanet Science Institute, Jet Propulsion Laboratory, California Institute of Technology,
Pasadena, CA, 91125, USA;[email protected]
2Johns Hopkins University, Applied Physics Laboratory, Laurel, MD 20723, USA 3Department of Physics and Astronomy, MSU, MS 39762, USA
4Jet Propulsion Laboratory, California Institute of Technology, Pasadena, CA 91109, USA 5Caltech Optical Observatories, California Institute of Technology, Pasadena, CA 91125, USA
6University of Texas, Astronomy Department, Austin, TX 78712, USA 7Institute of Astronomy, University of Cambridge, Cambridge, CB3 0HA, UK
Received 2011 June 10; accepted 2011 August 16; published 2011 November 23
ABSTRACT
The main-sequence solar-type star HD 69830 has an unusually large amount of dusty debris orbiting close to three planets found via the radial velocity technique. In order to explore the dynamical interaction between the dust and planets, we have performed multi-epoch photometry and spectroscopy of the system over several orbits of the outer dust. We find no evidence for changes in either the dust amount or its composition, with upper limits of 5%–7% (1σ per spectral element) on the variability of thedust spectrumover 1 year, 3.3% (1σ) on the broadband disk emission over 4 years, and 33% (1σ) on the broadband disk emission over 24 years. Detailed modeling of the spectrum of the emitting dust indicates that the dust is located outside of the orbits of the three planets and has a composition similar to main-belt, C-type asteroids in our solar system. Additionally, we find no evidence for a wide variety of gas species associated with the dust. Our new higher signal-to-noise spectra do not confirm our previously claimed detection of H2O ice leading to a firm conclusion that the debris can be associated with the break-up of one or more
C-type asteroids formed in the dry, inner regions of the protoplanetary disk of the HD 69830 system. The modeling of the spectral energy distribution and high spatial resolution observations in the mid-infrared are consistent with a ∼1 AU location for the emitting material.
Key words: infrared: planetary systems – Kuiper belt: general – planets and satellites: dynamical evolution and stability – planet–disk interactions – stars: individual (HD 69830) – zodiacal dust
Online-only material:color figures, machine-readable table
1. INTRODUCTION
One ofSpitzer’s most intriguing discoveries is the extreme level of zodiacal emission around the nearby (12.6 pc) K0V star HD 69830. The dust cloud around HD 69830 is approximately 1400 times brighter than the emission of our own zodiacal cloud and shows a plethora of solid state features attributable to small, hot, crystalline silicate grains located<1 AU from the parent star (Beichman et al.2005). Such intense emission from dust in the inner solar system is exceedingly rare, detectable in only∼1% of the mature stars surveyed bySpitzer(Beichman et al.2006a; Trilling et al.2008; Lawler et al.2009). Interest in this cloud and its link to the evolution of planetary systems was greatly heightened by the discovery of three Neptune-mass planets orbiting within 0.6 AU of the star (Lovis et al.2006). One of the major unanswered questions about this system is whether the dust seen bySpitzercomes from collisions within a particularly massive asteroid belt or from a swarm of comets released by planet–disk interactions. The Spitzer follow-up observations described here include high signal-to-noise ratio (S/N), low and high spectral resolution observations of the dust disk to help distinguish between these two alternatives. Five repeats of the spectral observations over 12 months were designed to search for small variations that might be expected from a dust cloud evolving on a dynamical timescale of less than one year. Overall, the data described here span more than four years of Spitzerobservations from 2004 to 2008 and extend as far back as a 1983 detection byIRASat 25μm. In this paper we use new
Spitzerdata to refine our assay of the mineralogical and gaseous components of the HD 69830 disk (Lisse et al.2007) and look for temporal variations in the disk emission that might occur on dynamical or dust replenishment timescales, from 1 year to over 1000 years. Observations of young protoplanetary disks can exhibit dramatic changes in the shape of theirSpitzerspectra on timescales as short as one week (Muzerolle et al.2009). Our observations were designed to probe whether such activity is present in the diffuse debris disk orbiting a much older main-sequence star.
To accomplish these aims, we made observations using all three Spitzer instruments (Section 2.1). The location of the emitting material in relation to the three radial velocity (RV) planets is also of considerable interest in understanding the origin of the dust which might lie either interior to, in be-tween, or exterior to the planets. To investigate this question we made mid-IR images with the Michelle mid-IR camera on the 8 m Gemini telescope and looked for extended near-IR emis-sion with the 85 m baseline Keck Interferometer (Section2.2). After a discussion of the entire set of observations, we de-scribe our results in Section 3 and discuss their implications in Section4.
2. OBSERVATIONS
2.1. Spitzer Observations and Data Reduction
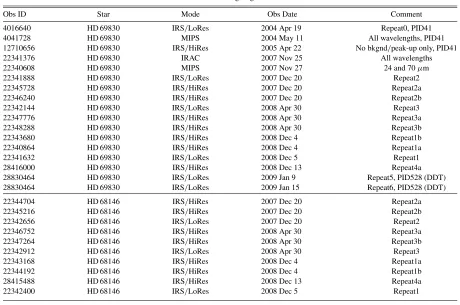
Table 1
Observing Log
Obs ID Star Mode Obs Date Comment
4016640 HD 69830 IRS/LoRes 2004 Apr 19 Repeat0, PID41
4041728 HD 69830 MIPS 2004 May 11 All wavelengths, PID41
12710656 HD 69830 IRS/HiRes 2005 Apr 22 No bkgnd/peak-up only, PID41
22341376 HD 69830 IRAC 2007 Nov 25 All wavelengths
22340608 HD 69830 MIPS 2007 Nov 27 24 and 70μm
22341888 HD 69830 IRS/LoRes 2007 Dec 20 Repeat2
22345728 HD 69830 IRS/HiRes 2007 Dec 20 Repeat2a
22346240 HD 69830 IRS/HiRes 2007 Dec 20 Repeat2b
22342144 HD 69830 IRS/LoRes 2008 Apr 30 Repeat3
22347776 HD 69830 IRS/HiRes 2008 Apr 30 Repeat3a
22348288 HD 69830 IRS/HiRes 2008 Apr 30 Repeat3b
22343680 HD 69830 IRS/HiRes 2008 Dec 4 Repeat1b
22340864 HD 69830 IRS/HiRes 2008 Dec 4 Repeat1a
22341632 HD 69830 IRS/LoRes 2008 Dec 5 Repeat1
28416000 HD 69830 IRS/HiRes 2008 Dec 13 Repeat4a
28830464 HD 69830 IRS/LoRes 2009 Jan 9 Repeat5, PID528 (DDT)
28830464 HD 69830 IRS/LoRes 2009 Jan 15 Repeat6, PID528 (DDT)
22344704 HD 68146 IRS/HiRes 2007 Dec 20 Repeat2a
22345216 HD 68146 IRS/HiRes 2007 Dec 20 Repeat2b
22342656 HD 68146 IRS/LoRes 2007 Dec 20 Repeat2
22346752 HD 68146 IRS/HiRes 2008 Apr 30 Repeat3a
22347264 HD 68146 IRS/HiRes 2008 Apr 30 Repeat3b
22342912 HD 68146 IRS/LoRes 2008 Apr 30 Repeat3
22343168 HD 68146 IRS/HiRes 2008 Dec 4 Repeat1a
22344192 HD 68146 IRS/HiRes 2008 Dec 4 Repeat1b
28415488 HD 68146 IRS/HiRes 2008 Dec 13 Repeat4a
22342400 HD 68146 IRS/LoRes 2008 Dec 5 Repeat1
Notes.All observations are from program PID40109 unless otherwise stated. The numerology of “repeats” represents names associated with submitted AORs, not the order in which they were actually executed bySpitzer. The background observation for HiRes Repeat3a was lost due to downlink problems; Repeat 4a was added as a replacement. Gemini/Michelle observations at 11.2 and 18.5μm were made on 2007 March 7 and 8. Keck Interferometer observations were taken at theKband on 2006 November 11 and at theLband on 2010 February 26.
Infrared Spectrograph (IRS) (Fazio et al. 2004; Rieke et al.
2004; Houck et al.2004). In addition to discovery data obtained with MIPS and IRS in 2004, the two photometric instruments were used at one epoch in 2007 while the IRS spectrometer was used on five occasions at low resolution and six occasions at high resolution to look for small variations in the emission from small dust grains responsible for the excess from this source. In the case of the IRS observations, a nearby star, HD 68146 (F7V), which is known to have no long wavelength excess (Beichman et al.2006a) was used as a reference star for both flat fielding and bad pixel monitoring. In addition, the IRS peak-up array was used to obtain 22 μm photometry along with each IRS spectrum. We have used the IRS peak-up photometry to look for temporal variations, and in the absence of any variability we averaged the IRS spectral data to obtain the best spectrum of the excess for comparison with dust models. We also examined the spectral data for evidence for temporal variations.
2.1.1. IRAC
IRAC images were obtained at all four wavelengths from 3.6 to 7.9 μm. To avoid saturation by the bright stars con-sidered here, short 0.02 s exposures were made in the sub-array mode. Co-adding 64 individual sub-sub-array frames, we performed aperture photometry using standard aperture size, aperture correction, and calibration factors as described in the Operating Manual,8 yielding the values listed in Table2. The
8
http://irsa.ipac.caltech.edu/data/SPITZER/docs/irac/iracinstrumenthandbook/
photometric uncertainty is dominated by the overall IRAC cali-bration accuracy of 3% (Reach et al.2005). The observed fluxes in conjunction with ground-based data constrain the photo-spheric emission from the star. No evidence for an excess is seen in any of the four bands, which puts a strong constraint on the amount of excess at the short end of the IRS spectra, wavelengths 8μm in modules SL1 and SL2 (Section2.1.3
below).
2.1.2. MIPS
MIPS observations were made at 24 and 70 μm with an integration time at 70μm significantly greater than in the initial survey (Bryden et al. 2006), 2200 s versus 340 s. Data were reduced using the MIPS instrument team pipeline version 3.10 with standard apertures and calibration values (Engelbracht et al.
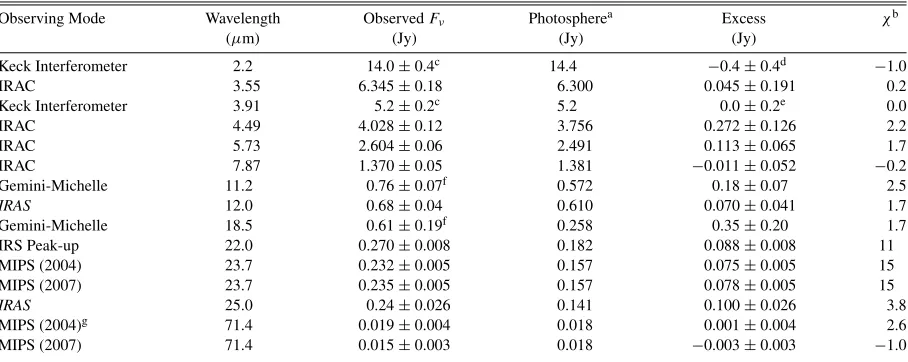
Table 2
Infrared Photometry of HD 69830
Observing Mode Wavelength ObservedFν Photospherea Excess χb
(μm) (Jy) (Jy) (Jy)
Keck Interferometer 2.2 14.0±0.4c 14.4 −0.4±0.4d −1.0
IRAC 3.55 6.345±0.18 6.300 0.045±0.191 0.2
Keck Interferometer 3.91 5.2±0.2c 5.2 0.0±0.2e 0.0
IRAC 4.49 4.028±0.12 3.756 0.272±0.126 2.2
IRAC 5.73 2.604±0.06 2.491 0.113±0.065 1.7
IRAC 7.87 1.370±0.05 1.381 −0.011±0.052 −0.2
Gemini-Michelle 11.2 0.76±0.07f 0.572 0.18±0.07 2.5
IRAS 12.0 0.68±0.04 0.610 0.070±0.041 1.7
Gemini-Michelle 18.5 0.61±0.19f 0.258 0.35±0.20 1.7
IRS Peak-up 22.0 0.270±0.008 0.182 0.088±0.008 11
MIPS (2004) 23.7 0.232±0.005 0.157 0.075±0.005 15
MIPS (2007) 23.7 0.235±0.005 0.157 0.078±0.005 15
IRAS 25.0 0.24±0.026 0.141 0.100±0.026 3.8
MIPS (2004)g 71.4 0.019±0.004 0.018 0.001±0.004 2.6
MIPS (2007) 71.4 0.015±0.003 0.018 −0.003±0.003 −1.0
Notes.
aFrom Kurucz model fitted to data from visible to 4.5μm with adopted fractional error in the model of 1%. Overall fit of model to data has
reducedχ2of 1.29.
bχ=(Observed- Photosphere)/noise2+ (model uncertainty)2where IRAC calibration uncertainties are taken to be 3%, peak-up uncertainty
is set to 3%, and MIPS 24μm uncertainty is 2% (Engelbracht et al.2007). MIPS 70μm uncertainty is dominated by the background noise in the image, rather than by systematics. We adopt the MIPS 2007 observation as being of much higher quality in terms of understanding of instrument performance, improved pointing and much greater integration time, 300 vs. 2000 s. The noise values quoted in the table are total noise values, including statistical and confusion noise as well as calibration uncertainties.
cKeck Interferometer Nuller measurements are relative to the stellar photosphere. The fluxes here are scaled from the given photospheric flux. dThe KIK-band limit applies to dust within 0.6 AU.
eThe KIL-band limit applies to dust within 1.1 AU. fIn a 2diameter aperture.
gAs reported in Bryden et al. (2006). When re-reduced with same software pipeline as the 2007 data, the revised 2004 value is 0.026±0.003 Jy,
which is still consistent with no excess. The 2004 data are of considerably lower quality than the 2007 data.
2.1.3. IRS Low Resolution
Low-resolution IRS measurements were made in all four modules (SL2, SL1, LL2, and LL1) covering wavelengths from 5 to 35μm (Houck et al.2004). A high precision peak-up was performed to ensure careful centering of the star within the slits. Significantly greater integration times were used for the LL1 and LL2 measurements than were allotted in the initial IRS survey (Beichman et al.2005), increasing the sensitivity to weak features at long wavelengths. New observations reported in this paper include three repeats spaced over one year (2007 December, 2008 April, and 2008 December) plus two additional repeats granted as part of the Director’s Discretionary Time (DDT; both in 2009 January).
The data were reduced using standard techniques of subtract-ing the spectra obtained in the two Nod positions from one another for sky subtraction. Uncertainties at each wavelength are based on the differences between the two Nod positions. To derive flat field corrections we obtained contemporaneous IRS observations on three occasions (Repeats 1–3 in Table1) of the reference star HD 68146, an F7V star of comparable mag-nitude and no known IR excess located a few degrees away from HD 69830. At the longest wavelengths, corrections to the HD 69830 data based on observations of HD 68146 relative to its predicted photosphere (based on a Kurucz model as described in Beichman et al. 2006a) proved to be no better than sim-ply adopting the average flat field calibration provided by the Spitzer Science Center (SSC). Thus, no additional corrections were made to the HD 69830 data in the LL1 or LL2 modules; only the data from the shortest wavelength modules (SL1 and
SL2) were corrected for small flat field errors using contempora-neous HD 68146 measurements. This correction is particularly important for correcting the known “teardrop” artifact at wave-lengths between 12 and 14μm in the SL1 module.9While the
large-scale concavity introduced into the spectrum is modest, about 5% in total flux, its effect on this work is amplified by subtraction of the stellar photosphere. The shorter wavelengths in the spectrum are unaffected. The amplitude and shape of the “teardrop” changed from scan to scan and on timescales as short as the time required to move from the reference star to HD 69830, consistent with the hypothesis that the teardrop orig-inates from small centering errors of the star in the spectrometer slit. Overall, however, the large-scale shape of the teardrop re-mained relatively consistent between the three epochs that have corresponding control star observations of HD 68146, such that a flat-field based on the three-epoch average removed much of the teardrop curvature from both stars’ spectra. As discussed below, however, the residuals from the teardrop make it difficult to confirm the broad, weak spectral feature due to water vapor first noted in Lisse et al. (2007).
Additional calibration corrections were made to ensure conti-nuity between the orders of each spectrum. At the shortest wave-lengths of SL1 the spectra are consistent with the photospheric model of HD 69830 (Beichman et al. 2005 and Section3.1), which was in turn linked to ground-based and IRAC photome-try; no scaling of SL1 is required. SL2 data are similarly consis-tent with the photosphere and do not require any scaling. For the
9
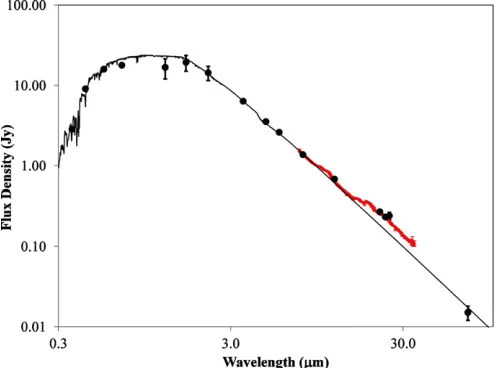
Figure 1.Full spectrum of HD 69830 including a Kurucz photospheric model fitted to short wavelength data (< 5μm) along with data from the three
Spitzerinstruments. The spectral energy distribution shows an excess at mid-IR wavelengths due to small grains within 1 AU of the star. The lack of an excess at 70μm implies there is no significant reservoir of large, cold grains at larger distances from the star.
(A color version of this figure is available in the online journal.)
longest wavelengths, LL1 is scaled to match the MIPS 24μm flux. The correction factors are very small: +0.5%, +2.2%, and −0.2% for Repeat1, Repeat2, and Repeat3, respectively. Inter-mediate wavelengths (order LL2) are most problematic in that they exhibit the most variation between epochs and require the largest corrections in order to properly line up with the border-ing SL1 and LL1 data. The LL2 correction factors for the three epochs are−5%−3%, and −6% for Repeat1, Repeat2, and Repeat3, respectively.
After first verifying that there were no statistically significant variations that could not be attributed to either noise or instru-mental effects (Section4.2), we formed the median average of these three highest quality spectra, i.e., the three repeats with cor-responding control star observations. The epoch-to-epoch vari-ation is added to the calculated uncertainty at each wavelength, though in most cases this is less than the original Nod–Nod un-certainty. The spectral distribution of HD 69830 from the visible to 100μm is given in Figure1. The spectrum of the excess after subtraction of the stellar photosphere is discussed in Section3
(Figure2).
2.1.4. IRS Peak-up Data
While IRS serves primarily as a spectrograph, it also provides well-calibrated images as it centroids its target onto the slit. As part of this peak-up procedure, we obtained IRS imaging data in the red filter (18.5–26.0 μm) whenever HD 69830 or HD 68146 was observed in either the IRS High- or Low-resolution modes (Table1). With each IRS spectra taking six snapshots, a total of 84 images of HD 69380 and 60 images of HD 68146 were obtained. We calculate the fluxes in each image using aperture photometry within a 4 pixel radius aperture relative to a 8–14 pixel sky annulus, using a conversion factor of 680 electron/sec per mJy (i.e., standard photometry as described in the IRS data handbook). Centroiding onto the peak of the flux in each image moves the target location by less than a pixel with negligible effect on the net fluxes. Two frames with cosmic ray hits near the target were removed (one from “Repeat 3” on HD 69830 and one from “Repeat 2” on HD 68146). Last,
Figure 2.(Top) The low-resolution spectrum of the excess of HD 69830 after subtraction of a Kurucz photospheric model. MIPS and IRS peak-up photometry is shown for comparison. (Bottom) The solid black line shows the fractional excess in the LoRes spectrum of HD 69830 relative to the photosphere. The lower dotted lines show the differences between theaveragefractional excess observed over 1.4 year interval vs. the individual three repeats making up the average, 2007 December (red solid), 2008 April (green dashed), and 2008 December (blue dotted). There is little or no change at the 1% level from epoch to the next. Variations due to instrumental noise are apparent at the short and long wavelength ends of the data.
(A color version of this figure is available in the online journal.)
the individual frames were averaged into daily values, given as “raw Fν” in Table 3. HD 68146 was observed whenever
HiRes observations were made allowing for careful photometric calibration monitoring at those epochs.
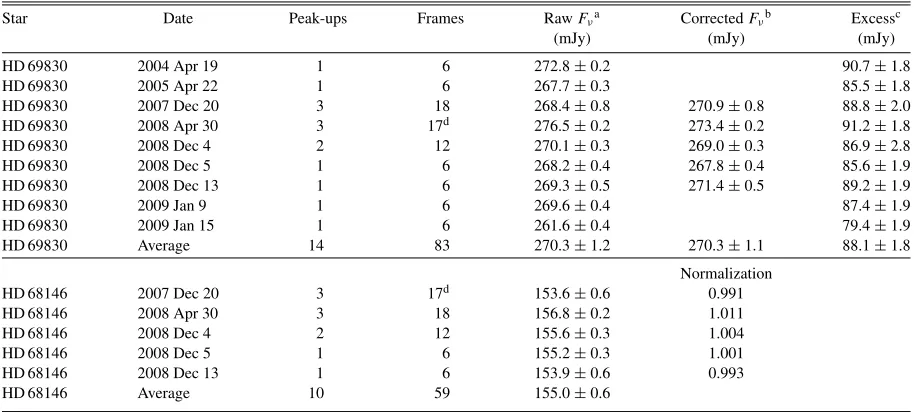
[image:4.612.45.296.56.240.2]Table 3
IRS Peak-up Data
Star Date Peak-ups Frames RawFνa CorrectedFνb Excessc
(mJy) (mJy) (mJy)
HD 69830 2004 Apr 19 1 6 272.8±0.2 90.7±1.8
HD 69830 2005 Apr 22 1 6 267.7±0.3 85.5±1.8
HD 69830 2007 Dec 20 3 18 268.4±0.8 270.9±0.8 88.8±2.0
HD 69830 2008 Apr 30 3 17d 276.5±0.2 273.4±0.2 91.2±1.8
HD 69830 2008 Dec 4 2 12 270.1±0.3 269.0±0.3 86.9±2.8
HD 69830 2008 Dec 5 1 6 268.2±0.4 267.8±0.4 85.6±1.9
HD 69830 2008 Dec 13 1 6 269.3±0.5 271.4±0.5 89.2±1.9
HD 69830 2009 Jan 9 1 6 269.6±0.4 87.4±1.9
HD 69830 2009 Jan 15 1 6 261.6±0.4 79.4±1.9
HD 69830 Average 14 83 270.3±1.2 270.3±1.1 88.1±1.8
Normalization
HD 68146 2007 Dec 20 3 17d 153.6±0.6 0.991
HD 68146 2008 Apr 30 3 18 156.8±0.2 1.011
HD 68146 2008 Dec 4 2 12 155.6±0.3 1.004
HD 68146 2008 Dec 5 1 6 155.2±0.3 1.001
HD 68146 2008 Dec 13 1 6 153.9±0.6 0.993
HD 68146 Average 10 59 155.0±0.6
Notes.
aStated uncertainties come from the standard deviation of the mean for all points in the data set (i.e., the deviation between the frames at each
epoch or between the epochs for the overall average).
bCorrected using contemporaneous observations of HD 68146.
cExcess relative to photospheric flux density of 182.2 mJy at 22.0μm. Uncertainty for the excess includes 1% for the subtracted stellar model.
Overall calibration uncertainty of∼3% is not included here.
dOne corrupted frame removed.
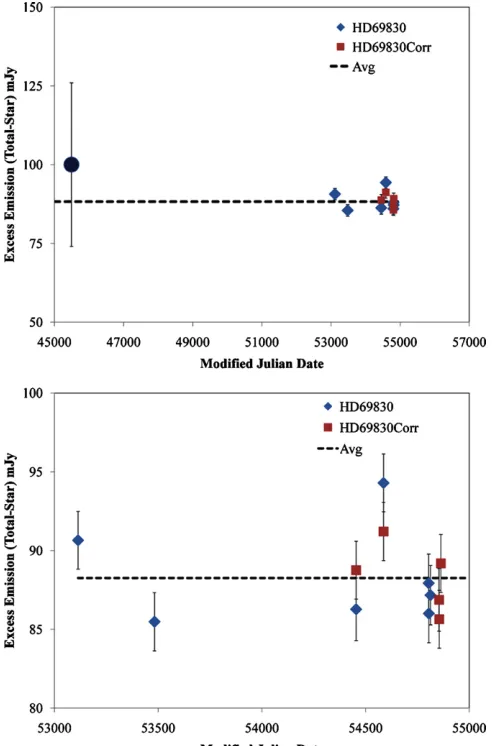
HD 69830 with contemporary observations of HD 68146, some additional photometric calibration is possible. Normalizing the HD 69830 data using the HD 68146 observations where available leads to the corrected values for HD 69830 in Table3
and Figure 3. The dispersion in the renormalized data for HD 69830 (total of star + disk) is just 0.9% (1σ), which should be taken as an upper limit on the mid-IR variability of the system as a whole. We discuss the possible variability of the disk emission in Section4.2.1.
2.1.5. IRS High-resolution Spectra
Three different epochs of HiRes data of both HD 69830 and HD68416 were collected on 2007 December 20, 2008 December 4, and 2008 December 13. The first two epochs each included two observations at two Nod positions with the final epoch including one observation of two Nod positions for a total of 10 spectra of each star. An observation on 2008 April 30 had downlink problems and is not considered further. Each observation also included an exposure offset from the star to be used for background and bad pixel removal. All images were run throughIRSclean10 to flag and repair bad pixels using the bad pixel masks provided by the SSC for each observational campaign, as well as bad pixels flagged by hand usingIRSclean. After bad pixel repair, the background images were subtracted from their corresponding target images. The one-dimensional (1D) spectra were then extracted from the reduced images using Spice11and its default settings.
Prior to stitching together the 10 orders within the Long and Short wavelength modules, the 1D spectra are put through
10 http://irsa.ipac.caltech.edu/data/SPITZER/docs/dataanalysistools/tools/ irsclean/irscleanmanual
11 http://irsa.ipac.caltech.edu/data/SPITZER/docs/dataanalysistools/tools/ spice/spiceusersguide
IRSfringeto remove the low level of interference fringes inherent to the data. At this point, there were still spikes in the spectra due to missed bad pixels and noise at the red end of each module. To remove the remaining errant pixels in the 1D spectra, we ran each module through a three pixel 3σclipped mean. We stitched orders together using the data at overlapping wavelengths in each lower wavelength order to attach onto its neighboring longer wavelength order. At a few wavelengths in the overlap regions we interpolated values between neighboring orders to provide a smooth transition; the uncertainties assigned to these wavelengths were increased by 50%, a conservative value based on examination of other overlap regions. The same procedure was used to attach the Long and Short modules, resulting in 10 complete spectra ranging from 9.86 to 37.2μm. The final spectrum was produced by first normalizing each spectrum to have the same flux at 15μm, a region of the spectrum relatively free of residual noise features, and then taking a 3σ clipped average of the 10 sub-spectra. Uncertainties were obtained by evaluating the standard deviation of the mean for the spectra included in the average at each wavelength. As a final step, the entire HiRes spectrum (star + disk) was adjusted by 3.5% to bring it into agreement with the LoRes spectrum, an amount which is within the quoted 5% calibration uncertainties of the HiRes spectrophotometry (Houck et al. 2004) and with our contemporaneous HiRes observations of HD 68146.
2.2. Ground-based Observations
2.2.1. Gemini/Michelle
Figure 3.(Top) The excess emission from HD 69830 observed with theSpitzer/ IRS peak-up array at 22μm over 4 years (blue diamonds and red squares) is compared with anIRAS25μm datum from 24 years earlier (black circle). Five IRS observations (red squares) have been corrected using contemporaneous peak-up imaging of HD 68146. Uncorrected flux values are shown as blue diamonds. The temporal variation of HD 69830’s excess emission is less than 33% (1σ) over 24 years. (Bottom) Same as (a) but forSpitzerdata only showing less than 3% (1σ) variation over four years.
(A color version of this figure is available in the online journal.)
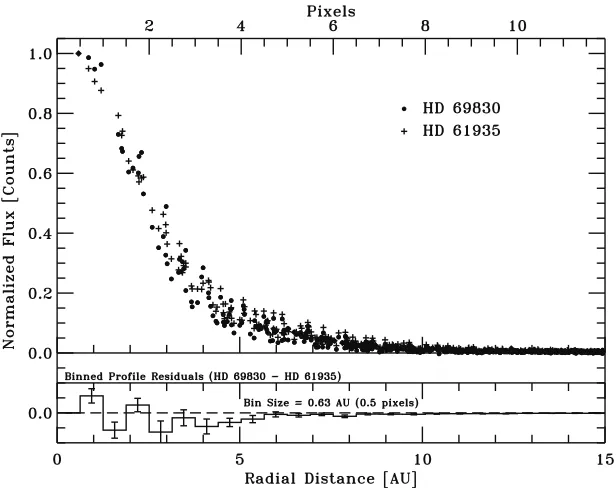
reference star, HD61935. Some frames with significant trailing blur in the direction of motion of the chopping secondary were rejected. The flux densities detected in 2 diameter apertures (Table2) are consistent with the total star + disk flux density measured in the larger beams withSpitzer, confirming the com-pact nature of the disk. The azimuthally averaged 1D scans of HD 69830 and HD61935 at 18.5μm are shown in Figure4and are consistent with unresolved sources with an FWHM of 0.3. The limit to the size of HD 69830’s emitting region at 11.2μm is 4 AU diameter, which is consistent with the inferred temperature and location for the dust discussed in the models below. Sim-ilar results were reported by Smith et al. (2008). As discussed below, mid-IR observations with the MIDI Instrument on the Very Large Telescope Interferometer (VLTI) indicate that the emission is resolved at the 0.5–1 AU scale (Smith et al.2009).
2.2.2. Keck Interferometer
While HD 69830 is too faint for observations with the nulling mode of the Keck Interferometer (KI) at 10 μm
(Colavita et al. 2009), we did obtain visibility measurements on KI’s 85 m baseline in theK band on 2006 November 11. Three integrations were made in the medium-resolution mode (R∼200). HD 68146 and HD71155 were used as calibrators, chosen to match the target near-infrared brightness and spatial location, and the wide-band and spectroscopic observations were processed with the standard settings, including a correction for flux bias.12 Although HD71155 has a mid-infrared excess
(Rieke et al.2005), its spectral energy distribution (SED) shows no evidence for a near-infrared excess and the uncertainty in its stellar size is not the dominant term in the final uncertainty for the measured visibility of HD 69830. The calibrated average visibility squared for HD 69830 is 1.01 ±0.05. For a stellar radius of 0.87±0.04R, the visibility squared for the stellar photosphere at the Kband should be 0.97 ±0.01. Thus our measurements are consistent with a completely unresolved source and no excess flux. The 1σ uncertainty on incoherent (i.e., distributed) flux within the 50 mas FWHM beam (0.63 AU) is 3% of the stellar flux. Observations in theLband were taken at KI on 2010 February 26. The same calibrators were used as for theKband observations and five calibrated scans on HD 69830 were obtained. The data were processed as for theKband, except that no flux bias was applied. The central wavelength is 3.91μm and the source was unresolved with an average visibility squared of 0.97±0.05. The 1σ uncertainty on incoherent flux within the 90 mas FWHM (1.13 AU) is 3% of the stellar flux.
3. RESULTS
3.1. The Excess Toward HD 69830
As in earlier work (Beichman et al.2005), we fitted a Kurucz model photosphere (Kurucz1992; Castelli & Kurucz2003) to photometric data from the visible and near-IR usingHipparcos and Two Micron All Sky Survey (2MASS) data. Because the 2MASS data are of low quality due to the brightness of the star, we included data from the two short IRAC bands, 3.5 and 4.5μm in the fitting procedure. The overall fit is of excellent quality with a reducedχ2=1.29 (Figure1). The shortest wavelength module (SL2; wavelengths < 7.5 μm) shows no evidence for features or any excess flux 10 mJy or, equivalently, a fractional excess at roughly the 0.5% level (1σ) compared to the photosphere. This level of excess is insignificant in terms of disk properties due to the brightness of the photosphere at these wavelengths. The mid-infrared and longer wavelength photometry are summarized in Table2with amounts of excess given relative to this model. Most striking is the lack of evidence for any excess in the two longer IRAC bands, 5.7 and 7.87μm. The onset of the excess seen in IRS modules (below) is quite sharp and shows no evidence for emission shortward of∼8μm. The photometric data provide a justification for pinning the IRS spectra to the photosphere at the short end of SL1 (as described below). The lack of excess shortward of∼8 μm (in both the IRAC and IRS data) supports the contention that amorphous carbon is not present in this source (Lisse et al.2007).
The broad outline of the excess toward HD 69830 is revealed in the low-resolution SED (Figure1), which shows an excess between 8 and 35 μm that by 70 μm falls off to levels below detectability, even with the new, higher S/N MIPS data (Section2.1.2). This confirms the earlier lack of long wavelength excess (Bryden et al.2006). As argued in Beichman et al. (2005), these characteristics require the existence of small grains located
Figure 4.Azimuthally averaged 1D profile of the 18.5μm emission from HD 69830 (black) measured with the Michelle instrument on the Gemini-N telescope is compared with a reference star, HD61935 (red). An upper limit to the size of the source is 0.3 (FWHM), or roughly 4 AU diameter.
within 1 AU of the star. The lack of significant 70μm excess means both that the emitting grains detected at 8–35μm must have sharply declining emissivity at longer wavelengths (and hence be much smaller thana ∼ 70/2π ∼ 10μm) and that there is no large reservoir of larger, colder grains at greater distances from the star. The plethora of small grain features in the low- and high-resolution spectra confirm these conclusions and are discussed below.
3.2. The Low-resolution Spectrum
The averaged LoRes spectrum from three epochs (2007 December to 2008 December) is shown in Figure 2(a) after subtraction of the stellar photosphere. The fractional excess relative to the photosphere is shown in Figure2(b). The spectrum is in good agreement with the calibration of the peak-up image with an average flux across the 18–26μm passband of the peak-up array of 83 mJy, compared with the 88±8 mJy measured in the peak-up images. The average 7–35μm spectrum shows qualitatively the same features as in Beichman et al. (2005) with numerous features from small grains evident throughout the spectrum. Improvements from the additional observing time include higher S/Ns at longer wavelengths and better control of systematics around 8 and 14μm. We use this improved spectrum for mineralogical analysis in Section4.1below.
We put a limit on any temporal variations across the one-year observing sequence for the best LoRes data by noting that the uncertainty in the average excess, σ Fdust/Fdust, averaged
[image:7.612.317.570.354.475.2]over the ranges with significant excess, 9.5–11.5 μm and 16–32 μm, is 7% and 5% per spectral element, respectively. These variations are only slightly larger than the variation seen in the spectra of HD 68146, which showed no fractional excess at the level of 2%–3% on three separate occasions across the whole 7–35μm band. Figure2(b) shows that the differences in the fractional excess from each spectrum relative to the average is∼1% in regions of good S/N and away from a few bad pixels. The average LoRes spectrum is available in the online journal (Table4).
Table 4
IRS Low-resolution Spectrum
Wavelength Fluxa Photosphere Excess FracExcess
(μm) (mJy) (mJy) (mJy)
7.516 1560.0±55.0 1504.9 55.1±55.0 0.0366±0.0365 7.576 1493.2±26.0 1483.3 10.0±26.0 0.0067±0.0175 7.637 1480.0±33.2 1459.6 20.4±33.2 0.0140±0.0228 7.697 1463.2±33.7 1437.1 26.1±33.7 0.0182±0.0235 7.758 1429.9±27.6 1416.2 13.7±27.6 0.0097±0.0195 7.818 1397.4±18.9 1395.1 2.4±18.9 0.0017±0.0136 7.879 1374.7±15.3 1374.9 −0.1±15.3 −0.0001±0.0132 7.939 1364.8±17.6 1354.4 10.4±17.6 0.0076±0.0129 8.000 1347.7±18.7 1334.1 13.6±18.7 0.0102±0.0140
Notes.aStated uncertainties are the larger of (1) the standard deviation of the
mean of three individual repeats or (2) the average of the three noise values from the individual repeats divided by√3−1. No systematic error for the subtraction of the photospheric model has been applied.
(This table is available in its entirety in a machine-readable form in the online journal. A portion is shown here for guidance regarding its form and content.)
3.3. The High-resolution Spectrum
Figure 5.Each panel shows a portion of the smoothed, flattened spectrum of the excess from HD 69830. No spectral features are identified with significance above the instrumental noise. The solid black line shows the data and the dashed red line shows what a spectral line at the level of the 3σupper limits would look like at the position of some of the lines discussed in the text. The blue dotted line represents the 1σnoise level determined from the average of the multiple HiRes spectra. Other “features” in the spectrum do not align with commonly expected gas species and can mostly can be traced back to instrumental artifacts (bad pixels, order boundaries, etc.) in the data.
(A color version of this figure is available in the online journal.)
4. DISCUSSION
4.1. Model for Emission
Our existing models (Beichman et al. 2005; Lisse et al.
2007) required the presence of hot, small crystalline grains in the region of 1 AU with no evidence for material on more distant orbits. The new observations confirm and extend these results.
4.1.1. Reexamination of HD 69830 Dust Mineralogy
The physical model used to characterize the mineralogy of the HD 69830 dust was developed forSpitzerobservations of the Tempel 1/Deep Impactdata (Lisse et al.2006). In our case, optically thin emission originates in material located in a narrow annulus around the star. A wide variety of minerals and ices are successively added into the model until theχ2 of the fit stops changing by a significant amount. Additional variables include the size distribution of the dust grains and distance to the host star. Our model of the 2004 data (Lisse et al.2007) revealed a population of small, super-thermal grains at about 425 K composed of silicates (both olivine and pyroxene, but mainly forsterite, fayalite, and ferrosilite), a smattering of sulfides and carbonates, and surprisingly some water ice.
Using the higher S/N LoRes spectra (Section3.2), we now reevaluate the mineralogy of the HD 69830 system. Figure 6
shows the best-fit model broken down into its various species components while Table 6 lists the relative abundances of species identified in the LoRes spectrum, as well as significant non-detections. The final reducedχ2 for the model fit to the
Table 5
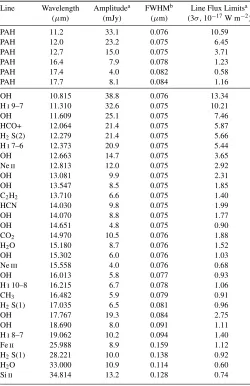
Flux Limits for Selected Lines in the HiRes Spectrum
Line Wavelength Amplitudea FWHMb Line Flux Limitsa
(μm) (mJy) (μm) (3σ, 10−17W m−2)
PAH 11.2 33.1 0.076 10.59
PAH 12.0 23.2 0.075 6.45
PAH 12.7 15.0 0.075 3.71
PAH 16.4 7.9 0.078 1.23
PAH 17.4 4.0 0.082 0.58
PAH 17.7 8.1 0.084 1.16
OH 10.815 38.8 0.076 13.34
Hi9–7 11.310 32.6 0.075 10.21
OH 11.609 25.1 0.075 7.46
HCO+ 12.064 21.4 0.075 5.87
H2S(2) 12.279 21.4 0.075 5.66
Hi7–6 12.373 20.9 0.075 5.44
OH 12.663 14.7 0.075 3.65
Neii 12.813 12.0 0.075 2.92
OH 13.081 9.9 0.075 2.31
OH 13.547 8.5 0.075 1.85
C2H2 13.710 6.6 0.075 1.40
HCN 14.030 9.8 0.075 1.99
OH 14.070 8.8 0.075 1.77
OH 14.651 4.8 0.075 0.90
CO2 14.970 10.5 0.076 1.88
H2O 15.180 8.7 0.076 1.52
OH 15.302 6.0 0.076 1.03
Neiii 15.558 4.0 0.076 0.68
OH 16.013 5.8 0.077 0.93
Hi10–8 16.215 6.7 0.078 1.06
CH3 16.482 5.9 0.079 0.91
H2S(1) 17.035 6.5 0.081 0.96
OH 17.767 19.3 0.084 2.75
OH 18.690 8.0 0.091 1.11
Hi8–7 19.062 10.2 0.094 1.40
Feii 25.988 8.9 0.159 1.12
H2S(1) 28.221 10.0 0.138 0.92
H2O 33.000 10.9 0.114 0.60
Siii 34.814 13.2 0.128 0.74
Notes. a3σupper limit.
bTypical spectral resolution based on the examination of spectral lines observed
in the shell star HD142926 and reduced in identical fashion.
mineralogical markers seem to show that the dust in the system has not changed appreciably, we believe the difference is due to the higher S/N of the new data, and to a better, more complete IRS data calibration. While previously we had reported water ice at only moderate abundances in HD 69830, the change does concern us for the purported detections of water ice in other systems we have studied to date.
Figure 7 shows the contributions of various particle sizes to the overall emission spectrum along with various power laws. The steepest, a−3.9, power law provides the best fit to
the IRS spectrum. The distribution of grains sizes is typically assumed to follow a power-law distribution dn/da ∝ a−3.5,
as expected from a simple model for a steady-state collisional cascade (Dohnanyi 1969). However, a greater concentration of small dust can be produced if the strength of the particles against collisional disruption depends on grain size, with smaller particles being more resistant to destruction than larger ones (O’Brien & Greenberg 2003; Wyatt et al. 2011; Belyaev & Rafikov2011). Observationally, a steeper power law appears to be required to explain the combined IR and visible light
Figure 6.Decomposition of the HD 69830 spectrum reveals a composite of the mineralogical species listed in Table6. The data (black) and the model fit (dotted orange line) are shown in terms of the excess emission divided by a 425 K blackbody to represent grain emissivities. Below the data and model curves are the emissivities of dominant species in the model. From top to bottom the species include: polycyclic aromatic hydrocarbons (PAHs; thin yellow), hematite (thick orange), sulfides (green), talc (thin cyan), pyroxenes (thick blue), and at the bottom a mixture of olivines (blue and purple).
[image:9.612.43.293.77.463.2](A color version of this figure is available in the online journal.)
Figure 7.Particle size distribution for the grains responsible for the excess from HD 69830, following a power-law distribution steeper than the canonical−3.5.
emission from the resolved disks orbiting HD207129 (a−3.9) and HD92945 (a−3.7) (Krist et al. 2010; Golimowski et al.2011).
Our model for HD 69830’s disk emission suggests a comparably steep power law. Consistent with our previous work we obtain a dust mass of 3×10²⁰g and surface area of 1.2×1024cm2in
0.1–10μm grains and, by extrapolation up to 10 m planetesimals with aa−3.9power law, a total mass of solid material 2×10²¹g
(Lisse et al.2007).
Another explanation for the particle size distribution comes from the competition between gravitational and radiation forces (Poynting–Robertson drag and blow-out by radiation pressure) which controls the small grain lifetime. The parameter β = Frad/Fgravdepends on physical properties of the dust grains and
the stellar radiation field (Wyatt et al.1999; Sheret et al.2004). The value ofβas a function of particle size is shown in Figure8
[image:9.612.320.566.345.531.2]Table 6
Composition of the Best-fit Model of the HD 69830 Spectra
Species Weighteda Density Molecular N
molesb Tmax Modelχ2c
Surface Area (g cm−3) Weight (relative) (K) if not included
Detections Olivines
Amorph Olivine (MgFeSiO4) 0.15 3.6 172 0.31 385 10.4
ForsteriteKoike (Mg2SiO4) 0.26 3.2 140 0.59 385 8.64
Forsterite038 (Mg2SiO4)d 0.21 3.2 140 0.48 385 8.82
Fayalite (Fe2SiO4) 0.12 4.3 204 0.25 385 3.85
Pyroxenes
Bronzite (Mg1−xFexSi2O6)d 0.11 3.5 232 0.17 385 4.25
Fe Species
Sulfides (Fe90Mg10S) 0.08 4.5 72 0.50 385 2.33
Oxides (Fe3O4)d,e 0.02 5.2 232 0.04 385 1.19
Marginal or Non-Detections Phyllosilcates
Talc (Mg3Si4O10(OH)2)e 0.05 2.8 379 0.04 385 1.22
Organics
Amorphous Carbon (C) <0.005 2.5 12 <0.1 425 1.03
PAH (C10H14), ionized <0.12 1.0 <178> <0.07 N/A 1.10
Water
Water Icef <0.05 1.0 18 <0.28 170 1.05
Carbonates
Magnesite (MgCO3) <0.02 3.1 84 <0.07 385 1.03
Dolomite (CaMgC2O6)d,f <0.005 2.9 184 <0.008 385 1.01
Siderite(CaMgC2O6)d,f <0.01 3.9 116 <0.03 385 1.01
Pyroxenes
FerroSilite (Fe2Si2O6)f <0.005 4.0 264 <0.008 355 1.01
Diopside (CaMgSi2O6)f <0.005 3.3 216 <0.008 385 1.01
Notes.
aWeight of the emissivity spectrum of each dust species required to match HD 69830. bN
moles∝Weighted Surface Area*Density/Molecular Weight. Errors are 10% (2σ). cTotal best-fit modelχ2=1.03. Assumes 4% absolute calibration uncertainty. dNot found in cometary systems to date.
eNew minor species detection not found in Lisse et al. (2007).
fMinor species reported detected in Lisse et al. (2007) but not found in higher S/N spectrum.
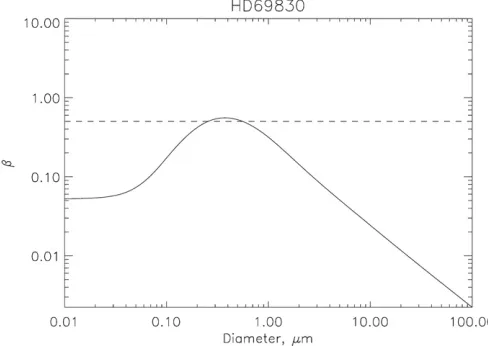
Figure 8.Factorβ=Frad/Fgravrepresents the balance between radiative and
gravitational forces for dust grains and depends on physical characteristics of the grains (size, composition) and the stellar radiation field (Wyatt et al.1999; Sheret et al.2004). Calculations for silicate grains orbiting HD 69830 are shown. Only grains withβ >0.5, corresponding to a narrow range of radius, will be blown out of the system.
field of HD 69830. Only a narrow size range around∼0.4μm diameter attainsβ >0.5, so that a turnover (but not a complete truncation) in the size distribution would be expected at sizes just below 1μm as observed; i.e., the derived distribution is entirely consistent with that expected for dust that is being produced in steady state from a reservoir of larger objects. For different compositions, in particular those with grains of lower densities, β would be higher than that in Figure8and a broader range of particle sizes would be removed.
Overall, the new data, particularly given the lack of a definite detection of H2O ice, lead to a straightforward conclusion that
[image:10.612.45.289.491.664.2]the HD 69830 debris is dominated by small grains <1 μm composed of material similar to C-class asteroids which formed in drier, interior portions of solar nebula. As suggested by Figure 10 in Currie et al. (2011), the silicates in the HD 69830 disk are enriched in olivines relative to pyroxenes, suggestive of highly processed material in a few-Gyr-old system and substantially different from the more primitive material seen in the comet Hale–Bopp or the young stars HD 98800 andηCrv.
4.1.2. Location of the Emitting Material
Table 7
Maximum Molecular Masses from IRS Spectroscopy (400 K)
Molecule Maximum Mass λ(μ)
(g)
C2H2 6.5E+16 13.71
CO2 1.5E+17 14.97
H2O 1.9E+17 33.00
HCN 2.4E+17 14.03
OH 3.6E+19 18.69
Notes.Models assume LTE excitation atT =400 K and a Gaussian local line broadening withσ=2 km s−1.λgives the wavelength of the strongest spectral feature.
combination with stability constraints from the known planets (Lovis et al. 2006), suggested two possible locations for the emitting material: in the middle of the planetary system at 0.5 AU and beyond the outer planet outside 1 AU, with the closer location being marginally preferred by the VLTI data. We reexamined the possibility of the grains being at∼0.5 AU, inside the planetary system, rather than our preferred solution of grains located at 1 AU (near the 2:1 resonance with the outermost planet). The equilibrium temperature of small grains that are inefficient emitters is given by Backman & Paresce (1993):
Tgr=468
L
L
1/5
AU R
2/5
λ−01/5K (1)
where λ0 = ζ a ∼ 0.1μm is the critical wavelength fora = 0.1μm grains andζ ∼1 is appropriate for moderately absorbing grains (Backman & Paresce1993). Then Tgr = 670RAU−2/5K for HD 69830’sL = 0.6L (Lovis et al.2006). Putting the grains at 0.5 AU would raise their temperature to over 800 K, which is inconsistent with the lack of emission shortward of 7.5 μm. Alternatively, larger grains at 0.5 AU would have lower temperatures (∼350 K), but these large particle sizes are totally inconsistent with the sharp crystalline features seen in the spectrum, which demand grains roughly ∼0.1–1.0μm in radius. The detailed modeling reaffirms this conclusion and strongly supports the 1 AU location of the debris, exterior to the three planets and not between them. The SED analysis favors the alternative interpretation of the VLTI results that places the bulk of the material at the more distant location from the star.
The data from the KI (Section2.2.2) yield upper limits to the presence of material emitting at 2 and 3μm ofFd/F∗ ∼3%
(1σ) of the photospheric levels. Using a standard relationship (Beichman et al.2006b), this flux ratio limit can be converted to a limit on the amount of material (in units ofLd/L∗) emitting at
the temperature,Td, at which the Planck emission is at its peak:
Ld
L∗ = Fd
F∗ exd−1
xd
Td
T∗
3
(2)
wherexd =hν/(kTd)=3.9 at the peak of the Planck curve. For
dust emitting at 2.2 (3.1)μm, with peak temperatures of 1700 (1200) K, the KI measurements yield 1σ limits to Ld/L∗ of
0.01 (0.004). These temperatures are reached at distances from the star of∼0.02 (0.04) AU for a blackbody or 0.1 (0.2) AU for small grains. Unfortunately, these limits do not particularly constrain the amount of material in the innermost regions of the HD 69830 disk, compared with the 10 fold smaller amounts of hot dust seen toward the A and F stars targeted by other
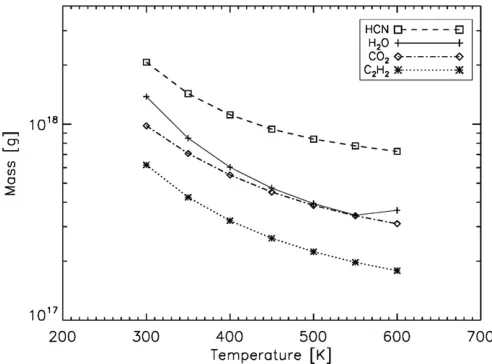
Figure 9.Simple optically thin model based on IRS HiRes spectroscopy sets limits to the amounts of different gaseous species that could be present in the HD 69830 disk at various temperatures.
interferometers (Absil et al.2008; Akeson et al. 2009). These nearby hot stars are 3–5 magnitudes brighter than HD 69830 and were observed with interferometers with higher V2 precision
than KI. The KI 2 and 3μm results are also consistent with the shortest wavelength VLTI results (8 and 9μm) of Smith et al. (2009), which showed the source to be unresolved.
4.1.3. Limits to Gas Species from HiRes Data
Table5 lists spectral features used to search for gas phase constituents in the HD 69830 disk where we have included typical atomic and molecular species seen in younger disks such as TW Hya and other T Tauri stars (Chen et al. 2006; Najita et al.2010; Pascucci et al.2007). In no case do we find convincing evidence for the presence of any gas species. Using the model described in Salyk et al. (2008), we have turned our measurements into upper limits for a few key species using an optically thin model that depends solely on the assumed gas temperature (Figure9; Table7). For a gas temperature of 400 K, appropriate to gas in equilibrium with dust grains at 1 AU, we find an upper limit to the amount of water vapor present of 2×10¹⁷g. The minimum dust mass derived by Lisse
et al. (2007) and consistent with the new data reported here is 3×10²⁰ g (for grain radii 0.1 to 10μm), 1500 times the limit
to the amount of water vapor. The HD 69830 debris field is at present very dry. To assess the meaning of this upper limit in terms of a possible parent body, we must examine the lifetime of any water vapor against photolysis by the combination of the radiation from HD 69830 and the interstellar radiation field.
We first consider the photolysis rate of optically thin water gas in the interstellar radiation field:dN/dt = −J N, whereN is the water abundance in cm−3andJ =5.9×10⁻¹⁰s−1is the experimentally measured rate coefficient (Millar et al. 1997). The half-life against photodestruction by interstellar photons is then (ln 2)/J =37.2 yr.
Next we consider photodissociation from the star’s UV flux. For cometary material located at 1 AU from the Sun, the timescale for dissociating H2O,τ(H2O→OH + H), is 8×10⁴
s or just under one day (Combi & Feldman1993). The stellar photon field at 1 AU from the cooler HD 69830 is approximately five times weaker shortward of the 0.24μm photodissociation limit for H2O than the Sun’s. In calculating this ratio we used
[image:11.612.42.295.78.160.2]an average of 5250 K and 5500 K models, which is consistent with HD 69830’s IUE measurement ofFν(0.24μm)=42 mJy
(IUE 2000). By this reckoning, the survival time for water will be approximately 4×10⁵s or∼4.6 days.
Thus, while a comet explosion, e.g., Comet 17P/Holmes in 2007 (Reach et al.2010), or collision could produce IR-emitting dust plus H2O gas, the water lifetime will be so short that just
a few weeks after the collision all traces of the water would have vanished. Models of the solar nebula suggest that the ice/rock ratio of icy bodies is around 1:1 (Lodders 2003; Dodson-Robinson et al.2009), so we assume that such a comet explosion would produce equal amounts of water gas and IR-emitting dust—3×10²⁰g of each for HD 69830. Although this
amount of water gas is well above our detection threshold of ∼2×10¹⁸g and would have been observable, the timescale is
so short that catching the water emission is unlikely.
The lack of detection of H2O also constrains scenarios in
which the dust and gas are replenished in a steady state, with the equilibrium gas mass balanced between the mass input and photodissociative loss. Assuming the parent body composition is equal parts ice and dust, and that 100% of the ice ends up as water vapor, the inferred dust mass-loss rates of between 1015 g day−1 (Wyatt et al. 2007a) and 1018 g day−1 (Wyatt
et al.2010) also apply to the water vapor production rate. The 4.6 day lifetime of water vapor then predicts steady state levels of 5×10¹⁵–5×10¹⁸g. The upper limit implies that mass-loss
rates as high as invoked in Wyatt et al. (2010), in which the dust we see is being blown out via radiation pressure, are ruled out unless the parent body had a particularly low water content.
OH is thought to arise from dissociation of H2O (Carr &
Najita2011), so the lack of OH in our spectrum is not surprising given the lack of H2O. Similarly, species such as H2C2and HCN
are seen in T Tauri stars at a few percent to∼50% of the level of H2O emission (Carr & Najita 2011), so that the lack of
these species is also consistent with the non-detection of water and OH. While we cannot rule out trace amounts of water ice and gas in the HD 69830 debris or a one-time burst of cometary material from which the generated gas species have been rapidly destroyed, the overall debris composition and the present-day lack of gas is consistent with an origin in asteroidal, not cometary, parent bodies.
4.2. A Search for Temporal Variations
In addition to the numerous spectral features which we can use to determine the composition of its dust, HD 69830’s disk is also unique in the proximity of the dust to the star and to known planets, which permits a search for temporal evolution in the disk emission on dynamical timescales. The periods of the planets at 0.078, 0.19, and 0.63 AU are 8.7, 31.6, and 197 days, respectively (Lovis et al.2006). While most debris disks are thought to be evolving in steady state due to the slow grinding down of planetesimal belts (e.g., Dermott et al.2002; Dominik & Decin2003; Wyatt et al.2007b), there is a growing number of disks that exhibit evidence that the IR emission must be transient (Telesco et al. 2005; Su et al.2005; Lisse et al.
2009). HD 69830 may be one such transient disk (Wyatt et al.
2007a). Of the possibilities for the origin of this ephemeral dust, several predict variability on orbital timescales. (1) If the dust originates in planetesimals that are trapped in resonance with the planet HD 69830d at 0.63 AU then its distribution would be clumpy, and those clumps would orbit the star with the planet (Wyatt & Dent 2002). If the planet’s orbit is not exactly circular, then those clumps would also be on eccentric
orbits (Quillen & Thorndike2002; Kuchner & Holman2003), and so the dust temperature and total emission would vary on the orbital timescale of the planet (∼200 days). Such variations would also affect the collisional/sublimation properties of the feeding material, which could be evident in changes in spectral features on the same timescale. (2) Similar temperature and emission variability would be predicted if the dust originates in a clump of material on an eccentric orbit (e.g., if this is the recent disintegration of a comet scattered in from a more distant planetesimal belt), except that the orbital timescale could be much longer. (3) Since the majority of the dust is small enough to be blown out by radiation pressure as soon as it is created, then if the small dust population in this planetesimal belt is dominated by individual collisions (e.g., Song et al.2005) there would be a significant stochastic element to the emission, which could originate in the destruction of planetesimals as small as 30 km (Lisse et al.2007).
4.2.1. Limits on Outbursts
As Dermott et al. (2002) have noted, “extrasolar planetary systems, even very old systems, that contain belts of asteroids and comets in the rubble pile state could occasionally and unexpectedly flare into infrared visibility due to catastrophic disruption of these rubble piles.” Such an event must be considered as the cause of the brightness of HD 69830 (see also Kenyon & Bromley2004). However, there is no evidence for large-scale changes in the disk brightness on a number of interesting timescales. First, over the 24 year period between IRASand the latest Spitzerdata, from 1983 to 2007, there is no evidence for variation in the disk output: MIPS (24μm), Fν(disk) = 0.078 ± 0.005 Jy, and IRS peak-up (22μm),
Fν(disk) = 0.088 ± 0.008 Jy, compared with IRAS 25 μm,
Fν(disk) = 0.100 ± 0.026 Jy (Table 2). Ignoring the slight
differences in wavelengths, the variation is insignificant (16± 28 mJy) compared to an average disk value between 22 and 25μm of 84 mJy. There is no evidence for variability of the disk emission at the 33% (1σ) level over 24 years where the large uncertainty is due to the low S/N of theIRASdata.
IRS peak-up photometry spans only four years but provides information at the few percent level. As discussed above, the IRS peak-up data (22μm) show no significant change relative to theIRASdata (25μm) over a 24 year timescale (Figure3(a)). To investigate the possible variation of the excess emission with higher precision on the shorter Spitzer timescale, we exam-ined the IRS peak-up data corrected using contemporaneous HD 68146 data (when available). After subtracting the photo-spheric value of 182.2 mJy for HD 69830 we find that the disk emission is consistent with aconstantvalue of 88 mJy at 22μm, with 2.6% measurement dispersion. Including the uncertainty in the stellar contribution increases the uncertainty in the disk excess to 3.3% or 88±3 mJy (Figure3(b)). Theχ2value of the
data compared against the assumption of constant disk emission is 9.4, which with 6 degrees of freedom has a non-significant P-value of 0.15. Finally, the IRS LoRes spectra show no dif-ference in the dust emission at the 5%–7% level per spectral element over a 1 yr period (Figure2(b)).
The total emitting area in the HD 69830 dust cloud is estimated to be 1.2×10²⁰m2in particles ranging in radius from
an object of radius equal to 10 (20 km) and converted into small grains on timescales of 4 (24) years. The destruction of such an object corresponds to the material responsible for the zodiacal dust bands in our solar system (Grogan et al.2001). A catastrophic event of this sort could be expected to occur once per 1–5 million years in the solar system (Dermott et al.2002; Sykes & Greenberg1986). In the dynamically active planetary system of HD 69830 such an event might occur tens to hundreds of times more frequently. While the probability of catching such a rare event is small, considering that HD 69830 is itself a rarity with only<1% of stars in variousSpitzersurveys showing bright 10μm excess emission (Beichman et al.2006b; Lawler et al.
2009), we argue here and in Section4.3that this explanation may be the most probable for this star.
Heng (2011) argues that a steady state grinding down of material is a possible explanation for the HD 69830 excess, but only if the star has an age of ∼1 Gyr. In this scenario, the disk would retain more of its primordial brightness (Wyatt & Dent2002). While age estimates for HD 69830 range from <1 to 5 Gyr (Beichman et al.2005; Wyatt et al.2007a), older ages seem much more probable. One new piece of information comes from a “probable” detection of a stellar rotation period for HD 69830 of 35±1 day (Simpson et al.2010). This period is consistent with expectations for a K0V star with the age of the Sun or greater (Barnes2010). Chromospheric and X-ray data similarly argue for ages 1 Gyr. Measured values of log(RHK )= −4.98 and log(LX/LBol)= −6 (Canto et al.2011)
both suggest ages of 4–5 Gyr (Maldonado et al.2010; Mamajek & Hillenbrand2008). At such an advanced age, Heng (2011) agrees that a steady state model is hard to defend and that a transient origin for the HD 69830’s excess is more likely.
Another source of an outburst could be the passage of a comet into the inner reaches of the planetary solar system (Beichman et al.2005). The brightening of the solar system’s zodiacal cloud due to incursion of comets has been examined quantitatively by Napier (2001). A major argument against this mechanism is the spectral character of the dust emission, which is far more asteroidal than cometary in nature (Section4.1above; see also Lisse et al.2007), and the lack of any gas steady state emission. A weaker argument against a cometary origin is the fact that this system has no detectable dust associated with a distant Kuiper Belt. As discussed in Beichman et al. (2006b), the 70μm flux density limit corresponds toLd/L∗ ∼5×10⁻⁶(3σ) for 50 K
dust. This level is only∼5 times greater than the nominal range predicted for the Kuiper Belt dust in our own solar system (Stern
1996). The fact that the reservoir for comets is not much larger or more dynamically active than in our solar system argues that large-scale cometary incursions must be rare.
4.2.2. Limits on Orbital Effects
One possible origin for temporal variability is that a fraction of the disk material could be differentially heated as it orbits the star on an eccentric orbit. In analogy with the zodiacal dust bands in our own solar system, most of the debris material will be spread uniformly along the orbit since the dynamical timescale for this spreading is just a few hundred years within an AU of the star (Grogan et al.2001; Wyatt2006). Material in an eccentric orbit would be hotter close to the star and cooler far away from it. This effect is clearly seen in resolved maps of the Fomalhaut disk (Stapelfeldt et al.2004; Marsh et al.2005) where the SE ansa is hotter than the NW one. But this steady-state spatial effect is not resolvable in any data presently available. Nor are temporal data available for systems on such long-period orbits.
However, if there were a clump of material, located, say, at a resonant point with respect to the various planets in the system, then the periodic passage of this material closer to and further away from the star would change the temperature and resultant emission from the dust.
For specificity, consider the possibility that the∼88 mJy of excess detected in the IRS peak-up images at 22 μm consists of a constant component of 80 mJy from uniformly distributed dust at a semimajor axis of 1 AU plus another 10% in a clump that moves in an eccentric orbit with a semimajor axis of 1 AU and an eccentricity,. A simple model that follows the clump through its orbit yields a time-varying amount of emission we could compare with the data in Figure3. The model puts the dust clump in a 2:1 resonance with the outermost planet seen (Lovis et al.2006) at a semimajor axis of 1 AU, a corresponding period of approximately 400 days, and eccentricities of 0.1, 0.3, 0.6, and 0.9. The small grain temperature follows the radial power law derived above,Tgr =670R−2
/5
AU K. Following the clumped
grains through multiple orbits yields the orbital location, tem-perature, and total disk emission, which can be compared to the Spitzerobservations (Figure 10). TheIRASvalue is not con-straining. The maximum variation in the observed excess for the different eccentricities ranges from 0.6% (e=0.1) to 24% (e= 0.9). Of course, the orbital location of any clump (taken here to be a point source) is unknown, so to assess the impor-tance of eccentricity and clumpiness requires an average over all possible clump locations. Figure 11 shows the result of a Monte Carlo simulation comparing the model of variable emis-sion with the observations as a function of eccentricity and the fraction of total material carried in an eccentric orbit, averaged over all starting locations. The contours show that only an ex-treme range of eccentricity and clump fraction can be ruled out. For simplicity the simulation assumes a point source clump; to the extent that the clump is spread out in orbital phase, the amount of variation associated with the inhomogeneity will be reduced.
Wyatt et al. (2010) have argued that a highly eccentric swarm of planetesimals ( 0.9) could be responsible for a long-lived debris disks around stars like HD 69830. Without such high eccentricities and in the absence of a rare collisional event producing a burst of small grains, collisional processes operating over the presumed few Gyr age of HD 69830 would result in dust levels much closer to what we now see in our own solar system (Wyatt et al.2007a). If a high eccentricity parent population proves to be the explanation for the HD 69830 disks, then the results here suggest that the parent bodies of the emitting dust must be spread quite uniformly along the orbital path to account for the lack of the variability monitored by Spitzer andIRAS.
4.3. Nature of the HD 69830 Disk
The statistics ofSpitzerdetections suggest that the incidence of hot (12 μm) excesses for mature FGK stars,ηhot, is less than∼1% (Beichman et al.2006b; Lawler et al.2009). Old K stars with excesses like HD 69830’s are rare, consistent with theoretical expectations that debris disks fade away over a few Gyr, particularly at orbital distances of a few AU. What then explains the origin of the HD 69830 excess? We argue below that an impulsive event, i.e., a destructive collision of a modest sized (30 km radius) asteroid is the best explanation for the excess.
Figure 10.Simple model shows how putting 10% of the emitting material onto an eccentric orbit could modulate the observed excess. The curves show the total excess including the variable emission from dust with an orbital period of 400 days (1 AU semimajor axis for HD 69830) and eccentricities of 0.1 (black solid line), 0.3 (green dotted curve), 0.6 (blue dashed curve), and 0.9 (red, dash dotted curve) over approximately four years. The initial location of the clump is arbitrary.Spitzer/IRS points are shown for comparison.
(A color version of this figure is available in the online journal.)
Figure 11.Contours showχ2probability values resulting from comparing the eccentric clump model with a simple model of constant emission using the IRS peak-up
array measurements over four years. Only the most extreme values of clumpiness and eccentricity yieldp <0.05 can be ruled out by our observations. Other combinations of clumpiness and eccentricity are consistent with theSpitzer/IRS data.
(A color version of this figure is available in the online journal.)
time) for dissipation of the dust from a cataclysmic colli-sional event at 1 AU is given by toutburst = Torbit/4π τeff ∼
400 yr (Wyatt et al. 1999) for an effective dust optical
depth of τeff = 2 ×10⁻⁴ (Beichman et al. 2005). Since
[image:14.612.156.462.331.650.2]