Trends in ICT Access and Use
Neil Russell, Neil Stafford
Taylor Nelson Sofres - Social
Research Report No 358
Trends in ICT Access and Use
Neil Russell, Neil Stafford Taylor Nelson Sofres - Social
The views expressed in this report are the authors' and do not necessarily reflect those of the Department for Education and Skills.
© Queen’s Printer 2002. Published with the permission of DfES on behalf of the Controller of Her Majesty's Stationery Office. Applications for reproduction
TABLE OF CONTENTS
Page no
1 INTRODUCTION 1
1.1 Background 1
1.2 Notes on the report 3
2 SUMMARY 6
2.1 Awareness of ICT media 6
2.2 Usage of ICT and ownership of media 6
2.3 Perceptions of the value of computer skills 7 2.4 Usage and barriers to use of computers and the Internet 8 2.5 Potential incentives to using computers or the Internet 10
3 AWARENESS AND USE OF ICT MEDIA 12
3.1 Awareness of ICT media 12
3.2 Use of ICT media 15
4 PERCEPTIONS OF THE VALUE OF COMPUTER SKILLS 22
5 OWNERSHIP OF ICT MEDIA 26
5.1 Change in ownership of ICT media 26
5.2 Ownership of ICT media – ACORN groups / MDI analysis 28
6 USAGE AND BARRIERS TO USE OF COMPUTERS AND
THE INTERNET 30
6.1 Frequency and purpose of use 30
6.2 Propensity to use computers and the Internet in the future 40
6.3 Barriers to use 42
TABLE OF CONTENTS
Page no
7 SUMMARY OF ACORN GROUPS: USAGE OF AND
ATTITUDES TO ICT MEDIA 56
7.1 Council Estate Residents, Greatest Hardship (CEGHs) 56 7.2 Council Estate Residents, High Unemployment (CEHUs) 56 7.3 White Collar Workers, Better-Off Multi-Ethnic Areas (WCBMs) 57 7.4 New Home Owners, Mature Communities (NHMCs) 57 7.5 Prosperous Professionals, Metropolitan Areas (PPMAs) 57 7.6 Affluent Executives, Family Areas (AEFAs) 58
8 SUMMARY BY MDI: USAGE OF AND ATTITUDES TO ICT
MEDIA 59
8.1 Use of ICT 59
8.2 Presence of ICT in the home 59
8.3 Attitudes to computers 60
8.4 Barriers to ICT use 60
APPENDIX A
Methodology
APPENDIX B
ICT Omnibus Questionnaire
APPENDIX C
Acorn Groups Listing
APPENDIX D
1
INTRODUCTION
1.1
Background
Among the new information communication technologies (ICTs), access to the Internet is the subject of considerable press and business attention.
The Guardian of 16 October 2001 reported:
“From Edgbaston cricket ground to Anfield, shrine of Liverpool football club, the government is hoping to foment revolution. It is urging millions of adults to cast off their resistance to computers and cyberspace.”
It went on to highlight the digital divide by commenting:
“Perhaps most worrying, only 22% of those in poorly skilled social groups had been surfing (the Internet), compared with 68% of the professional classes.”
This news article was prepared in the light of the announcement by Estelle Morris of the large expansion in the number of UK online centres, offering free or low cost Internet access and the opportunity for adults to develop basic ICT skills.
Two days later, reporting on an ICT debate hosted by BT, The Guardian quoted research saying:
It then quoted Estelle Morris as saying:
“It could be our new DNA, or our new internal combustion engine. It gives us a chance to look at what teachers do. My biggest fear is that we get it wrong and miss the chance. The thing that worries me most is that we cause the digital divide to grow.”
In August 2000 Taylor Nelson Sofres was commissioned by the Department for Education and Skills to undertake benchmark research among a large, nationally representative sample of adults to identify and quantify the groups who use ICT and those who lack access to ICT, feel unable to use it or have no interest. The research also aimed to investigate the reasons behind those attitudes to ICT.
The survey was conducted on two weeks of Taylor Nelson Sofres’ RSGB Omnibus among a nationally representative sample of approximately 4000 adults. The interviews were conducted in home using face-to-face Computer Assisted Personal Interviewing (CAPI). (See Appendix A for more information on the methodology of this survey). In 2000, fieldwork was conducted between 23rd August and 3rd September. 2001 fieldwork was conducted between 14th and 25th November. There is little variation in the demographic profile of respondents between 2000 and 2001. The questionnaire used asked respondents about their patterns of use of ICT media such as PCs and mobile phones and then specifically about using the Internet (a copy of the questionnaire is attached in Appendix B).
This November 2001 research enabled the tracking of changes in ICT use and attitudes since the 2000 benchmark survey. In particular the research is used to provide an up-to-date snapshot of the “digital divide” and examine to what extent this had changed since 2000. Comparisons are made in this report between the 2000 and 2001 surveys.
1.2
Notes on the report
The results of the research have been examined by standard demographic analyses including sex, age, social grade, presence of children under 16 in the household, ethnicity and disability. A brief description of the different social grades used in the analysis is given below:
Social
Grade Social Status Chief Income Earner’s Occupation
A Upper Middle Class Higher managerial, administrative or professional
B Middle Class Intermediate managerial, administrative or professional
C1 Lower Middle Class Supervisory or clerical, and junior
managerial, administrative or professional C2 Skilled Working Class Skilled manual workers
D Working Class Semi and un-skilled manual workers
E Those at lowest level of subsistence
State pensioners or widows (no other earner), casual or lowest grade workers
The research results have also been examined by A Classification Of Residential Neighbourhoods for Great Britain (ACORN groups). Further information on this can be found in Appendix C.
ACORN group Description
AEFA Affluent Executives,
Family Areas Affluent working families or couples with mortgages.
PPMA Prosperous Professionals, Metropolitan Areas
Young professional singles & couples, living in apartments or gentrified multi-ethnic areas (typically in London)
WCBM White Collar workers, Better-off Multi-ethnic areas
Young families and white collar workers (middle class) living in home owning multi ethnic areas
NHMC New Homeowners,
Mature Communities Blue collar workers (working class) in mainly home owning areas. New homeowners and more mature, established owner occupiers
CEHU Council Estate, High
Unemployment Elderly or single people, likely to be living in council flats and unemployed
CEGH Council Estate, Greatest
Hardship Often lone parents with high unemployment living in council estates and flats
These groups have been chosen from 18 sub-groups for more in depth reporting as they provide a snapshot of ICT usage by sub samples of the population with greater or lesser degrees of deprivation. Hence, they illustrate patterns prevalent in the wider population. From a practical point of view, these groups also provide a sufficient sub sample size for results to be reliable.
A full list of the ACORN groups can be found in Appendix C.
In the following report, figures quoted for Internet access are based on any
Internet access and include access via PCs, WAP phones, digital TV/set top boxes, and games consoles. Where respondents have Internet access via more than one of these means, they are only counted once as having “any Internet access”.
2
SUMMARY
2.1
Awareness of ICT media
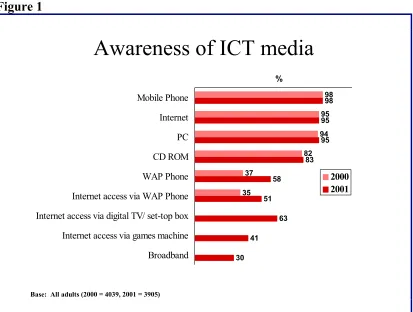
Awareness of ICT media was at a high level in 2000 and has retained, if not slightly increased, that level. 95% of people were aware of personal computers and the Internet in 2001. The largest increases since 2000 are in awareness of WAP phones and Internet access via WAP phone (Figure 1, page 12).
2.2
Usage of ICT and ownership of media
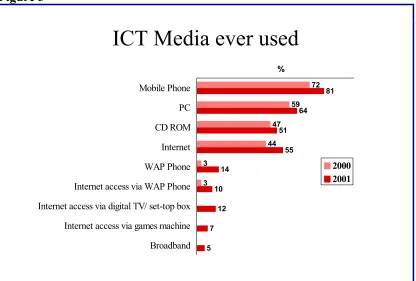
Usage of ICT has increased since the 2000 benchmark survey: 81% (up from 72%) have ever used a mobile phone and 64% (up from 59%) have used a personal computer (Figure 3, page 15).
The proportion of respondents who have ever used the Internet stands at 55% (up from 44%). However this is lower among women, those of DE social grade, more deprived ACORN groups and those aged 55 and older. 62% of males say they have used the Internet at some point compared to 49% of females, a slightly wider gap than in 2000 (50% males, 40% females). 79% of 16 to 34 year olds have ever used the Internet compared to 21% of those aged 55 or more. However, the percentage saying that they have ever used the Internet has increased among all age groups and growth has been largest among 35 to 44 year olds (from 56% in 2000 to 70% in 2001).
79% of AB respondents and 70% of C1 respondents say they have used the Internet at some point, compared to 51% of C2 and 31% of DE respondents. Growth on 2000 has been larger among AB respondents than it has among DE respondents
As with usage, ownership of all media has increased since 2000 (Figure 10,
page 26). Growth rates generally have been larger in C1 and C2 households
with lesser growth in DE households. Ownership is also higher in households where children under 16 years old are present.
2.3
Perceptions of the value of computer skills
In general, respondents feel that computer skills are becoming more essential to their future job prospects, and to their children’s future education and careers.
45% feel that computers are “very important” for life in general, almost the same as in 2000. This is less true for those aged 55 and older (41%), those of social grade C2DE (40%) and CEGHs (38%).
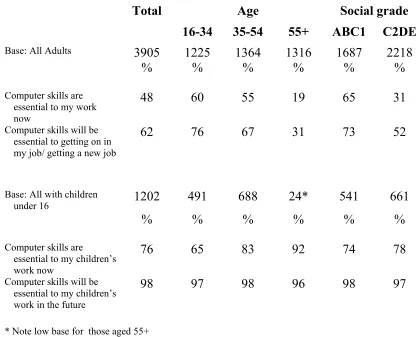
48% of respondents say that computers are essential to their jobs now, higher than the 44% in 2000. This is more likely to be mentioned by those of higher social grade (65% ABC1, 31% C2DE) and younger age groups (60% 16-34, 19% 55+). (Figure 8, page 23)
Looking to the future, 62% say that computer skills will be essential to getting on in their job or getting a new job (73% ABC1, 52% C2DE). This compares to 60% in 2000.
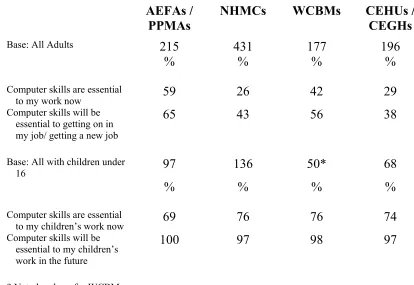
By ACORN group, 59% of AEFAs/PPMAs and 29% of CEHUs/CEGHs say that computer skills are essential to their jobs now. There is a similar difference in the percentages who say that computer skills will be essential to getting on in their job or getting a new job (65% and 38% respectively).
(Figure 9, page 24)
2.4
Usage and barriers to use of computers and the
Internet
Overall, time spent on computers and the Internet has increased in 2001. More people use computers and the Internet daily and spend more hours on them in an average week. In terms of barriers to use, cost is the biggest restriction among non-users who are interested in 2001, albeit slightly less so than in 2000. Disinterest among non-users has also fallen from 2000.
2.4.1 Usage
Of the 55% of all respondents who say they use computers nowadays, 61% say that they use their computer daily compared to 55% in 2000. A further 27% use their computer at least once a week.
The heaviest users are those aged 25-34 who claim an average use of 17.5 hours in the previous seven days and those of social grade AB who claim 16.5 hours use. The average for all users is 14.2 hours, higher than the 2000 figure of 12.5 (Figure 15, page 31).
The main three uses of computers are, as in 2000, e-mail, Internet access, and work.
Use of the Internet varies between several groups. The average Internet use over the previous seven days is 7.0 hours, up from 5.4 hours in 2000 (Figure
16, page 32). Males spend more time on the Internet (8.3 hours) than females
Of the 48% of respondents who currently use the Internet, their main use is to send e-mails (66%), to obtain information for work (37%) and shopping (35%). In terms of education and learning, 26% of current Internet users have used it for study/learning related to their job/career and 24% for school/college work. However, 28% have also used it for learning independent of work or study. 20% of current users have used the Internet to download music and 18% to play or download games. 12% have used the Internet for chat rooms.
There is little change between 2000 and 2001 in the places where the Internet is accessed - home (65%) and work (20%) are the most common. Use at home is higher among people aged 55 or more and in households where children under 16 are present
2.4.2 Barriers
The perceived barriers to using computers and the Internet are similar. Cost is the main barrier among interested non-users in relation to computers (41%). Lack of access to a computer is a restriction among 19% of non-users interested in using one (compared to 18% in 2000). The greatest barrier to Internet use is non-ownership of a computer (52%).
Non-users, not interested
31% of all adults do not use computers nowadays and are not interested in using them (compared to 37% in 2000). 34% do not use the Internet and have no interest, fewer than in 2000 (43%). Among the non-users, disinterest in computers is higher among older age groups, with 86% of non-users aged 55 or above not interested, compared to 31% of 16 to 34 year old non-users. A similar picture is evident in relation to interest in the Internet by age.
Non-users, interested
14% of all adults are non-computer users who are interested in using them. 17% do not use the Internet but are interested in using it. Interest is higher among younger non-users, with 67% of 16-34 year old non users interested in using a computer in the future compared to 14% of 55 years + non-users.
Among non-users who are interested in using computers, the main, unprompted reason they give for not using a computer at the moment is the (perceived) cost (41%) (Figure 23, page 43). Cost is less of a barrier to Internet use (26%), where non-ownership of a computer is the greatest restriction (52%). Cost is more of an issue for DE respondents, 16 to 34 year olds, those with children under 16 in the household and lone parents. Physical access is a barrier for 19% of non-users who are interested. This is a similar figure to 2000. There are no major subgroup differences among those who say that they do not have access to a computer.
Current Users
Among current users the main barrier to greater use is that people say that they do not have the time (45% for computers, 44% for Internet).
2.5
Potential incentives to using computers or the
Internet
Just over half of all non-users say that there are no incentives to make use of computers (Figure 32, page 53) and the Internet. This is higher among people aged 55 or more. The main incentives to using computers and the Internet among non-users in 2001 remain cost related. In general, younger users are more open to incentives than older ages.
The main use interested non-users would like to make of the Internet is for e-mail (33%), shopping (22%), and learning for your own interests (21%). Those aged 16-24 show a different current and aspirational usage than older respondents. They are more likely than others to want to use the Internet for study / learning, play or download games and music and chat rooms.
Younger non-users are more open to incentives. The most frequently given answers are cost related: cheap or free equipment or software, cheap or free call costs, cheap or free lessons.
3
AWARENESS AND USE OF ICT MEDIA
3.1
Awareness of ICT media
[image:16.595.98.511.241.553.2]Awareness of mobile phones, the Internet, personal computers and CD ROMs was already high in the 2000 benchmark survey and has subsequently changed little in 2001 (see Figure 1, below).
Figure 1
98 95
94 82
37 35
98
95 95
83 58 51
63 41
30
Mobile Phone Internet PC CD ROM WAP Phone Internet access via WAP Phone Internet access via digital TV/ set-top box Internet access via games machine Broadband
%
2000 2001
Awareness of ICT media
Base: All adults (2000 = 4039, 2001 = 3905)
Key changes
In general, awareness of ICT media is lower among older respondents and people of DE social grade. It is also lower among women than among men. This is a similar pattern to 2000.
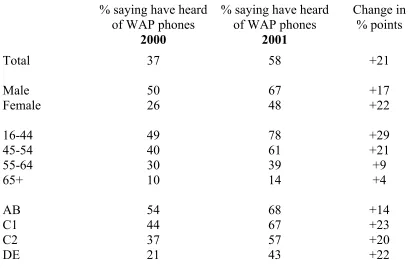
[image:17.595.91.505.377.653.2]Looking in particular at awareness of WAP phones among different groups (Figure 2, below), males (67%) are more aware than females (48%). However, the percentage of females aware of WAP phones has increased 22 points since 2000, compared to a 17 percentage point increase for males. As with awareness for other ICT media, older ages and those of social grade DE are the least likely to be aware of WAP phones. However, awareness has increased among DE respondents by 22 percentage points, from 21% in 2000 to 43% in 2001.
Figure 2
AWARENESS OF WAP PHONES
% saying have heard of WAP phones
2000
% saying have heard of WAP phones
2001
Change in % points
Total 37 58 +21
Male 50 67 +17
Female 26 48 +22
16-44 49 78 +29
45-54 40 61 +21
55-64 30 39 +9
65+ 10 14 +4
AB 54 68 +14
C1 44 67 +23
C2 37 57 +20
Distinctions in sex, age and class are also evident in the new categories introduced in 2001. For instance, 43% of males have heard of broadband compared to 17% of females. 79% of 16 to 34 year olds have heard of Internet access via digital TV compared to 13% of people aged 55 or more. Awareness of Internet access via digital TV also varies by social grade - from 76% among AB respondents to 47% among those people of DE social grade.
3.2
Use of ICT media
3.2.1 Ever used
[image:19.595.96.512.290.571.2]Usage of all the different ICT media has increased since the 2000 survey (see Figure 3, below). The largest increases in use of ICT media are in mobile phones (9 percentage points), the Internet (11 percentage points) and WAP phones (11 percentage points). Over half of the population (55%) now claim to have used the Internet at some point in their lives.
Figure 3
72 59
47 44 3
3
81
64 51
55 14
10
12 7
5
Mobile Phone PC CD ROM Internet WAP Phone Internet access via WAP Phone Internet access via digital TV/ set-top box Internet access via games machine Broadband
%
2000 2001
ICT Media ever used
All media show similar patterns of use by the following groups:
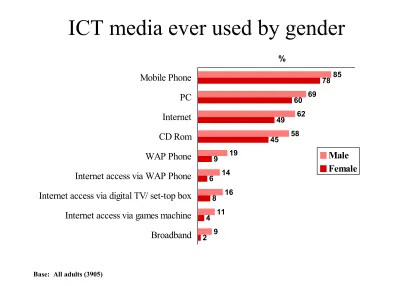
[image:20.595.95.508.234.520.2]• Men are more likely than women to have ever used ICT (see Figure 4 below). For example 62% of men claim to have used the Internet at some point compared to 49% of women.
Figure 4
85
69 62
58 19
14
16 11
9
78
60 49
45 9
6
8 4
2
Mobile Phone PC Internet CD Rom WAP Phone Internet access via WAP Phone Internet access via digital TV/ set-top box Internet access via games machine Broadband
%
Male Female
ICT media ever used by gender
Base: All adults (3905)
• Use remains greater among the younger age groups - 79% of 16-34’s claim to have ever used the Internet compared to 21% of those aged 55 and older.
• Households without children are less likely to have used ICT media than households with children under the age of 16. The exception to this is in single parent households, where usage is similar to households without children. For instance, 71% of people in households with children under 16 have used the Internet, compared to 48% in lone parent households and 48% in non-child households.
• Use also varies by ACORN group. PPMAs are the most likely to have ever used PCs and the Internet (89% and 86% respectively), followed by AEFAs. CEGHs, CEHUs and NHMCs are the least likely to have used ICT media, although there is a significant increase in usage among CEHUs compared to 2000.
• Differences by Multiple Deprivation Index are not as clear as they are by ACORN category. 77% of those in wards in the lowest MDI quartile (lowest deprivation index) say they have used a personal computer at some time. This falls to 60% for wards with in the highest MDI quartile (highest deprivation index). Similar differences are seen for use of CD-ROM (66%, 47%) and the Internet (68%, 52%). Use of other ICT does not vary significantly by MDI.
• Respondents with a disability are less likely to have ever used the different ICT media - e.g. 36% have used the Internet compared to 55% of the total population.
3.2.2 Use nowadays
There is a similar pattern between 2000 and 2001 in terms of ICT media used nowadays. The largest increases on 2000 occurred in the use of mobile phones (63% to 74%) and the Internet (37% to 48%). Relative to other ICT media, regular usage in 2001 is low for WAP phones (8%), Internet access via WAP phones (5%), Internet access via digital TV/set-top boxes (6%) and Internet access via games machines (3%).
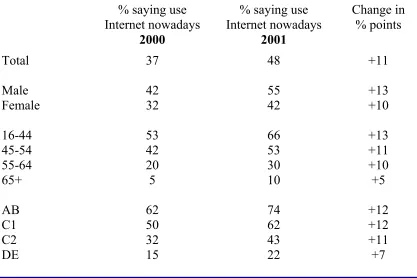
[image:22.595.92.509.431.709.2]Once again, there are distinct variations in ICT use among different groups. Figure 5, below, illustrates the patterns by examining those who use the Internet nowadays. Whilst differences between groups remain, regular Internet use has increased amongst all of these. However, growth has not been as fast among people aged 65 or over and people of DE social grade, both groups who were relatively low in 2000.
Figure 5
USE THE INTERNET NOWADAYS
% saying use Internet nowadays
2000
% saying use Internet nowadays
2001
Change in % points
Total 37 48 +11
Male 42 55 +13
Female 32 42 +10
16-44 53 66 +13
45-54 42 53 +11
55-64 20 30 +10
65+ 5 10 +5
AB 62 74 +12
C1 50 62 +12
C2 32 43 +11
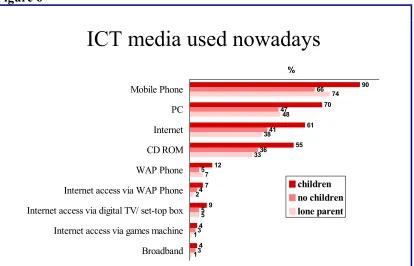
Another determining factor in current ICT media use is presence of children in the household. As the chart below demonstrates, all forms of ICT media are more likely to be used nowadays in households where children under 16 are present. The only exception to this is in single parent households, where ICT media use is generally at a similar level to those households without children.
Figure 6 90 70 61 55 12 7 9 4 4 66 47 41 36 5 4 5 3 3 74 48 38 33 7 2 5 1 1 Mobile Phone PC Internet CD ROM WAP Phone Internet access via WAP Phone Internet access via digital TV/ set-top box Internet access via games machine Broadband
%
children no children lone parent
ICT media used nowadays
Base: All adults with children aged under 16 in the household (1360), no children aged under 16 in the household (2545) and lone parents (355)
As with ICT media ever used, people with disabilities are less likely to use these media regularly. This could raise questions over access to ICT but it may also be due to the age of these respondents, who are more likely to be older. As has already been discussed, older age groups are the least likely to use ICT nowadays.
The use nowadays of ICT media varies widely by ACORN group. Use tends to be higher among AEFAs and PPMAs than CEGHs and CEHUs. Looking at use nowadays of personal computers and the Internet (Figure 7, below), PPMAs have overtaken AEFAs as the biggest users of these following large percentage point increases from 2000 (+16% and +25% respectively). CEGHs and CEHUs still lag behind the other groups, although CEHUs have experienced a strong growth in use compared to last year (up by 15 percentage points for PCs to 39% and 18 for Internet to 34%).
Figure 7
ICT MEDIA USED NOWADAYS – ACORN GROUPS
Personal Computer Internet
2000 2001 change 2000 2001 change
% % % points % % % points
Total 48 55 +7 37 48 +11
AEFA 68 76 +8 51 67 +16 PPMA 63 79 +16 53 78 +25 NHMC 38 41 +3 26 35 +9 WCBM 51 58 +7 46 52 +6 CEGH 37 38 +1 26 35 +9 CEHU 24 39 +15 16 34 +18
Usage of newer ICT media tends to be higher among the AEFAs and PPMAs, although CEGHs are also as likely to use some of these media nowadays (9% use WAP phone, 7% Internet via Digital TV, 6% Internet via games machine).
4
PERCEPTIONS OF THE VALUE OF
COMPUTER SKILLS
Respondents were asked how important they thought it was to be able to use computers for life in general. 86% feel they are at least “fairly important”, 45% say “very important”. This is very similar to the level of agreement last year (83% and 43%).
There are some differences among different groups but these are less marked than they are for the use of ICT media. Younger people, people of ABC1 social grade and ethnic minority groups are more likely to say “very important” compared to older people, C2DE respondents and people of White ethnicity. Of the ACORN groups, council estate respondents are the least likely to say “very important”.
Figure 8
AGREEMENT WITH VIEWS ABOUT COMPUTER SKILLS
Total Age Social grade
16-34 35-54 55+ ABC1 C2DE
Base: All Adults 3905 1225 1364 1316 1687 2218
% % % % % %
Computer skills are essential to my work now
48 60 55 19 65 31
Computer skills will be essential to getting on in my job/ getting a new job
62 76 67 31 73 52
Base: All with children
under 16 1202 491 688 24* 541 661
% % % % % %
Computer skills are
essential to my children’s work now
76 65 83 92 74 78
Computer skills will be essential to my children’s work in the future
98 97 98 96 98 97
* Note low base for those aged 55+
In relation to computers being essential for work now or in the future, this is more likely to be found true by younger respondents and those of ABC1 social grade. People of C2DE social grade, being manual workers, are less likely to use computers in their work and are therefore less inclined to agree that computer skills are essential to their work now. However, just over half of this group believe that computer skills will be essential to progressing in their job or looking for a new job in the future.
Respondents with disabilities are less likely than average to agree that computers are essential to their work now or in the future.
The importance of computer skills for children’s work now is related less to the age and social grade of the parent than to the age of the child (i.e. the perceived importance of computers increases with the age of the child): 61% of those with children aged under 5 agree with this statement compared to 84% of those with children aged 6-10 and 91% of those with children aged 11-15.
[image:28.595.87.501.427.712.2]As in 2000, computer skills are more likely to be seen as important for work now or in the future by AEFAs/PPMAs and WCBMs. Those who work in CEGH, CEHU and NHMC ACORN groups are more likely to be in manual (C2D) employment than those in the WCBM, AEFA and PPMA ACORN groups. Thus computers are likely to be less directly relevant to their work.
Figure 9
AGREEMENT WITH VIEWS ABOUT COMPUTER SKILLS – ACORN GROUPS
AEFAs / PPMAs
NHMCs WCBMs CEHUs /
CEGHs
Base: All Adults 215 431 177 196
% % % %
Computer skills are essential
to my work now 59 26 42 29
Computer skills will be essential to getting on in my job/ getting a new job
65 43 56 38
Base: All with children under
16 97 136 50* 68
% % % %
Computer skills are essential
to my children’s work now 69 76 76 74
Computer skills will be essential to my children’s work in the future
100 97 98 97
5
OWNERSHIP OF ICT MEDIA
5.1
Change in ownership of ICT media
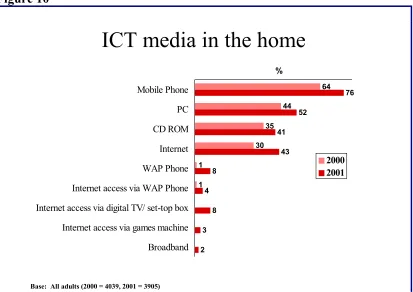
[image:30.595.98.511.267.559.2]Ownership of mobile phones, personal computers, CD ROMs and access to the Internet from the home have all increased since 2000. Although still small, ownership of WAP phones (and Internet access via WAP phone) has also increased since last year.
Figure 10
64 44
35 30
1 1
76
52 41
43 8
4
8 3
2
Mobile Phone PC CD ROM Internet WAP Phone Internet access via WAP Phone Internet access via digital TV/ set-top box Internet access via games machine Broadband
%
2000 2001
ICT media in the home
Base: All adults (2000 = 4039, 2001 = 3905)
Just over half of all adults have a PC in their home - this varies from 77% of AB respondents to 26% of DE respondents. Compared to 2000, growth in PC ownership has been higher in ABC1 households than C2DE households. Access to the Internet at home has increased among all social grades and growth has been fastest in C1 and C2 households. Growth in percentage points has been slowest in DE households - 20% of people of DE social grade now have access to the Internet at home, compared to 11% in 2000.
Figure 11
PC & INTERNET OWNERSHIP BY SOCIAL GRADE
% with PC in the home % with Internet access in the home
2000 2001 Growth 2000 2000 Growth
% % % points % % % points
Total 44 52 +8 30 43 +13
AB 68 77 +9 57 68 +11
C1 56 66 +10 39 55 +16
C2 43 48 +5 25 40 +15
DE 22 26 +4 11 20 +9
Again, presence of children under 16 in the household is a factor in determining levels of ICT ownership. For instance, 92% of households with children under 16 have mobile phones (83% in 2000), compared to 68% in households without children (55% in 2000). PC and Internet access at home appear to be linked to the age of the children: households with older children present are more likely to own these media.
5.2
Ownership of ICT media – ACORN groups / MDI
analysis
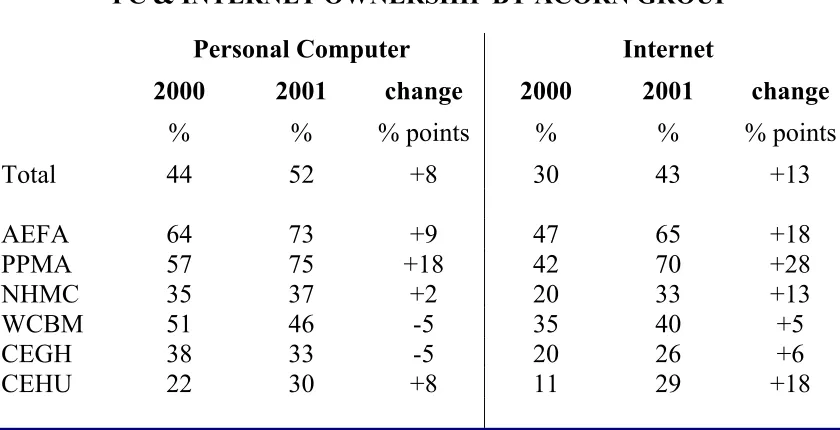
[image:32.595.93.513.237.452.2]Ownership of ICT media shows significant differences by ACORN grouping, with AEFAs and PPMAs more likely to own these media than other groups.
Figure 12
PC & INTERNET OWNERSHIP BY ACORN GROUP
Personal Computer Internet
2000 2001 change 2000 2001 change
% % % points % % % points
Total 44 52 +8 30 43 +13
AEFA 64 73 +9 47 65 +18 PPMA 57 75 +18 42 70 +28 NHMC 35 37 +2 20 33 +13 WCBM 51 46 -5 35 40 +5 CEGH 38 33 -5 20 26 +6 CEHU 22 30 +8 11 29 +18
As with usage of ICT media, the strongest growth in terms of ownership has occurred among PPMAs. 75% of this group now own a personal computer in the home, compared to 57% in 2000. Growth has also taken place among CEHUs. There has been a decline in the proportion of CEGHs and WCBMs owning a computer in the home compared to 2000, although this is not statistically significant.
Mobile phone ownership has increased among all ACORN groups except CEGHs. As a consequence, the gap between the two council estate ACORN types has narrowed with 68% of CEHUs and 74% of CEGHs having a mobile phone. Mobile phone ownership is very high among AEFAs (94%) and PPMAs (84%), following strong growth on 2000.
Figure 13
64
75
68
62
63
53
74 76
94
84
74
76
66
74
Total
AEFA
PPMA
NHMC
WCBM
CEHU
CEGH
%
2000 2001
Ownership of mobile phones
Base: All adults (2000 = 4039, 2001 = 3905)
Take up of new ICT media has been higher among AEFAs and PPMAs than CEHUs and CEGHs. For instance, 19% of PPMAs have a WAP phone compared to 6% of CEHUs.
6
USAGE AND BARRIERS TO USE OF
COMPUTERS AND THE INTERNET
6.1
Frequency and purpose of use
6.1.1 Frequency of Use
[image:34.595.91.509.427.689.2]There is a greater percentage of people using their computer daily in 2001 compared to 2000 (61% v 55%). Similar growth is evident in Internet use - 45% of those who use the Internet nowadays say that they use it daily compared to 35% in 2000. Males, younger age groups and those of ABC1 social grade are more likely to use computers and the Internet daily compared to females, older ages and those of C2DE social grade. This is illustrated with reference to the Internet in Figure 14, below.
Figure 14
USE THE INTERNET DAILY
% saying use Internet daily
2000
% saying use Internet daily
2001
Change in % points
Total 35 45 +10
Male 42 50 +8
Female 28 38 +10
16-34 35 47 +12
35-54 37 45 +10
55+ 29 36 +7
AB 44 53 +9
C1 35 49 +14
C2 28 35 +7
As can be seen from the table above, growth in daily Internet use has occurred among all groups but has been greater among females, younger age groups and higher social grades, particularly C1 respondents.
ACORN groups have not been included in this analysis due to small sample sizes, especially among the council estate groups, in which PC and Internet ownership is lower.
6.1.2 Average time spent on computers/the Internet per week
[image:35.595.99.512.371.647.2]The average number of hours per week spent on the computer (excluding playing games) has increased from 12.5 hours in 2000 to 14.2 hours in 2001. A similar increase is evident in Internet usage, from 5.4 hours per week in 2000 to 7.0 hours in 2001.
Figure 15
Hours per week spent using a computer
Base: All adult who use a personal computer at least once a week (2000 = 1841, 2001 = 2043)
9.8 14.2 15.8 12.3 13.0 17.5 13.6 15.7 10.9 16.5 16.1 10.8 15.0 13.3 9.3 8.9 9.9 11.0 13.8 12.5 6.7 16.4 12.7 12.8 7.1 9.6 0 2 4 6 8 10 12 14 16 18 20
Total Mal e Femal e 16-2 4 25-3 4 35-4 4 45-5 4 55-6 4
65+ AB C1 C2 DE
Figure 16
Hours per week spent using Internet
Base: All adults who use the Internet at least once a week (2000 = 1381, 2001 = 1768)
5.4 6.0 4.5 5.5 3.7 4.3 6.1
5.0 5.0 5.3 7.0 8.3 5.3 7.9 8.3 6.7 6.5 4.9 3.5 6.4 7.4 6.8 7.6 6.3 5.4 4.6 0 1 2 3 4 5 6 7 8 9
Total Mal e Femal e 16-2 4 25-3 4 35-4 4 45-5 4 55-6 4
65+ AB C1 C2 DE
2000 2001 Hours
On average, men spend more time on computers and the Internet than women. Usage among men has grown more than among women. For instance, in 2001 men spend 3.5 hours per week more on computers than women; in 2000 the gap was 2.8 hours.
There are variations in terms of social grade relating to computer and Internet use. All social grades spend a greater length of time per week on computers than in 2000 apart from those of social grade DE. The largest growth is among C1 respondents, from 13.3 hours to 16.6. This has led to a clear ABC1/C2DE split. On average, people of ABC1 social grade spend around 6 hours per week more than C2DE respondents on their computers (excluding time spent playing games).
The picture is different in terms of time spent on the Internet however. As with computer use, growth has been strong among C1 respondents but it has also increased among C2 respondents (5.0 to 6.8 hours) and those from social grade DE (5.3 to 7.6 hours). Thus in contrast to 2000, DE respondents spend the most amount of time on the Internet each week and AB respondents the least.
People without children in the household are more likely to use their computer daily and also spend more time on it per week - 15.2 hours compared to 12.9 hours for households with children under 16 present. In households with children under 16, usage by adults is higher where the oldest child is aged between 0 and 5. This could be in part due to older children using the computer in the household, resulting in the adults having less of an opportunity to use it.
Ethnic minority groups tend to spend less time on computers but more time on the Internet per week than average. For instance, Asian respondents spend 12.1 hours per week on computers, compared to 14.4 hours for White respondents. In contrast, Asian respondents spend 8.7 hours on the Internet compared to 6.9 hours for White respondents.
6.1.3 Location of use
16 to 24 year olds and ethnic minority groups are more likely to use computers at school/college/university. In terms of social grade, ABC1 respondents are more likely than C2DE respondents to use computers both at home and work. 12% of DE respondents use computers at another person’s home. Other locations of computer use have experienced no substantial change - 10% college/university, 5% school, 5% another person’s home, 3% public library, 2% Internet café, 1% community or voluntary organisation and 1% government office.
2% of adults claim to have used a computer at a Learndirect centre. This is lower for a UK online centre, at 1%.1
6.1.4 Purpose of use
Access to e-mail and the Internet are the most popular reasons for using a computer. Of those who use a PC, 62% use it for e-mail and 60% for the Internet. This is an 8 percentage point increase for both on 2000. The other major claimed use of computers is for work, although at 51% this is lower than the 54% in 2000.
The main uses of the Internet are for sending or receiving e-mails (66%), seeking information about work (37%) and shopping/finding out about goods or services (35%). Figures for these are slightly lower in 2001 than in 2000, although this is probably due to a change in question, with more specific options available to choose from in 2001, resulting in a decrease in the mentions for these categories.
As we have already seen with other ICT measures, usage is lower among lower social grades. People of AB social grades are the most likely to use computers for e-mail, the Internet and work with C1 respondents at a similar level. However, C2, D and E respondents are less likely to use computers for these activities (see Figure 17, overleaf).
1 Learndirect and UK online centres are still currently being established, hence a low usage is not
Figure 17
What the computer is used for
0 10 20 30 40 50 60 70 80 90 100
AB C1 C2 DE
E-mail Internet Work
%
Social Grade
Base: All adult who use a personal computer at least once a week (2000 = 1841, 2001 = 2043)
Differences by social grade are also evident in what people use the Internet for:
Figure 18
USES OF THE INTERNET BY CLASS
ABC1 C2DE Difference
Base: All adults who use the Internet
(1768) 1100 668
% % % points
Sending/receiving e-mails 71 56 15
Seeking information for work 44 22 22
Shopping 39 26 13
Weather/travel 31 19 12
Banking 28 14 14
Theatre/arts information 28 15 13
For most categories, there are more people of ABC1 social grades using the Internet than from C2DE social grades. The biggest difference between the two is in seeking information for work, followed by sending/receiving e-mails and banking/finance. C2DE respondents use the Internet more than ABC1 respondents for some purposes, namely playing/downloading games (20% compared to 17% of ABC1 respondents) and chat rooms (15% against 11%).
6.1.5 Use for learning and development
[image:41.595.95.510.272.542.2]Looking at the use of computers for children’s learning and development (Figure 19), around 30% of households with children under 16 use computers for helping with their children’s schoolwork, general knowledge and for developing their computer skills. In terms of general knowledge/learning and computer skills, it is the households with children aged between 6 and 10 where usage of computers for these tasks is higher.
Figure 19
31
29
31 21
25
30 37
38
39 38
28
26
Schoolwork
General knowledge /
learning
Computer skills
% who use computer
hshlds with children children 0-5 children 6-10 children 11-15
Use of computers for child’s learning
Base: All adults who use a personal computer with children in household (764)
There is a split by social grade in using computers for learning. ABC1 respondents are more likely than C2DE respondents to use computers for accessing electronic reference materials (31% compared to 17%) and for learning related to their jobs (26% compared to 14%). However, using computers for independent learning is not so disparate, with 27% of ABC1 respondents doing this compared to 24% of people of C2DE social grades.
Figure 20
32
26
26
21
18
35
31
27
26
20
28
17
24
14
16
Developing your own computer skills
Using electronic reference materials
learning for own interests
learning related to job/career
school/college work
%
Total ABC1 C2DE
Use of computers for own learning
Base: All adults who use a personal computer (2043)
Looking at educational uses of the Internet, 28% of people who use the Internet do so for learning independent of work, college or school (see Figure 21). This is slightly higher than the percentage who use it for information for learning related to job/career (26%) and information for school/college work (24%). As the chart below indicates, people aged between 16 and 24 are the most likely to use the Internet for educational/learning purposes, whilst DE respondents are less likely to do this. These two groups showed the greatest variation from the total population in terms of using the Internet for educational purposes.
Figure 21
28
26
24
13
9
32
31
46
17
15 22
16
17
9
6
Learning for own interests
Seeking info for study/learning related to career
Seeking info for school/college work
Finding out about courses/learning opportunities
Using online test facilities/tutorials etc
%
total 16-24 DE
Educational uses of the Internet
Base: All adults who use the Internet (1768)
In terms of Internet use, PPMAs are the most likely group to use it for seeking information for school/college work (37%) and for study/learning related to job/career (40%). In contrast to computer use, CEHUs/CEGHs are the least likely to use the Internet for learning for their own interests - 18% compared to 37% of AEFAs and 33% of PPMAs.
6.2
Propensity to use computers and the Internet in the
future
All those who said that they do not use computers were asked how interested they were in using computers in the future: 30% of non-users say that they are “very interested” or “fairly interested”, compared to 28% in 2000. In relation to the Internet, 32% of non-users say that they are very/fairly interested in using it in the future, compared to 31% in 2000.
The propensity to use computers / the Internet is greatest among the younger age groups. For instance, for computers, 67% of non-users aged 16-34 say they are very/fairly interested, 39% aged 35-54 and 14% aged 55+. Non-whites are also more likely to be interested in future use compared to White respondents. 57% of Black/Asian non-users say they are fairly/very interested in using a computer in the future, compared to 29% of White non-users.
Figure 22
28
32
34
26
39
22
32 30
33
47
35
27
26
36
Total
AEFA
PPMA
NHMC
WCBM
CEHU
CEGH
% very/fairly interested
2000 2001
Base: All adults who do not use personal computers (2000 = 2198, 2001 = 1862)
Interest in using a PC in the future
PPMA non-users show the most interest in using a computer in the future. This has increased between 2000 and 2001 from 34% to 47% very/fairly interested. Interest among NHMCs has also increased since last year (35% from 26%) whilst interest among WCBMs has fallen (27% from 39%). Interest among the two council estate ACORN groups has increased slightly, although 60% of CEHUs say that they are not at all interested in using a computer in the future, the highest of any ACORN group.
6.3
Barriers to use
6.3.1 Standard Demographic Analyses
Barriers to use are similar for both computers and the Internet.
Current users
The main barrier to using computers and the Internet more often among current users is that they consider that they do not have sufficient time (45% say this for computers and 44% for Internet). This is no change from 2000. Lack of time is more likely to be an issue among people aged between 25 and 44 and those with children aged under 16 in the household.
18% of DE respondents say that they are prevented from using a computer more often because they do not own one - twice as many as for the whole computer using population (9%). This implies that people of this social grade are less likely to have access to a computer at home and so if they are going to use a computer they are more likely do so outside of the home.
Non-users, interested
Figure 23
44
18
12
11
11
10
2
11
41
19
8
13
11
12
3
7
Cost Do not have access (anymore) No need for a computer Not computer literate Not got around to it No time/too busy Someone else uses it Other
%
2000 2001
Why people do not use a computer at the moment
Base: All adults who do not use a computer nowadays but are interested in using them in the future (2000 = 618, 2001 = 568)
17% do not use the Internet but are interested in using it in the future. The main reasons they give (unprompted) for not using it at the moment are that they do not have a computer (52%) and the perceived cost (26%). This is a similar picture to last year.
Non-users, not interested
[image:48.595.99.509.256.525.2]31% of the population are not interested in using a computer and 34% are not interested in using the Internet. The main reason given is that computers / the Internet does not appeal to them (55% for computers and 66% for the Internet). 30% of respondents do not use computers because they say they are too old (50% of those aged 65 and older). Fewer people in 2001, compared to 2000, say that they do not need to use a computer or the Internet.
Figure 24
53
32
21
8
5
12
55
30
18
7
5
9
Not interested/doesn't appeal
Too old
Do not need to use a computer
Cannot afford it
No time/too busy
Other
%
2000 2001
Reasons for lack of interest in using a computer
Figure 25
65
21
21
9
8
7
2
6
66
21
17
5
6
5
2
3
Not interested/doesn't appeal Too old Do not need to use the Internet Don't have necessary equipment Don't know how to use Internet Cost/Cannot afford it Worried about unsuitable sites Other
%
2000 2001
Reasons for lack of interest in using the Internet
Base: All adults who do not use the Internet nowadays and are not interested in using it in the future (2000 = 1785, 2001 = 1408)
All non-users
Figure 26 34 34 29 26 22 22 17 16 14 11 6 33 26 23 25 17 18 15 9 10 9 5
I’m not interested in computers I have no need to use a computer I cannot afford to buy a computer I don’t know anything about computers I do not know how to use one I’m too old to start to use one I do not know how to get started I can do my work without one Computers are far too complicated for me I haven’t got the time to use one I’d be scared to use a computer
%
2000 2001
Reasons for not using a computer
[image:50.595.95.511.429.704.2]Base: All adults who do not use personal computers nowadays (2000 = 2198, 2001 = 1862)
Figure 27 39 23 23 19 18 16 16 14 11 11 5 36 16 22 16 14 15 14 8 9 10 4
I’m not interested in using it I cannot afford to buy equipment I do not know anything about it I do not know how to use it It is too expensive to use I do not know how to get started I'm too old to start to use it I can do my work without it It sounds far too complicated for me I haven’t got the time to use it I’d be scared to use it
%
2000 2001
Reasons for not using the Internet
Disinterest is the main reason for not using a computer (33%) and the Internet (36%), although both of these are lower than in 2000. Compared to last year, there has been a fall in the proportion of non-users saying that they have no need to use a computer (from 34% to 26%). Cost appears to be less of a factor in 2001 than in 2000: 23% say that they cannot afford a computer (29% in 2000), 16% say that they cannot afford the equipment for the Internet (23% in 2000), and 14% say that the Internet is too expensive to use (18% in 2000). There is also a general decrease in the percentage of people who say that they do not use a computer or the Internet because of technical aspects, such as not knowing how to use it or get it started.
Figure 28
REASONS GIVEN FOR NOT USING A COMPUTER
Base: All Adults who do not use a personal computer (1862)
% not
interested
% no need to use
% cannot afford
% don’t know about
Total 33 26 23 25
16-34 13 16 47 14 35-54 33 26 25 24 55+ 39 30 15 29
ABC1 32 33 16 20 C2DE 33 23 26 26
Children 20 15 36 19
No children 36 29 20 26
Figure 29
REASONS GIVEN FOR NOT USING THE INTERNET
% not interested % don’t know
anything about % cannot afford equipment
Total 36 22 16
16-34 18 10 31
35-54 35 21 17
55+ 43 27 10
ABC1 37 19 10
C2DE 36 23 19
Children 26 14 25
No children 39 24 13
6.3.2 ACORN Group Analysis
Current users
Non-users
Sample sizes for interested non-users and uninterested non-users by ACORN group are too small for robust analysis. However, it is possible to look at the reasons all non-users give, from a list of eleven, for not using a computer by ACORN group (nb: combining AEFAs and PPMAs, Figure 30, below).
Figure 30
REASONS FOR NOT USING A COMPUTER (PROMPTED) – ACORN GROUPS
Total AEFA/ PPMA
NHMC WCBM CEHU CEGH
Base: All non-users
1800 53 254 75 58 58
% % % % % % I’m not interested
in using computers
33 28 32 28 27 30
I have no need to use a computer
26 17 27 18 14 12
I don’t know anything about computers
25 11 25 16 45 23
I cannot afford to buy a computer
23 6 22 18 18 30
I’m too old to start to use one
18 2 20 15 9 4
I do not know how to use one
17 6 19 12 21 11
I do not know how to get started
15 15 22 7 15 14
Computers are far too complicated for me
10 4 11 4 11 7
I can do my work without one
9 6 13 13 9 6
I haven’t got the time to use one
9 6 11 7 7 10
I’d be scared to use a computer
[image:54.595.92.503.283.688.2]This table shows that there are a similar number of people from each group who are not interested in using computers. CEHUs and CEGHs are less likely (than in 2000) to say that they have no need to use a computer (14% and 12%), a marked contrast to last year (46% and 26%). 45% of CEHU non-users say that they do not know anything about computers, 20% above the average and up from 27% last year. As might be expected from results noted earlier in this report, cost is an issue for more CEGHs (30%) but is less of a concern for CEHUs (18%, down from 40% in 2000)
NHMCs are close to the average for most of the reasons, although slightly more than average of this group say that they are too old to start to use a computer and do not know how to get started. The AEFA/PPMA group tends to be lower than average, especially when related to cost and expertise/knowledge. WCBMs are also lower than average for most of the reasons for not using a computer.
Figure 31
REASONS FOR NOT USING THE INTERNET (PROMPTED) – ACORN GROUPS
Total AEFA/ PPMA
NHMC WCBM CEHU CEGH
Base: All non-users 2079 66 280 87 63 61
% % % % % % I’m not interested in
using it
36 30 38 30 30 28
I don’t know anything about it
22 9 23 18 39 32
I cannot afford to buy the equipment
16 15 17 12 15 20
I do not know how to use it
16 9 19 8 13 10
I do not know how to get started
15 14 20 4 15 13
I’m too old to start to use it
14 5 14 11 11 4
It is too expensive to use
14 9 14 12 9 7
I haven’t got the time to use it
10 5 11 9 11 11
It sounds far too complicated for me
9 2 10 4 5 5
I can do my work
without it 8 6 9 9 8 5
I’d be scared to use it 4 3 6 2 1 1
[image:56.595.88.506.153.500.2]6.4
Incentives to use computers and the Internet
45% of respondents are non-users of computers, compared to 52% in 2000. The number of non-users has decreased slightly among all age groups - from 32% to 28% among 16-34s, 40% to 32% among 35-54s, and 82% to 76% among people aged 55 and over.
[image:57.595.98.509.389.640.2]All non-users were asked without prompting what, if anything, might encourage them to use a computer in the future (Figure 32, below). 55% say that nothing will encourage them, slightly more than in 2000 (52%). Older respondents are more resistant to computer use, particularly over 55s. However, this year has also seen an increase compared to 2000 in the proportion of 35 to 54 year olds saying ‘nothing’. In contrast, there are fewer 16 to 24 year olds saying ‘nothing’ this year compared to last (15% v 23%).
Figure 32
52
23
16
25
43
62
78 55
15
14
33
51
65
79
Total
16-24 25-34 35-44 45-54 55-64 65+
%
2000 2001
People saying ‘Nothing’ would encourage them
to use a computer in the future
This pattern is very similar with reference to Internet use - 51% of non-users say that nothing would encourage them compared to 45% in 2000. Resistance has decreased among 16 to 34 year olds but has increased in 2001 among those aged 35 or more.
The main incentives for both computer and Internet use are, as last year, cost related. 17% mention free/cheap machines/ software and 9% free/cheap lessons as incentives for using computers in the future. Similarly, for Internet use, 24% mention free/cheaper access and 13% free/cheap lessons, both of which are higher than in 2000. These are more likely to be mentioned by the younger non-users than by older non-users.
There are some differences by social grade. AB respondents are less likely than other groups to be encouraged by cost incentives. Slightly more people from ABC1 social grades would be encouraged if they had more time to spend on computers and the Internet whilst more C2DE respondents would be encouraged if their children needed it.
Of those with children under 16 in the household, 23% say that they would be encouraged to use the Internet if they needed it for their children/school work, down from 30% last year. This is not as important as free/cheap access, which is mentioned by 42% of this group.
Looking at the ACORN groups, CEHUs are the most resistant to future computer and Internet use. 60% of CEHU non-users say that nothing will encourage them to use a computer in the future (64% in 2000) and 62% of this group say that nothing will encourage them to use the Internet in the future (53% in 2000). However, resistance has also increased between 2000 and 2001 among WCBMs, from 44% to 60% for computers and from 36% to 58% for the Internet. 50% of CEGHs say nothing will encourage them to use a computer in the future and 48% of this group say that nothing would encourage them to use the Internet, also up from 2000 (from 36% and 31% respectively). Resistance to computers has decreased among AEFAs/PPMAs and NHMCs but resistance to the Internet has increased among these groups.
7
SUMMARY OF ACORN GROUPS: USAGE
OF AND ATTITUDES TO ICT MEDIA
7.1
Council Estate Residents, Greatest Hardship
(CEGHs)
CEGHs are typically lone parents, with high unemployment. Ownership and use of ICT media is low, with the exception of the mobile phone. ICT media are seen as not particularly relevant to their current position and unavailable due to cost. However, CEGHs are aware that ICT skills will become more necessary in many aspects of life, particularly for their children. Non-users in this group are more likely than average to be interested in using computers or gaining access to the Internet. They are also more likely than other groups to cite the benefits to their children. However, perceived cost and lack of access are quoted as barriers.
7.2
Council Estate Residents, High Unemployment
(CEHUs)
7.3
White Collar Workers, Better-Off Multi-Ethnic
Areas (WCBMs)
WCBMs are defined as young families and white collar workers in home owning multi-ethnic areas. Typically, they feel that ICT does not play much of a role in their lives at the moment, although they seem aware of changes in the job market relating to ICT. Ownership and use of ICT media is below average; aspiration towards ownership and use is above average. Among ICT users, use for college work or information for study/ learning is higher than average. Cost is still seen as the major barrier to use of ICT.
7.4
New Home Owners, Mature Communities (NHMCs)
NHMCs are mainly blue collar workers in predominantly home owning areas. They include both new homeowners and more mature, established owner occupiers. Use and ownership of ICT media among NHMCs are comparable to those among CEGHs and CEHUs. The level of interest in acquiring relevant skills and making use of such media is low; cost is seen as a significant barrier to greater computer use.
7.5
Prosperous Professionals, Metropolitan Areas
(PPMAs)
7.6
Affluent Executives, Family Areas (AEFAs)
8
SUMMARY BY MDI: USAGE OF AND
ATTITUDES TO ICT MEDIA
Differences in results by MDI are seen at the extremes of the scale. Those living in wards in the middle two quartiles tend to have results close to the average. Those with an MDI in the lowest quartile (that is, a low level of deprivation) tend to have higher levels of ICT access and use while those in wards in the highest quartile record low levels of access and use.
8.1
Use of ICT
77% of those in wards in the lowest MDI quartile say they have used a personal computer at some time. The percentage for wards in the middle two quartiles is 66%. This falls to 60% for wards for the highest quartile. Similar differences are seen for use of CD-ROM (66%, 53%, 47%) and for Internet use (68%, 57%, 52%). Use of other ICT does not vary by MDI.
There is a similar pattern by MDI in current use of personal computers, CD-ROMs and the Internet in that variation is seen at the extremes of the scale. However, use of other ICT media (such as mobile phones) does not vary significantly by MDI. To illustrate the pattern, 68% of those living in wards with an MDI in the lowest quartile say that they use a personal computer nowadays. This compares to 51% of those in wards in the highest quartile. Similarly, 62% of those in wards in the lowest quartile say they use the Internet nowadays compared to 44% of those in the highest quartile.
8.2
Presence of ICT in the home
8.3
Attitudes to computers
Those in the lowest MDI quartile are more likely than others to say that “Computer skills are essential to my work now” (46% v 37%). There are no clear differences by MDI in the percentages saying that “Computer skills will be essential to getting on in my job / getting a new job” or in the perceived importance of being able to use computers for life in general. However, there are some differences in the claimed computer skill levels of the respondents. Those living in wards in the lowest MDI quartile are more likely than others to say they are of Intermediate, Advanced or Expert level (59%), while those in wards in the highest quartile are the least likely to rate themselves as highly as this (41%).
Also, there are no significant differences by MDI in the perceived importance of computers for children’s work now or in the future.
8.4
Barriers to ICT use
Looking at those who are not using computers at the moment, differences in the nature of the barriers are seen at the extremes of the MDI scale. For those in wards in the lowest quartile, the main barrier (without being prompted with a list of possible barriers) is that they do not have access to a computer (27%). Cost is mentioned by 8% of this group. However, for those where the MDI is in the highest quartile, perceived cost considerably outweighs all the other potential barriers: 51% say that this prevents them from using a computer at the moment.
Among current users, 12% of those in the highest quartile say that lack of a computer in the home prevents them from making greater use of computers. This applies to 7% of the rest of the English computer users.
Among Internet users, reasons for not making more use of the Internet are similar across the MDI quartiles. Speed of connection shows slight differences, in that those where the MDI in the lowest quartile are more likely to mention this than those in most deprived quartile (16% v 6%).
Among those non-Internet users who are interested in using the Internet, two barriers to use show variation by MDI. Perceived cost is more of a barrier for those in the most deprived areas (35% of those in the highest quartile mention cost compared to 14% in the lowest quartile). Claimed lack of knowledge is less of a barrier in the most deprived quartile (11%) than in the least deprived quartile (24%).
APPENDIX A
APPENDIX A – METHODOLOGY
The 2001 survey was conducted between 14th and 25th November 2001 on Taylor Nelson Sofres’ RSGB Omnibus. The survey was conducted amongst a nationally representative sample of 3905 adults, with quotas placed on sex, age and working status. During analysis, weighting was applied to correct for any sampling variation in the profile of respondents (see Appendix D for sample profile by ACORN group).
The fieldwork was conducted by Taylor Nelson Sofres’ dedicated field unit, Specialist Field Resources (SFR). Interviewers used a ‘random location’ sampling method during fieldwork, more details of which are given below. Respondents were interviewed at home using face-to-face Computer Assisted Personal Interviewing (CAPI). Interviewing and back-checking procedures were carried out in accordance with the Market Research Society Interviewer Quality Control Scheme (IQCS).
RSGB RANDOM LOCATION SAMPLING METHOD
A unique sampling system has been developed by Taylor Nelson Sofres for its own use. Utilising 1991 UK Census small area statistics and the Post Office Address File (PAF), the eligible area of the country has been divided into 600 areas of equal population. The areas within each Standard Region were stratified into population density bands, and within band in descending order by percentage of population in socio-economic Grade’s I and II.
Each primary sampling unit is divided into two geographically distinct segments, each containing as far as possible, equal populations. The segments comprise aggregations of complete postcode sectors. Within each half (known as the A and B halves) postcode sectors have been sorted by the percentage of the population in socio-economic groups I and II. One postcode sector from each primary sampling unit is selected for each Omnibus, alternating on successive selections between the A and B halves of the primary sampling unit, again to reduce clustering effects. For each wave of interviewing each interviewer is supplied with two blocks of 100 addresses, drawn from different parts of the sector. Addresses are contacted systematically with three doors being left after each successful interview.
APPENDIX B
APPENDIX B - ICT OMNIBUS QUESTIONNAIRE
SHOW SCREEN - MULTI CHOICE
Q.1 Which, if any, of these have you heard of?
01: PC\PERSONAL COMPUTER 02: CD ROM
03: INTERNET 04: MOBILE PHONE 05: WAP PHONE
06: INTERNET ACCESS VIA WAP PHONE
07: INTERNET ACCESS VIA A DIGITAL TV OR SET TOP BOX 08: INTERNET ACCESS VIA A GAMES MACHINE
09: BROADBAND 10: NONE OF THESE (DK)
SHOW SCREEN - MULTI CHOICE
Q.2a And which, if any, have you ever used?
(List as Q.1)
(Ask Q.2b if any code 01-09 at Q.2a. Others to Q.3a)
SHOW SCREEN - MULTI CHOICE
Q.2b And which, if any, do you use nowadays?
(List items coded at Q.2a)
SHOW SCREEN - MULTI CHOICE
Q.3a And which, if any, do you have in your home? <