Elsevier Editorial System(tm) for International Journal of Production Economics
Manuscript Draft
Manuscript Number: IJPE-D-17-01465R2
Title: The Effect of Lean Methods and Tools on the Environmental Performance of Manufacturing Organisations
Article Type: Research paper
Keywords: Autonomation; JIT; Kaizen/CI; Green Lean; TPM; VSM
Corresponding Author: Professor Jose Arturo Garza-Reyes, BSc, PgCert, MSc, MBA, PhD
Corresponding Author's Institution: The University of Derby
First Author: Jose Arturo Garza-Reyes, BSc, PgCert, MSc, MBA, PhD Order of Authors: Jose Arturo Garza-Reyes, BSc, PgCert, MSc, MBA, PhD; Vikas Kumar; Sariya Chaikittisilp; Kim Hua Tan
Abstract: Evidence suggests that lean methods and tools have helped manufacturing organisations to achieve operational excellence, and in this way meet both traditional and contemporary organisational objectives such as profitability, efficiency, responsiveness, quality, and customer satisfaction. However, the effect of these methods and tools on
environmental performance is still unclear, as limited empirical research has been conducted in this field. This paper therefore investigates the impact of five essential lean methods, i.e. JIT, autonomation,
kaizen/continuous improvement, total productive maintenance (TPM) and value stream mapping (VSM), on four commonly utilised measures for the compliance of environmental performance, i.e. material use, energy consumption, non-product output, and pollutant releases. A correlation analysis modelled the relationship and effect of these lean methods on the environmental performance of 250 manufacturing organisations around the world. Structural equation modelling (SEM) was used as a second pronged verification approach to ensure the validity of the results. The results indicate that TMP and JIT have the strongest significance on environmental performance, whereas kaizen/continuous improvement only showed an effect on the use of materials and release of pollutants. Autonomation and VSM did not show any impact on environmental
performance. The research holds important implications for
industrialists, who can develop a richer knowledge on the relationship between lean and green. This will help them formulate more effective strategies for their simultaneous or sequential implementation. The paper extends our knowledge in the lean and green field by helping us to
establish and explain the given relationships between five of the most important and commonly used lean methods and the environmental
Prof. Ou Tang 26/03/2018 Linköping Universitet,
Linköping, Sweden
RE: Submission of a revised version of our article IJPE-D-17-01465.R1
Dear Prof. Ou Tang
Please, find attached a copy of a second revised version of our article entitled “The Effect of Lean Methods and Tools on the Environmental Performance of Manufacturing Organisations”. We are very satisfied with the very positive comments we have now received from the reviewers, and have accordingly addressed the very last issue they have raised. We sincerely hope that now our article is fully ready for acceptance and publication in IJPE. We are very sure that IJPE readers will find our article interesting and useful to advance their own research and the present field. We are also sure that this will become a highly cited article.
We thank you all your support to improve and publish this article in IJPE. Please, if you require further information about the article or anything else, do not hesitate in contact me as soon as possible.
Yours thankfully
Prof. Jose Arturo Garza-Reyes Professor of Operations Management
Head of the Centre for Supply Chain Improvement Derby Business School
Responses to Reviewers
Reviewer: 1
Query 1: The authors have done a nice job with their revision. They have satisfied all but one of my concerns. Both reviewers requested that the authors assess the measurement scales for validity and reliability. The authors have provided Cronbach's alpha values as evidence of reliability and validity. Cronbach's alpha values do provide evidence of reliability but not of validity. I recommend that the authors do a formal assessment of validity (content, convergent, and discriminant). With this final addition, I am prepared to recommend acceptance. Response: We are thankful to the learned reviewer for his/her useful comments to enhance the quality of this paper. We agree with the reviewer that the Cronbach’s Alpha value just provides evidence of reliability. We have therefore now taken your suggestions on board and performed a test for validity. Since the construct items were developed based on an extensive review of the literature, which was further validated through a pilot study with five experts from industry and academia, they thus meet the content validity requirement. We have now calculated the Average Variance Explained (AVE), Composite Reliability (CR), Maximum Shared Variance (MSV) and Average Shared Variance (ASV). For convergent validity, AVE should be >.50 and CR should be >.70. The analysis shows that our constructs meet the convergent validity (see Table 3). For discriminant validity MSV and ASV should be <AVE. The analysis also shows that the constructs meet the discriminant validity (Table 3). Additions can be seen in Section 3, paragraph in red colour. We sincerely hope that with the inclusion of this analysis we have now addressed all your concerns to your satisfaction. Once more, we truly appreciate all the recommendations you have made through the review cycle of our article. These have contributed for our article be greatly improved in various aspects.
Reviewer 2:
Query 2: I thank the authors for their work. They have incorporated my comments and addressed successfully my suggestions in the revised manuscript. I still believe that their contribution is minor, but given the early understanding of the relationship between lean and sustainability, and the state of evolution in the area, this work is important and reinforces prior work.
The Effect of Lean Methods and Tools on the Environmental
Performance of Manufacturing Organisations
Jose Arturo Garza-Reyes* Centre for Supply Chain Improvement
The University of Derby
Kedleston Road Campus, Derby, UK, DE22 1GB E-mail: [email protected]
Tel. +44(0)1332593281
Vikas Kumar Bristol Business School University of the West of England Coldharbour Ln, Bristol, UK, BS16 1QY
E-mail: [email protected] Tel. +44(0)1173283466
Sariya Chaikittisilp
Warwick Manufacturing Group, The University of Warwick International Manufacturing Centre, University of Warwick
Coventry, UK, CV4 7AL
E-mail: [email protected]
Kim Hua Tan
Nottingham University Business School, The University of Nottingham Jubilee Campus, Nottingham, UK, NG8 1BB
E-mail: [email protected]
* Corresponding Author
*Title page including author details
Highlights
The effect of specific lean methods and tools on environmental performance is still unclear
The impact of five essential lean methods on four commonly utilised measures for the compliance of environmental performance is investigated
Correlation and structural equation modelling analyses from 250 companies were conducted
TMP and JIT have the strongest significance on environmental performance
Kaizen/continuous improvement only showed an effect on the use of materials and release of pollutants
1 2 3 4 5 6 7 8 9 10 11 12 13 14 15 16 17 18 19 20 21 22 23 24 25 26 27 28 29 30 31 32 33 34 35 36 37 38 39 40 41 42 43 44 45 46 47 48 49 50 51 52 53 54 55 56 57 58 59
The Effect of Lean Methods and Tools on the Environmental
Performance of Manufacturing Organisations
Abstract
Evidence suggests that lean methods and tools have helped manufacturing
organisations to achieve operational excellence, and in this way meet both
traditional and contemporary organisational objectives such as profitability,
efficiency, responsiveness, quality, and customer satisfaction. However, the effect
of these methods and tools on environmental performance is still unclear, as
limited empirical research has been conducted in this field. This paper therefore
investigates the impact of five essential lean methods, i.e. JIT, autonomation,
kaizen/continuous improvement, total productive maintenance (TPM) and value
stream mapping (VSM), on four commonly utilised measures for the compliance
of environmental performance, i.e. material use, energy consumption,
non-product output, and pollutant releases. A correlation analysis modelled the
relationship and effect of these lean methods on the environmental performance
of 250 manufacturing organisations around the world. Structural equation
modelling (SEM) was used as a second pronged verification approach to ensure
the validity of the results. The results indicate that TMP and JIT have the
strongest significance on environmental performance, whereas kaizen/continuous
improvement only showed an effect on the use of materials and release of
pollutants. Autonomation and VSM did not show any impact on environmental
performance. The research holds important implications for industrialists, who
can develop a richer knowledge on the relationship between lean and green. This *Manuscript
1 2 3 4 5 6 7 8 9 10 11 12 13 14 15 16 17 18 19 20 21 22 23 24 25 26 27 28 29 30 31 32 33 34 35 36 37 38 39 40 41 42 43 44 45 46 47 48 49 50 51 52 53 54 55 56 57 58 59 60 61
will help them formulate more effective strategies for their simultaneous or
sequential implementation. The paper extends our knowledge in the lean and
green field by helping us to establish and explain the given relationships between
five of the most important and commonly used lean methods and the
environmental performance of manufacturing organisations. No previous research
had considered the studied lean methods and environmental measures of
performance.
Keywords: autonomation; JIT; kaizen/continuous improvement; green lean;
environmental performance; SEM; TPM; VSM.
1. Introduction
Lean manufacturing has been widely implemented by manufacturing organisations to achieve
operational excellence, and in this way meet both traditional and contemporary organisational
objectives such as profitability, efficiency, responsiveness, quality and customer satisfaction
(Garza-Reyes, 2015a). Lean methods that enable the achievement of these objectives include
just-in-time (JIT), total productive maintenance (TPM), autonomation, value stream mapping
(VSM) and kaizen/continuous improvement (CI). Belekoukias et al. (2014) and Rocha-Lona
et al. (2013) consider these as the most essential methods of the lean approach. Additionally,
Shah and Ward (2003; 2007) recognise JIT, TPM, autonomation and kaizen/CI as lean
practices that are frequently perceived in the scholarly literature as describing high
performance lean manufacturers while Andreadis et al. (2017) and Womack (2006)
contemplate VSM as one of the most significant lean methods.
JIT is based on producing the right goods at the right time (Womack and Jones 2003).
This contributes in reducing space utilisation, inventory and wastes associated to the
1 2 3 4 5 6 7 8 9 10 11 12 13 14 15 16 17 18 19 20 21 22 23 24 25 26 27 28 29 30 31 32 33 34 35 36 37 38 39 40 41 42 43 44 45 46 47 48 49 50 51 52 53 54 55 56 57 58 59
piece flow, levelled production, cell manufacturing, visual control, kanban, JIT purchasing
and multifunctional employees (Belekoukias et al., 2014; Rocha-Lona et al., 2014; Kumar,
2010). On the other hand, TPM helps to optimise predictive, preventive and corrective
maintenance activities to achieve efficient and proficient production equipment (Konecny and
Thun, 2011). TPM relies on tools such as single minute exchange of die (SMED), overall
equipment effectiveness (OEE), planned maintenance, 5S, quality maintenance, autonomous
maintenance, initial control before starting production, and a safety and hygiene environment
(Rocha-Lona et al., 2013; Konecny and Thun, 2011). Furthermore, autonomation, also called
jidoka, uses tools such as visual control systems (i.e. andons), a full working system and
mistake proofing devices (i.e. poka-yokes) to reduce quality defects (Shingo, 1989).
Additionally, VSM is a lean and visual-based method, which illustrates, identifies and
measures waste that results from the incapability, inefficiencies and unreliability of money,
machines, people, information, space, time, tools and material during a production process
(Abdulmalek et al., 2007). This is supported by VSM tools that include flow diagrams and
current and future state maps. Finally, CI, or kaizen, is one of the key processes in a lean
organisation. The aim of kaizen is to remove waste through the incremental and continuous
improvement of operations. Kaizen acts as a platform for the sustainment of lean once that it
has been embedded as part of the culture of an organisation. Tools which are commonly
associated to the kaizen strategy include 5S, continuous flow, run charts, 5whys,
brainstorming, data check sheet, kanban, Pareto chart, Gantt chart, mistake proofing, process
maps and VSM (Belekoukias et al., 2014; Rocha-Lona et al., 2013; Bhuiyan and Baghel,
2005).
Since its conception several decades ago, lean manufacturing has become the most
influential paradigm in manufacturing (Forrester et al., 2010), with strong evidence
1 2 3 4 5 6 7 8 9 10 11 12 13 14 15 16 17 18 19 20 21 22 23 24 25 26 27 28 29 30 31 32 33 34 35 36 37 38 39 40 41 42 43 44 45 46 47 48 49 50 51 52 53 54 55 56 57 58 59 60 61
et al., 2004). However, the rise of concerns for the environment has forced manufacturing
organisations to not only aim at achieving operational excellence but also to rethink how their
operations and processes can become more environmentally sustainable. To this end, and
despite some studies (e.g. Zhu et al., 2005), have suggested a relatively week relationship
between green practices/performance and operational practices, where lean methods and tools
can be considered part of, the study of the simultaneous, or sequential, deployment of lean
manufacturing and green operations (hereinafter green) has emerged as a major part of the
environmental improvement agenda (Cherrafi et al., 2017; Cherrafi et al. 2016; Garza-Reyes,
2015a; Garza-Reyes, 2015b). For example, Garza-Reyes (2015a) identified and defined,
through a systematic literature review, six main research streams in the field of lean and
green. These included (1) compatibility between lean and green, (2) their integration, (3) the
integration of green lean with other approaches (e.g. six sigma, resilience, agile, etc.), (4) the
proposal of measurement methods for green lean, (5) the impact of green lean on various
measures of performance (e.g. financial, sustainability, operations, etc.), and (6) the
application of green lean in various industrial sectors and organisational functions.
Additionally, some limited research has been dedicated to investigate the impact of lean
methods and tools on various measures of environmental performance, see Section 2.
Nevertheless, the overall effect of lean methods and tools on environmental performance may
still be considered inconclusive due to the nature of the research conducted. For instance, the
research discussed in Section 2 has been mainly concentrated on very specific lean methods
and tools; that is, it has not involved all those which nowadays are recognised as essential
components of the lean approach (i.e. JIT, TPM, autonomation, VSM and kaizen/CI)
(Belekoukias et al., 2014; Rocha-Lona et al., 2013). In the same way, the measures of
environmental performance selected to investigate the effects of lean practices vary
1 2 3 4 5 6 7 8 9 10 11 12 13 14 15 16 17 18 19 20 21 22 23 24 25 26 27 28 29 30 31 32 33 34 35 36 37 38 39 40 41 42 43 44 45 46 47 48 49 50 51 52 53 54 55 56 57 58 59
Therefore, to complement and expand the limited body of knowledge on the effects that
lean manufacturing has on the environmental performance of organisations, this paper
investigates the impact of the main methods and tools of lean manufacturing (i.e. JIT, TPM,
autonomation, VSM and kaizen/CI) on four commonly utilised measures for the compliance
of environmental performance, i.e. material use, energy consumption, non-product output and
pollutant releases (National Academy of Engineering, 1999; Ditz and Ranganathan, 1997).
These environmental measures are also comparable to some of those employed by Zhu et al.
(2008), i.e. reduction of air emission, waste water, solid waste and consumption for
hazardous/harmful/toxic materials, to assess the effect of Green Supply Chain Management
Practices on the environmental performance of Chinese manufacturers. Considering this, the
research question addressed through this research is:
- What is the effect of essential lean tools such as JIT, TPM, autonomation, VSM and
kaizen/CI on the environmental performance of manufacturing organisations as measured by
the use of material, energy consumption, non-product output and pollutant releases?
The rest of the paper is structured as follows: Section 2 discusses previous works
conducted in the field and highlights the gap in the academic literature that this investigation
fills; Section 3 presents the research methodology followed to answer the formulated research
question; the results of the correlations and structural equation modelling analyses are
outlined in Section 4; whereas these are discussed in Section 5; finally, Section 6 provides the
concluding remarks, limitations of the research and future research directions derived from it.
2. Lean manufacturing and its impact on environmental performance
Climate change, environmental degradation, and natural resources scarcity are some of the
major challenges that humankind are currently facing. As major contributors to the
1 2 3 4 5 6 7 8 9 10 11 12 13 14 15 16 17 18 19 20 21 22 23 24 25 26 27 28 29 30 31 32 33 34 35 36 37 38 39 40 41 42 43 44 45 46 47 48 49 50 51 52 53 54 55 56 57 58 59 60 61
cleaner operations and production processes. One normal starting point for developing better
strategies to support environmental sustainability is to explore the opportunities that currently
used best practices, e.g. lean, may offer to tackle environmental challenges and how they can
be adapted and implemented to meet sustainability requirements. In this context, various
authors have conceptually discussed the effects that lean manufacturing methods and tools
may have on the environment.
For instance, Vinodh et al. (2011) suggest that lean initiatives stimulate substantial
environmental benefits and that, for this reason, companies ought to ponder the
environmental impact and quantify sustainable gains associated with lean initiatives.
Mollenkopf et al. (2010) advocate that lean companies are more likely to accept
environmental innovations. Garza-Reyes (2015b) supports this argument by indicating that
the lean’s emphasis on waste reduction provides a better atmosphere to implement green
initiatives to reduce environmental wastes such excessive consumption of water, energy or
any natural resource. In addition, Garza-Reyes (2015b), Garza-Reyes et al. (2014) and
Carvalho et al. (2011) mention that some of the waste reduction objectives of lean are
‘naturally’ aligned to good environmental practices. For example, unnecessary or excessive
transportation of products and/or raw materials is one of the seven wastes tackled by lean
manufacturing. In this case, when this waste is reduced/eliminated it does not only minimise
operational costs but also the unnecessary consumption of natural resources (e.g. oil) and
CO2 emissions (Carvalho et al., 2011). This has been empirically shown by Garza-Reyes et
al. (2016), who successfully adapted lean manufacturing principles and tools to improve the
operational efficiency and environmental performance of the transport operations of a world
leader logistics organisation in Mexico. On the other hand, excessive inventory is also
considered a waste fiercely tackled by lean as it averts the rapid identification of problems,
1 2 3 4 5 6 7 8 9 10 11 12 13 14 15 16 17 18 19 20 21 22 23 24 25 26 27 28 29 30 31 32 33 34 35 36 37 38 39 40 41 42 43 44 45 46 47 48 49 50 51 52 53 54 55 56 57 58 59
requires storage, lighting, and in some cases, it also needs to be heated or chilled, all of which
have negative environmental implications (Franchetti et al., 2009). Thus, reducing or
eliminating inventory as suggested by lean will not only benefit an organisation financially
but also environmentally. All this indicates that lean can act as a catalyst for better
environmental performance, facilitating companies the deployment of environmental
practices and policies.
In contrast to the positive effects of lean on the environment argued by various authors,
some contradicting arguments can also be found in the scholarly literature. For example,
Cusumano (1994) argues that more frequents deliveries, as advocated by JIT, create traffic
congestions and hence more CO2 emissions. Lean also facilitates product variety through
more rapid kanban and setup exchanges, as well as more frequent deliveries of smaller lots of
components. This is positive from a marketing viewpoint as product variety generates higher
demand for goods, the problem is that this crafts the need to dispose replaced products
(Cusumano, 1994). This phenomenon may indicate that lean methods and tools may not
always, or in all dimensions, have a positive effect on the performance of organisations,
and/or that these need to be integrated with contemporary sustainability approaches, e.g.
Circular Economy, to offset some of its negative effects on the environment. Finally, other
aspects that may contribute to lean not having a positive effect on the environmental
performance of organisations may be related to the divergences between lean and green
initiatives argued in the scholarly literature. These include how waste is defined and customer
expectations (Garza-Reyes, 2015b; Garza-Reyes et al., 2014).
Besides the conceptual discussions presented above regarding the potential effects of the
implementation of lean methods and tools on environmental performance, a limited number
of scholars have also focused on empirically investigating this phenomenon. For example,
1 2 3 4 5 6 7 8 9 10 11 12 13 14 15 16 17 18 19 20 21 22 23 24 25 26 27 28 29 30 31 32 33 34 35 36 37 38 39 40 41 42 43 44 45 46 47 48 49 50 51 52 53 54 55 56 57 58 59 60 61
and 1996, and found strong evidence that lean, as measured by ISO 9000 adoption and low
chemical inventories, is complementary to waste reduction and pollution reduction.
Hajmohamad et al. (2013) conducted a study in Canadian manufacturing plants to understand
the roles of lean and supply management in regards to improving organisation’s
environmental performance. The result indicated that the know-how and skills gained when
applying lean principles are favourable to the adoption of environmental practices and that
those make such practices more effective. Chiarini (2014) studied the environmental impacts
of VSM, 5S, cellular manufacturing, SMED and TPM on the production processes of five
European companies. The results of the study showed that VSM can identify the
environmental impacts of production processes, 5S improve waste management and reduces
oil leakage, cellular manufacturing can decrease electricity consumption, whereas TPM can
reduce oil leakages, and emissions of dusts and chemical fumes into the atmosphere. By
contrast, no significant improvements in environmental impacts were observed from
implementing SMED. Bandehnezhad et al. (2012) investigated the effect of lean practices in
different functional areas of manufacturing firms on environmental performance. Based on a
survey of 101 manufacturing organisation in Malaysia, they found that lean practices related
to functional areas of process and equipment, human resource, product design and customer
satisfaction have positive effects on environmental outcomes. Yang et al. (2011) explored the
relationships between lean manufacturing practices, environmental management (e.g.
environmental management practices and environmental performance) and business
performance outcomes (e.g. market and financial performance). In general, the results of their
study suggested that prior lean manufacturing experiences are positively related to
environmental management practices. Rothenberg et al. (2001) examined the relationship
between lean manufacturing practices and environmental performance, as measured in terms
1 2 3 4 5 6 7 8 9 10 11 12 13 14 15 16 17 18 19 20 21 22 23 24 25 26 27 28 29 30 31 32 33 34 35 36 37 38 39 40 41 42 43 44 45 46 47 48 49 50 51 52 53 54 55 56 57 58 59
Japan. The results of the study indicate that lean and the reduction of air emissions of volatile
organic compounds are associated negatively. Also, Rothenberg et al. (2001)found that lean
practices contribute to the cleaning of solvents and paints, but it was also revealed that these
are not sufficient to meet the most stringent air regulations. Evidence to support the link
between lean and resources efficiency was also found. Finally, through empirical
observations and a survey study Klassen (2000) observed links between investment in JIT
and improved environmental performance.
Unlike these studies, this research investigates the effect of essential lean methods and
tools such as JIT, TPM, autonomation, VSM and kaizen/CI on four commonly utilised
measures for environmental compliance, i.e. material use, energy consumption, non-product
output and pollutant releases. Thus, the aim of this study is not only to complement the
previous research but also expand its reach and scope. In this way, this research fills a gap in
the knowledge as current research in this field is still limited. Figure 1 illustrates the
conceptual framework derived from the literature review and in which this study centres
around. Therefore, the overriding hypothesis formulated and tested through this study is:
H: Essential lean methods and tools such as JIT, TPM, autonomation, VSM and kaizen/CI
have a significant impact on the environmental performance of manufacturing organisations
as measured by commonly employed indicators including material use, energy consumption,
1 2 3 4 5 6 7 8 9 10 11 12 13 14 15 16 17 18 19 20 21 22 23 24 25 26 27 28 29 30 31 32 33 34 35 36 37 38 39 40 41 42 43 44 45 46 47 48 49 50 51 52 53 54 55 56 57 58 59 60 61
Figure 1. Conceptual Framework
3. Research methodology
To assess the effect of lean manufacturing on environmental performance, the association
between the environmental measures of performance studied (i.e. dependent variable) was
determined as an accrual of a number of explanatory independent variables (i.e. lean
methods).
A survey questionnaire was designed using Qualtrics software to collect data for
performing subsequent statistical analyses. The questionnaire consisted of 9 questions
divided into two sections, see Table 1. Section 1 comprised a set of general profile and TPM
VSM
Autonomation
Kaizen/CI
JIT
Materials Use Lean Methods/Tools
Energy Consumption
Non-Product Output
Pollutant Releases
Environmental Performance Measures
1 2 3 4 5 6 7 8 9 10 11 12 13 14 15 16 17 18 19 20 21 22 23 24 25 26 27 28 29 30 31 32 33 34 35 36 37 38 39 40 41 42 43 44 45 46 47 48 49 50 51 52 53 54 55 56 57 58 59
demographic questions, whereas Section 2 focused on investigating which of the lean tools,
see Table 2, the respondent’s organisations had implemented for every one of the lean
methods studied. If a company had, for example, deployed five out of the nine JIT tools, then
the extent of implementation of JIT was considered to be .555. This contributed in measuring
the extent of deployment of every lean method. In addition, Section 2 of the questionnaire
considered the perception of the respondents to investigate whether their companies had
experienced any degree of improvement in the environmental measures of performance
studied (i.e. material use, energy consumption, non-product output and pollutant releases)
from the implementation of lean. For this, the respondents estimated the percentage of
improvement achieved in every one of these environmental measures by using a Likert scale
from 0 to 100%, with increments of 5% (i.e. 0, 5, 10, etc.).
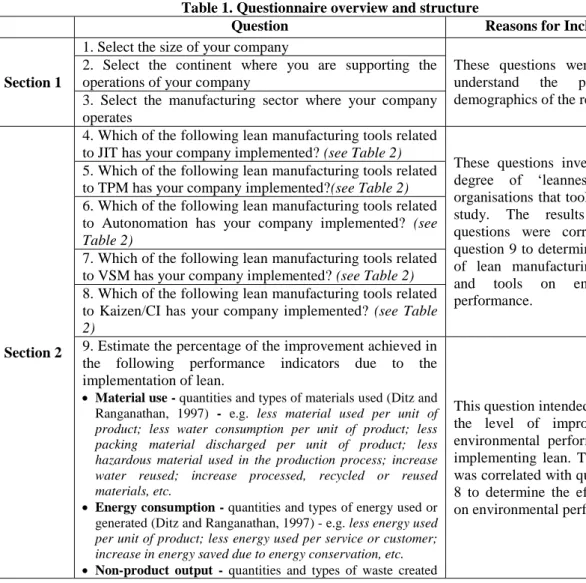
Table 1. Questionnaire overview and structure
Question Reasons for Inclusions
Section 1
1. Select the size of your company
These questions were asked to understand the profile and demographics of the respondents. 2. Select the continent where you are supporting the
operations of your company
3. Select the manufacturing sector where your company operates
Section 2
4. Which of the following lean manufacturing tools related to JIT has your company implemented? (see Table 2)
These questions investigated the degree of ‘leanness’ of the organisations that took part in the study. The results of these questions were correlated with question 9 to determine the effect of lean manufacturing methods and tools on environmental performance.
5. Which of the following lean manufacturing tools related to TPM has your company implemented?(see Table 2) 6. Which of the following lean manufacturing tools related to Autonomation has your company implemented? (see Table 2)
7. Which of the following lean manufacturing tools related to VSM has your company implemented? (see Table 2) 8. Which of the following lean manufacturing tools related to Kaizen/CI has your company implemented? (see Table 2)
9. Estimate the percentage of the improvement achieved in the following performance indicators due to the implementation of lean.
Material use - quantities and types of materials used (Ditz and Ranganathan, 1997) - e.g. less material used per unit of product; less water consumption per unit of product; less packing material discharged per unit of product; less hazardous material used in the production process; increase water reused; increase processed, recycled or reused materials, etc.
Energy consumption - quantities and types of energy used or generated (Ditz and Ranganathan, 1997) - e.g. less energy used per unit of product; less energy used per service or customer; increase in energy saved due to energy conservation, etc.
1 2 3 4 5 6 7 8 9 10 11 12 13 14 15 16 17 18 19 20 21 22 23 24 25 26 27 28 29 30 31 32 33 34 35 36 37 38 39 40 41 42 43 44 45 46 47 48 49 50 51 52 53 54 55 56 57 58 59 60 61
before recycling treatment, or disposal (Ditz and Ranganathan, 1997) - e.g. less waste per unit of product; less total waste for disposal, increase hazardous waste recycled; increase hazardous waste eliminated due to material substitution, etc.
Pollutant releases – quantities and types of pollutants released to air, water and/or land (Ditz and Ranganathan, 1997) - e.g.
less specific emissions per unit of product; less wasted energy, less air emissions having ozone depletion and global climate potential, less material disposed to land fields, etc.
Table 2. Essential lean manufacturing methods and tools (adapted from Belekoukias et al., 2014 and Rocha-Lona et al. 2013)
Lean Methods
JIT TPM Autonomation VSM Kaizen/CI
Lean Tools
One piece flow OEE
Mistake proofing/Poka-yoke
Current state
map 5S
Pull system SMED Andon/visual control system
Future state
map Brainstorming
Takt time 5S Full work
system Flow diagrams
Continuous flows Levelled
production
Autonomous
maintenance Kanbans
Cellular manufacturing
Planned
maintenance Data checks
Visual control Quality
maintenance 5whys
Kanban/Pull production Initial control before starting production Pareto chart Multifunctional employees Safety, hygiene and the environment Run chart
JIT purchasing Gantt chart
VSM Process map Mistake proofing/Poka-yoke
This study replicated the methodological approach followed by Belekoukias et al. (2014)
for filling and distributing the questionnaire. Thus, the survey targeted operation related
executives (e.g. Chief Operating Officers – COOs), operations/production/quality
directors/managers, operations/process improvement managers/engineers and lean six sigma
black belts who had knowledge on the subject and were familiar with the production
processes of their organisations. According to Belekoukias et al. (2014), this type of
respondents have both technical expertise on the subject matter and an accurate
1 2 3 4 5 6 7 8 9 10 11 12 13 14 15 16 17 18 19 20 21 22 23 24 25 26 27 28 29 30 31 32 33 34 35 36 37 38 39 40 41 42 43 44 45 46 47 48 49 50 51 52 53 54 55 56 57 58 59
also contributed in reducing the subjectivity of the study as these respondents had a deep and
accurate understanding of their company’s environmental performance before and after the
lean implementation. In order to obtain less subjective and more uniform answers, the
respondents were also briefed about various aspects of the questionnaire, including the Likert
scale. Following the recommendations of Saunders et al. (2012) and Robson and McCartan
(2016) to avoid/minimise any potential biased answers and protect the own personal privacy,
interest and integrity of the respondents, the questionnaires were anonymous. Due to the
complexity of adding an extra variable like ‘time’ to the analysis, the time taken by the
surveyed organisations to sustain and/or reach the improvements achieved was not
considered within the scope of the study. This ‘extra-variable’ can, however, be considered
part of the future research agenda proposed from this study.
Besides the strategies employed to avoid biased answers, the questionnaire was validated,
as suggested by Robson and McCartan (2016) and Groves et al. (1999), through a small-scale
pilot study with experts. In this case, five experts from industry and academia where
requested to check the questionnaire for reliability threats such as subject or participant error,
subject or participant bias, observer error and observer bias (Robson and McCartan, 2016).
Participant error and bias were further addressed by eliminating ambiguous and irrelevant
questions (Binti Aminuddin et al., 2015). Experts also provided feedback on structural,
presentation and linguistic aspects of the questionnaire and whether additional questions were
needed to meet the objectives of the research. Observer error and bias were irrelevant to the
questionnaire as fixed-alternative questions that did not require interpretation were used
(Binti Aminuddin et al., 2015). Some questions were rectified and clarified further as a
results of the pilot study.
Since this was an explanatory study, the questionnaires were distributed to respondents
1 2 3 4 5 6 7 8 9 10 11 12 13 14 15 16 17 18 19 20 21 22 23 24 25 26 27 28 29 30 31 32 33 34 35 36 37 38 39 40 41 42 43 44 45 46 47 48 49 50 51 52 53 54 55 56 57 58 59 60 61
LinkedIn as a primary channel. In this line, 618 questionnaires were distributed directly
through personal messages to lean experts (i.e. Chief Operating Officers – COOs),
operations/production/quality directors/managers, operations/process improvement
managers/engineers and lean six sigma black belts, along with a cover letter introducing the
research and indicating its purpose. Additionally, the questionnaires were forwarded via
e-mails to personal contacts of the authors. To broaden the pool of respondents, personal
contacts were also requested to push forward the questionnaire to their own networks,
producing in this way a ‘snowballing sampling technique’ (Horwitz et al., 2006). When
initially contacted, the potential respondents were asked whether their organisations had
implemented lean and whether they considered it as the main operations improvement
strategy deployed by their companies. If the answer was positive to both of these questions,
then the questionnaire was administrated to the respondent. Otherwise, the organisation was
considered not suitable for the study. Out of the more than 618 questionnaires distributed,
250 responses were obtained. This sample size was considered acceptable, based on
comparative studies in similar fields (e.g. Kirkham et al. 2014; Binti Aminuddin et al., 2015;
Tachizawa and Gimenez, 2010; Kumar et al. 2014), to meet the objectives of this research
and address the research question previously formulated.
To test the validity and reliability of the measurement scales used in this paper, firstly a
Cronbach’s Alpha test was conducted to test the reliability of the constructs. The test findings
are shown in Table 3, which shows that all values are within the acceptable ranges (>=0.70).
To test the constructs for convergent validity, the Average Variance Explained (AVE) factor
was calculated. This AVE factor should be > 0.5 to ensure such validity of the constructs.
Additionally, the Composite Reliability (CR) was also computed. In this case, to ensure the
Composite Reliability of the constructs CR should be >.70. As indicated by Table 3, AVE
1 2 3 4 5 6 7 8 9 10 11 12 13 14 15 16 17 18 19 20 21 22 23 24 25 26 27 28 29 30 31 32 33 34 35 36 37 38 39 40 41 42 43 44 45 46 47 48 49 50 51 52 53 54 55 56 57 58 59
convergent validity and the composite reliability of the constructs under study. To test the
discriminant validity of the constructs, Maximum Shared Variance (MSV) and Average
Shared Variance (ASV) were computed. For discriminant validity, MSV should be < AVE
and ASV < AVE. As evidenced from Table 3, all the values were within the acceptable
ranges, thus also confirming the discriminant validity of the constructs.
To test for the non-response bias, an independent t-test was conducted and compared with
the early and late survey responses. The analysis showed that the t-test values were not
significant, hence suggesting that there was not a significant difference between the early and
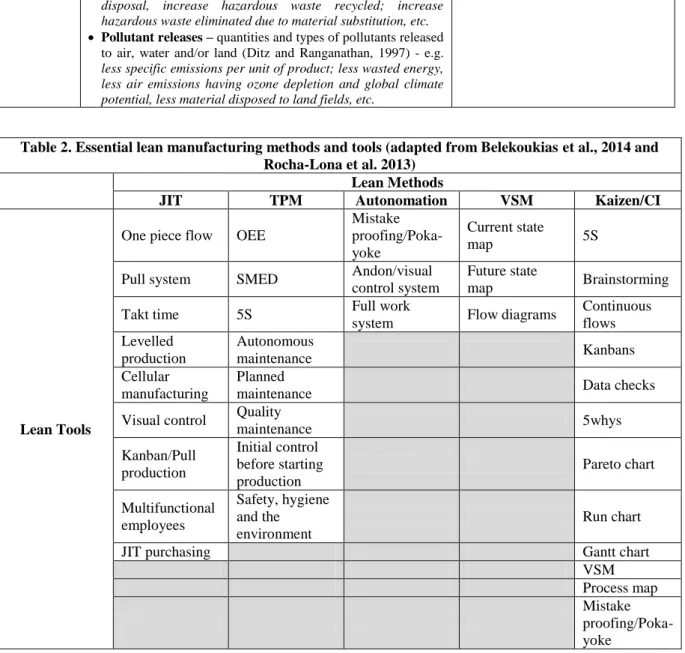
late respondents. We also tested the data for common method bias. To do this, a Harman's
single factor score test, shown in Table 4, was conducted. It showed that the data did not
suffer from common methods bias issues as the variance explained by the single factor was
<50% (no single variable accounted for more than 36% of the variance).
Table 3. Reliability, Convergent Validity and Discriminant Validity
Constructs
No. of
Items AVE
Composite Reliability
(CR)
Cronbach's Alpha
MSV ASV
VSM 3 0.69 0.74 0.71 .429 .280
Kaizen 12 0.55 0.86 0.82 .452 .362
Autonomation 3 0.59 0.74 0.70 .279 .233
TPM 8 0.53 0.79 0.74 .311 .246
JIT 9 0.54 0.79 0.81 .452 .332
AVE > .50; CR>.70; Cronbach’s Alpha >.70; MSV < AVE; and ASV < AVE.
Table 4. Harman's single factor score test (Total Variance Explained)
Component
Initial Eigenvalues Extraction Sums of Squared Loadings
Total % of Variance Cumulative % Total % of Variance Cumulative %
1 3.274 36.372 36.372 3.274 36.372 36.372
2 2.801 31.125 67.498
3 .617 6.850 74.348
4 .586 6.513 80.861
5 .526 5.840 86.701
6 .384 4.266 90.967
1 2 3 4 5 6 7 8 9 10 11 12 13 14 15 16 17 18 19 20 21 22 23 24 25 26 27 28 29 30 31 32 33 34 35 36 37 38 39 40 41 42 43 44 45 46 47 48 49 50 51 52 53 54 55 56 57 58 59 60 61
9 .203 2.254 100.000
Extraction Method: Principal Component Analysis.
The collected data was then subjected to a correlation analysis, which was performed
using the IBM SPSS Statistics software version 23, to investigate the effect of lean methods
on environmental performance. To verify the findings of the correlation analysis, a structural
equation modelling (SEM) analysis was subsequently performed using the AMOS 22
software. SEM has emerged as a powerful statistical analysis technique that combines the
factor analysis and multiple regression analysis, to analyse the structural relationship between
measured variables (Kumar et al., 2011; Kumart et al., 2008; Shah and Goldstein, 2006;
Koufteros, 1999). SEM has been previously used in similar lean studies, e.g. Belekoukias et
al. (2014), to ensure the validity of regression and correlation analyses. Thus, the SEM
analysis conducted in this study was considered of paramount importance to provide a strong
validation for the previous statistical analysis carried out in this study.
4. Results
The findings presented in this section are based on the 250 valid responses obtained from the
survey. The first section of the survey provided a profile and demographics’ overview of the
respondents and their organisations. In this line, over 73% of the respondents were employed
by large organisations (i.e. >250 employees), whereas over 17% and 9% worked for medium
side (i.e. between 50 and 250 employees) and small organisations (i.e. <50 employees)
respectively.
In terms of their locations, 54.40% of the respondents’ companies were operating in
Europe, 20.40% in Asia, 20% in North America, 8.80% in South America, 4.40% in Africa,
and 3.20% in Australia. Respondents were allowed to select more than one continent if their
companies operated in various continental locations. The respondents’ organisations
1 2 3 4 5 6 7 8 9 10 11 12 13 14 15 16 17 18 19 20 21 22 23 24 25 26 27 28 29 30 31 32 33 34 35 36 37 38 39 40 41 42 43 44 45 46 47 48 49 50 51 52 53 54 55 56 57 58 59
primary metals (7.60%), machinery (7.20%), furniture and related products (2%), apparel
(1.60%), printing and related support activities (1.20%), leather and allied products (.40%)
and wood products (.40%). The rest of the organisations (68.80%) were classified as ‘other’,
which included manufacturing sectors such as aeronautics, electronics, food, pharmaceutical,
metal-mechanic, hydraulic components, among others. Although all of the 250 organisations
that participated in the study had implemented all of the lean methods studied (i.e. JIT, TPM,
automation, VSM and kaizen/CI), not all of them had implemented all of the lean tools
shown in Table 2. With this, a level of application of the methods in the studied organisations
was calculated as previously indicated in Section 3. In this context, VSM was the most
extensively applied method with 74.93%, followed by kaizen/CI with 69.50%, TPM with
60.25%, JIT with 54.71% and autonomation with 50.67%.
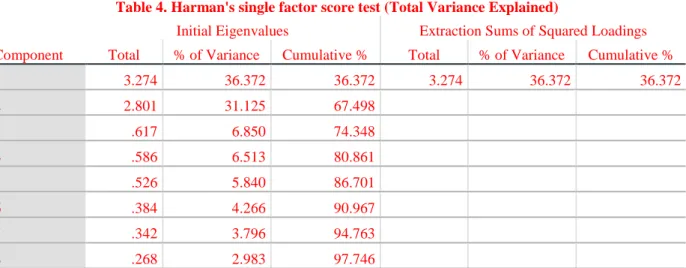
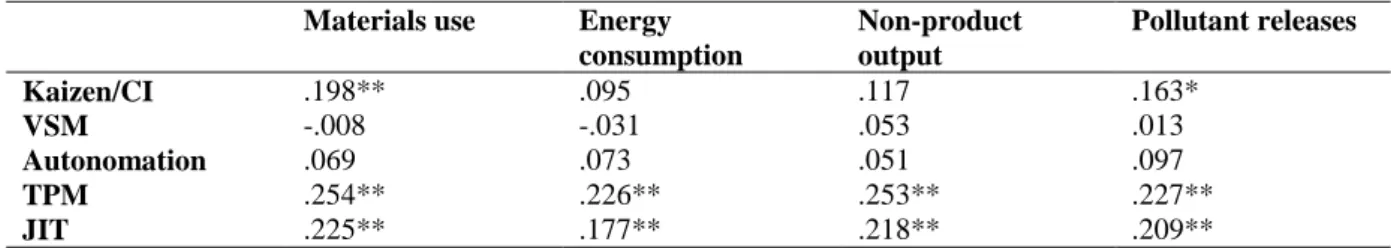
Table 5 shows the results of the correlation analysis, i.e. correlation between the lean
manufacturing methods JIT, TPM, autonomation, VSM and kaizen/CI, and the environmental
performance measures studied, i.e. use of material, energy consumption, non-product output
and pollutant releases.
Table 5. Correlation results
Materials use Energy consumption
Non-product output
Pollutant releases
Kaizen/CI .198** .095 .117 .163*
VSM -.008 -.031 .053 .013
Autonomation .069 .073 .051 .097
TPM .254** .226** .253** .227**
JIT .225** .177** .218** .209**
**. Correlation is significant at the 0.01 level (2-tailed). *. Correlation is significant at the 0.05 level (2-tailed).
In terms of material use, the correlation analysis, see Table 5, showed a statistically
significant relationship between JIT (0.254**), kaizen/CI (0.225**) and TPM (0.198**) with
this measure of environmental performance at a 0.01 level (2-tailed) of significance. The
1 2 3 4 5 6 7 8 9 10 11 12 13 14 15 16 17 18 19 20 21 22 23 24 25 26 27 28 29 30 31 32 33 34 35 36 37 38 39 40 41 42 43 44 45 46 47 48 49 50 51 52 53 54 55 56 57 58 59 60 61
methods. For energy consumption, the correlation analysis suggested that only TPM
(0.226**) and JIT (0.177**) have a statistically significant effect on this measure of
environmental performance at a significant level of 0.01 level (2-tailed), whereas kaizen,
autonomation and VSM do not.
When focusing on non-product output, see Table 5, the correlation analysis showed that
similar to energy consumption, this environmental performance measure is strongly and
positively affected by the TPM (0.253**) and JIT (0.218**) methods at a 0.01 level (2-tailed)
of significance. In this case, the rest of the lean methods studied (i.e. kaizen/CI, autonomation
and VSM) do not have any major effect on non-product output according to the results of the
correlation analysis. Finally, the correlation analysis indicated that in reference to pollutant
releases, the TPM (0.227*) and JIT (0.209**) lean methods have a strong effect on this
environmental measure of performance at a significant level of 0.01 level (2-tailed) while
kaizen/CI (0.163*) presents the same level of impact but at 0.05 level (2-tailed) level of
significance.
Table 6 illustrates and summarises the results of the correlation analysis and the strength
of the impact of the lean methods studied on the four measures of environmental
performance. For instance, Table 6 indicates that although all three TPM, JIT and kaizen/CI
have a statistically significant impact on the use of materials, the strongest effect is that of
TPM, followed JIT and kaizen/CI. For the same example, Table 6 also specifies that
autonomation and VSM do not have any effect on materials use as the correlation analysis
did not show any statistical significance between these variables. From Table 6, and the
correlation analysis presented in Table 5, it is evident that TPM and JIT are the lean methods
that have the strongest effect on environmental performance, followed by kaizen/CI. On the
other hand, VSM and autonomation do not seem to have any impact on these environmental
1 2 3 4 5 6 7 8 9 10 11 12 13 14 15 16 17 18 19 20 21 22 23 24 25 26 27 28 29 30 31 32 33 34 35 36 37 38 39 40 41 42 43 44 45 46 47 48 49 50 51 52 53 54 55 56 57 58 59
improve the OEE of production equipment through the TPM method will have the strongest
positive effect on the environmental performance of manufacturing organisations, followed
by the implementation of a JIT delivery strategy, and the adoption of a kaizen/CI culture and
use of its tools. In contrast, the results of this study, see Tables 5 and 6, indicate that no
improvement in environmental performance will be achieved through the implementation/use
of autonomation and VSM.
Table 6. Illustration and summary of correlation results
Materials use Energy consumption
Non-product output
Pollutant releases
Kaizen/CI + 0 0 +
VSM 0 0 0 0
Autonomation 0 0 0 0
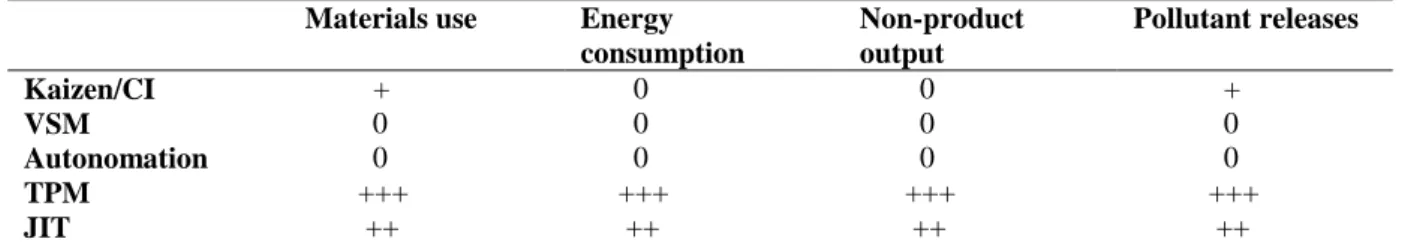
TPM +++ +++ +++ +++ JIT ++ ++ ++ ++ Notes: +++: strongest effect; ++: second strongest effect; +: third strongest effect – all of them statistically significant 0: Non-statistically significant effect
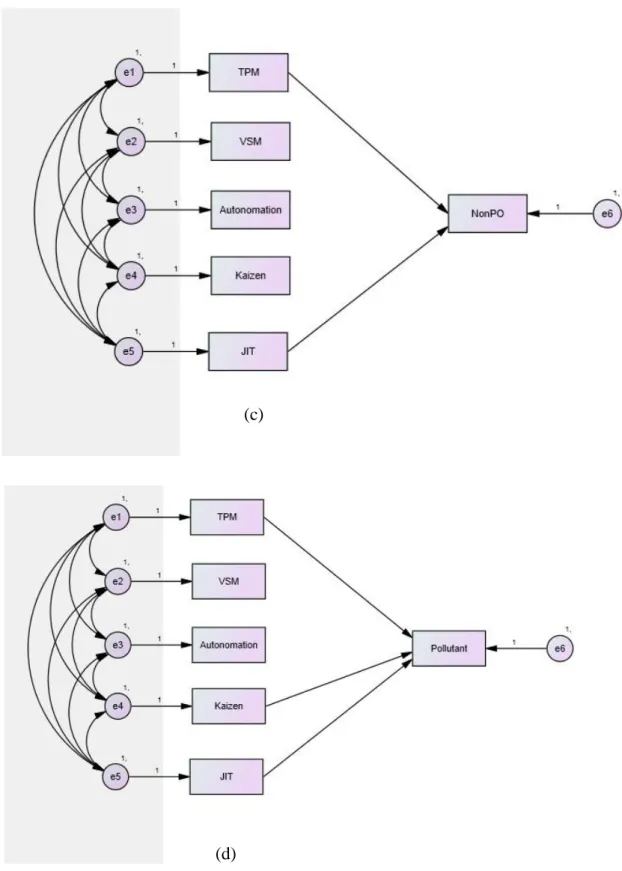
To cross verify the findings of the correlation analysis, the SEM technique was applied.
The structural equation model focused on analysing the impact of each of the five lean
methods studied on the four environmental performance measures. Therefore, four SEM
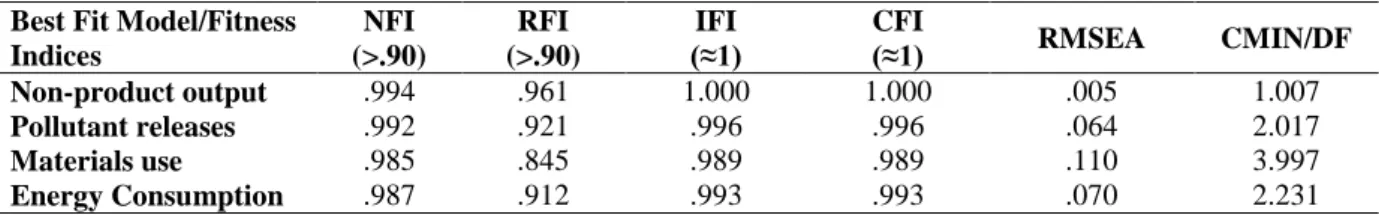
models, see Figures 2(a), 2(b), 2(c) and 2(d), were constructed. The fitness indices of the
best-fit model, for each environmental performance measure are shown in Table 7, which
shows that all of them are within acceptable ranges. It is evident that the SEM models verify
the correlation findings, for example, for material use, the best-fit model confirms a positive
relationship with TPM, JIT and kaizen/CI and the absence of a significant relationship of this
environmental measure with autonomation and VSM, see Figure 2(a). Thus, the SEM model
corroborates the overall findings of the correlation analysis by showing that TPM and JIT
affect all the four environmental performance measures, whereas kaizen/CI only have an
impact on materials use and pollutant releases while VSM and autonomation do not show any
1 2 3 4 5 6 7 8 9 10 11 12 13 14 15 16 17 18 19 20 21 22 23 24 25 26 27 28 29 30 31 32 33 34 35 36 37 38 39 40 41 42 43 44 45 46 47 48 49 50 51 52 53 54 55 56 57 58 59 60 61
1 2 3 4 5 6 7 8 9 10 11 12 13 14 15 16 17 18 19 20 21 22 23 24 25 26 27 28 29 30 31 32 33 34 35 36 37 38 39 40 41 42 43 44 45 46 47 48 49 50 51 52 53 54 55 56 57 58 59
Figure 2. Best-fit model for (a) Material use, (b) Energy consumption, (c) Non-product output, and (d) Pollutant releases
1 2 3 4 5 6 7 8 9 10 11 12 13 14 15 16 17 18 19 20 21 22 23 24 25 26 27 28 29 30 31 32 33 34 35 36 37 38 39 40 41 42 43 44 45 46 47 48 49 50 51 52 53 54 55 56 57 58 59 60 61
Table 7. Fitness indices for best-fit path models
Best Fit Model/Fitness Indices
NFI (>.90)
RFI (>.90)
IFI (≈1)
CFI
(≈1) RMSEA CMIN/DF
Non-product output .994 .961 1.000 1.000 .005 1.007
Pollutant releases .992 .921 .996 .996 .064 2.017
Materials use .985 .845 .989 .989 .110 3.997
Energy Consumption .987 .912 .993 .993 .070 2.231
5. Discussion of results
5.1 Material use measure
The correlation and SEM analyses suggested that TPM, JIT and kaizen/CI have a positive
effect on the use of materials while autonomation and VSM do not, see Tables 5-7.
In the case of TPM, it intends to improve the performance and conditions of production
equipment (Konecny and Thun, 2011). Thus, it is understandable to assume that TPM will
have a positive effect on the use of material as production equipment that runs at an optimum
condition will process raw material more efficiently and with less waste (Eti et al., 2004).
Jasiulewicz-Kaczmarek (2014) comments that TPM provides a strict control on the
functioning of production equipment, which reduces unplanned failures and human errors
that in many cases result in raw material being wasted. Also, the material/resources used to
run production equipment are reduced by TPM. For example, Chiarini (2014) empirically
found that TPM helps to reduce oil leakages. Fliedner (2008) suggests that TPM’s 5S
achieves a well-organised, cleaned, developed and sustained work place. Thus, this tool
assists in a faster identification of spills and leaks, contributing in this way to the reduction of
unnecessary material consumption. Furthermore, it can reduce materials and chemicals’
usage due to well-organised equipment, materials and parts. Keeping the floor clean to
clearly expose any leak in a system is also one of the 5S characteristics that have a positive
impact on reducing waste of material (Torielli et al.,2011).
The positive effect of JIT on the use of material was found to be the second most
1 2 3 4 5 6 7 8 9 10 11 12 13 14 15 16 17 18 19 20 21 22 23 24 25 26 27 28 29 30 31 32 33 34 35 36 37 38 39 40 41 42 43 44 45 46 47 48 49 50 51 52 53 54 55 56 57 58 59
significant and positive effect on quality by reducing inventory and consequently exposing
problems (Belekoukias et al., 2014;Cua et al., 2006). Subsequently, it is also well established
that quality reduces the consumption of material by eliminating/reducing scrap and rework
(Shingo, 1989). This indicates that JIT can have a positive effect on the consumption of
material through quality. In addition, as previously discussed, by reducing inventory, the use
of other resources/materials needed to safely store inventory, e.g. electricity or gas, can be
reduced (Franchetti et al., 2009). Garza-Reyes et al. (2016) also suggest that by following the
JIT’s advice of having smaller deliveries, smaller vehicles can be utilised, resulting in less
fuel consumption.
In the case of kaizen, the results obtained from this study are in line with what it has been
strongly stated in the academic literature regarding the positive effects of this lean method on
the use of material. Farish (2009) comments that Toyota has actively adopted kaizen to
minimize environmental effects like disposals to landfill, use of energy and water.
Additionally, Vais et al. (2006) empirically demonstrated that the implementation of lean
techniques such as 5S, kaizen and autonomous maintenance can enhance environmental
performance by optimising ecological resources consumption and production output. Other
authors such as Pampanelli et al.(2011) andRoss and Associates (2000) have also suggested
that kaizen/CI can be used to enhance sustainability, especially through the reduction of
material consumption. Therefore, the positive effect of TPM, JIT and kaizen/CI on material
use found in this study seems to be aligned to these conceptual and empirical evidence
presented.
In contrast, the correlation and SEM analyses did not only indicate a non-effect of
autonomation and VSM on the use of material but also on all the other measures of
environmental performance, i.e. energy consumption, non-product output and pollutant
1 2 3 4 5 6 7 8 9 10 11 12 13 14 15 16 17 18 19 20 21 22 23 24 25 26 27 28 29 30 31 32 33 34 35 36 37 38 39 40 41 42 43 44 45 46 47 48 49 50 51 52 53 54 55 56 57 58 59 60 61
(Shingo, 1989). Following the same reasoning for JIT regarding the positive effect of quality
on the use of material, a positive effect of autonomation on this measure would have been
expected. However, the results of this study contradict this reasoning, and the notion that
some autonomation tools such as visual control systems can contribute in reducing material
consumption and improving sustainability (Bandehnezhad et al., 2012; Vinodh et al., 2011).
However, Biggs (2009) considers that visual control tends to have more side-effects on
environmental performance than direct interventions. This may be one of the reasons as to
why this study did not find a positive effect of this lean method on material use, or any of the
other measures of environmental performance, see Tables 5-7. To have an effect on
environmental performance, Tice et al. (2005) suggest that standard work and visual controls
should be integrated with energy management systems (EMS) responsibilities and processes.
In the case of VSM, Abdulmalek et al. (2007) state that its main objective is to identify
waste in manufacturing systems. The current state VSM identifies value-added and non-value
added activities in transformational processes. Since some environmental wastes are
embedded in the seven lean wastes (Garza-Reyes, 2015a; Garza-Reyes et al., 2014; Carvalho
et al., 2011), it can be implied that identifying wastes in a manufacturing system through a
VSM can have a positive impact on environmental performance. Fliedner (2008) agrees that
VSM magnifies the benefits of environmental performance through less scrap and energy
consumption. Chiarini (2014) found that VSM can be applied to investigate the
environmental effects of manufacturing processes. Kurdve et al. (2011) successfully adapted
the traditional VSM into an environmental-VSM to focus, particularly, on identifying
environmental wastes. However, the results of this study contradict these notions but support
those from Venkat and Wakeland (2006) and Brown et al. (2014), who suggest various
limitations of this lean method when used for the improvement of environmental
1 2 3 4 5 6 7 8 9 10 11 12 13 14 15 16 17 18 19 20 21 22 23 24 25 26 27 28 29 30 31 32 33 34 35 36 37 38 39 40 41 42 43 44 45 46 47 48 49 50 51 52 53 54 55 56 57 58 59
of the potential value and effectiveness of kaizen/CI, autonomation and VSM to not only
reduce material consumption but also reduce energy consumption, non-product output and
pollutant releases. Since the results of this study contradict some of the literature and our
experience, further studies in relation to the effect of these lean methods on environmental
performance are suggested as part of the future research agenda.
5.2 Energy consumption
TPM was found to have the strongest effect on the reduction of energy consumption,
followed by JIT, see Table 6. Equipment operating at an optimum condition will be more
efficient and hence will consume less energy (Eti et al., 2004). Also, TPM can reduce
non-value adding energy use from lighting, heating and cooling during a machine’s standby as
well as reducing the non-value adding energy which in some cases is needed to re-start some
equipment after a breakdown. In an empirical study, Chiarini (2014) found that TPM helps to
turn off the use of energy in a cell and in equipment in general, which lowers non-value
adding standby energy use. Thorough the same study, Chiarini (2014) also found that the
TPM’s tool SMED contributed in reducing electricity consumption in some manufacturing
equipment, although this was not significant. Torielli et al. (2011) suggest that the TPM’s
tool 5S can promote energy efficiency by taking care of the machines and items’ standard
operating procedures as well as developing indicators to show the correct status of a system.
In the case of JIT, since it reduces inventory’s volume (Shingo, 1989), it can help to reduce
the energy required to safely store it (Franchetti et al., 2009). In addition, Chiarini (2014)
found that by grouping machines, staff and workplaces dedicated to similar products in a
single cell (i.e. JIT’s cellular manufacturing) the transportation of material is greatly reduced,
resulting in a significant reduction of energy consumption of electric trucks used to move
1 2 3 4 5 6 7 8 9 10 11 12 13 14 15 16 17 18 19 20 21 22 23 24 25 26 27 28 29 30 31 32 33 34 35 36 37 38 39 40 41 42 43 44 45 46 47 48 49 50 51 52 53 54 55 56 57 58 59 60 61
have a positive effect on the reduction of energy in manufacturing environments. This is
aligned to the results obtained in this study.
In reference to kaizen/CI, autonomation and VSM, the results of the correlation and SEM
analyses on energy consumption are the same as for that of materials use, except for
kaizen/CI, which showed some moderate effect on material use. The possible reasons for
these three lean methods not having an effect on energy consumption, see Tables 5-7, may be
similar to those highlighted in the aforementioned discussion in the material use section.
5.3 Non-product output
Similarly as in the case of energy consumption, TPM and JIT were found to have a positive
effect on non-product output while kaizen/CI, autonomation and VSM were not, see Tables
5-7. Fliedner (2008) comments that TPM is primarily responsible for enhancing the reliability
and durability of equipment and, at the same time, reducing spillages and leakages. This
results in the reduction of solid and hazardous waste (Fliedner, 2008). Eti et al. (2004) also
mention that equipment failures can adversely affect the quality of the end-product, not only
contributing in this way to wasting materials, see Section 5.1, but also producing scrap.
These views are in line with the results obtained from this study. However, TPM may still
have some adverse environmental effects in this category as King and Lenox (2001) argue
that the TPM’s tool SMED increases the number of cleaning products, which leads to raising
disposal of unwanted materials. This, however, is not reflected through the results of this
study. In the case of JIT, a case study carried out by Ross and Associates (2004) revealed that
JIT can reduce the disposal of out-of-date products that result from excessive inventory and
the introduction of new product versions or lack of demand. Additionally, Fliedner (2008)
suggests that the JIT’s pull system can cut down inventory during and post process, reducing
in this way the damage and deterioration of products and hence improving green
1 2 3 4 5 6 7 8 9 10 11 12 13 14 15 16 17 18 19 20 21 22 23 24 25 26 27 28 29 30 31 32 33 34 35 36 37 38 39 40 41 42 43 44 45 46 47 48 49 50 51 52 53 54 55 56 57 58 59
Although the nature of kaizen/CI, autonomation and VSM may suggest that all of these
lean methods would contribute in reducing non-product output through the identification and
elimination of waste as well as the improvement of quality and efficiency (Abdulmalek et al.,
2007; Bhuiyan and Baghel, 2005; Shingo, 1989), their effective implementation, management
and sustainment may also play a critical role in their contribution to enhance environmental
performance. This may have acted as a barrier for the studied organisations to experience the
theoretical environmental benefits that these approaches may contribute with.
5.4 Pollutant releases
Pollutant releases have been widely used as a measure of green performance (King and
Lenox, 2001). In this case, the study found that TPM, JIT and kaizen/CI have a positive effect
on pollutant releases, whereas autonomation and VSM do not, see Tables 5-7. Through an
empirical investigation, Chiriani (2014) found that TPM strongly contributed in reducing
dusts and fumes in five manufacturing organisations. This came as a result of a more
effective maintenance of the filters, piping and chimney of production equipment (Chiriani,
2014). Torielli et al. (2011) comment that the TPM’s 5S tool pays attention to uncontrolled
waste or emissions due to the fact that they do not fit within the standard. Despite the lack of
further research on the effect of maintenance, and TPM, on environmental performance, and
specifically on pollutant releases, it is not difficult to assume that well maintained production
equipment will operate at an optimum level, reducing the emissions of harmful gases to the
atmosphere, including CO2. In the case of JIT, there seems to be some contraction regarding
its effect on the reduction of pollutant releases. For instance, Venkat and Wakeland (2006)
comment that delivering smaller batches increases the frequency of transportation, which
generates a greater amount of CO2 emissions. Also, using larger batches, for example, when
painting cars with the same colour can diminish the emissions of air pollutant, but this